North America Pet Ct Scanning Services Market
Tamaño del mercado en miles de millones de dólares
Tasa de crecimiento anual compuesta (CAGR) :
% 
 USD
7.76 Billion
USD
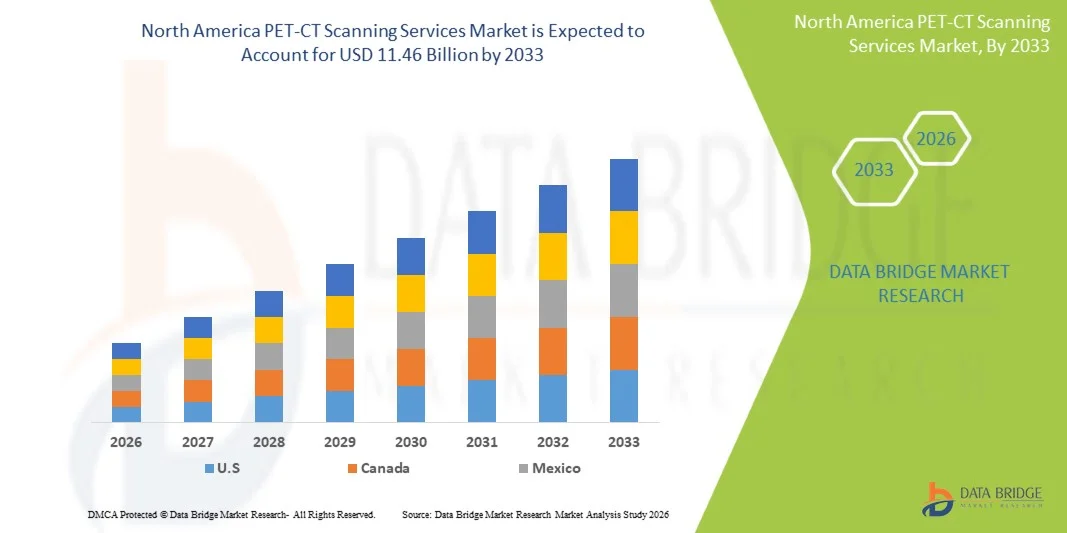
11.46 Billion
2025
2033
USD
7.76 Billion
USD
11.46 Billion
2025
2033
| 2026 –2033 | |
| USD 7.76 Billion | |
| USD 11.46 Billion | |
| % | |
|
Segmentación del mercado de servicios de escaneo PET-CT en Norteamérica, por tipo de servicio (servicios de escaneo PET-CT independientes, servicios de escaneo PET-CT in situ y servicios de escaneo PET-CT móviles), tipo de escaneo (escaneos de cuerpo entero, escaneos de cuerpo parcial), tipo de trazador (FDG [fluorodesoxiglucosa], trazadores no FDG, trazadores nuevos/emergentes), aplicación (oncología, neurología, cardiología, enfermedades infecciosas, enfermedades inflamatorias, otros [ortopedia, pediatría]), usuario final (hospitales, centros de diagnóstico por imágenes, clínicas especializadas, institutos de investigación, otros), canal de distribución (directo e indirecto) - Tendencias de la industria y pronóstico hasta 2033
Tamaño del mercado de servicios de escaneo PET-CT en América del Norte
- El tamaño del mercado de servicios de escaneo PET-CT de América del Norte se valoró en USD 7,76 mil millones en 2025 y se espera que alcance los USD 11,46 mil millones para 2033 , con una CAGR del 5,2% durante el período de pronóstico.
- Los servicios de tomografía PET-TC se refieren a soluciones de diagnóstico por imagen que combinan las tecnologías de Tomografía por Emisión de Positrones (PET) y Tomografía Computarizada (TC) en un único sistema integrado. Esta técnica de imagen híbrida captura la actividad metabólica mediante PET y los detalles anatómicos mediante TC, lo que permite a los médicos detectar, estadificar y monitorizar enfermedades con alta precisión. El servicio incluye procedimientos de escaneo, administración de radiotrazadores, interpretación de imágenes y generación de informes en hospitales, centros de diagnóstico y centros especializados en imagenología.
- El mercado norteamericano de servicios de escaneo PET-CT está experimentando un crecimiento constante a medida que los sistemas de salud priorizan cada vez más el diagnóstico temprano y preciso de enfermedades, en particular el cáncer, los trastornos cardiovasculares y las afecciones neurológicas. La demanda se debe principalmente al aumento de la incidencia de cáncer en Norteamérica, la expansión de las aplicaciones de imágenes híbridas en la medicina de precisión y la creciente preferencia de los médicos por la combinación de imágenes metabólicas y anatómicas para mejorar la precisión diagnóstica.
Análisis del mercado de servicios de escaneo PET-CT en América del Norte
- Los avances tecnológicos, como la PET digital, la reconstrucción de imágenes con IA y la tomografía computarizada de baja dosis, están mejorando la calidad de las exploraciones y la eficiencia operativa, lo que fortalece aún más su adopción en el mercado. Además, la transición hacia centros de diagnóstico por imágenes ambulatorios, la ampliación de los reembolsos en los mercados desarrollados y la creciente inversión en infraestructura de diagnóstico en las economías emergentes están impulsando la disponibilidad de los servicios.
- Los altos costos de los equipos, la escasez de radiólogos cualificados y especialistas en medicina nuclear, y el acceso limitado a radiofármacos en regiones de bajos ingresos siguen dificultando su uso generalizado. En general, el mercado está evolucionando hacia servicios de PET-CT más accesibles, de alta precisión y con flujo de trabajo optimizado en Norteamérica.
- Se espera que EE. UU. domine con una participación de mercado del 83,07 % y que crezca con la CAGR más alta del 5,3 % en el período de pronóstico de 2026 a 2033 debido a su infraestructura de diagnóstico por imágenes bien establecida, la alta adopción de tecnologías PET-CT avanzadas y una fuerte demanda clínica impulsada por la creciente prevalencia del cáncer y las enfermedades crónicas.
- En 2026, se prevé que el segmento de servicios de tomografía PET-CT independiente domine el mercado con una cuota de mercado del 63,51 % gracias a su mayor capacidad de atención, mayor accesibilidad y la fuerte preferencia de los profesionales sanitarios por centros de diagnóstico por imagen dedicados que ofrecen citas más rápidas y experiencia diagnóstica especializada. Los centros independientes suelen operar con horarios extendidos, equipos avanzados y modelos de flujo de trabajo eficientes, lo que les permite ofrecer tiempos de respuesta más rápidos y servicios más rentables en comparación con las unidades hospitalarias.
Alcance del informe y segmentación del mercado de servicios de escaneo PET-CT en América del Norte
|
Atributos |
Perspectivas clave del mercado de servicios de escaneo PET-CT en América del Norte |
|
Segmentos cubiertos |
|
|
Países cubiertos |
América del norte
|
|
Actores clave del mercado |
|
|
Oportunidades de mercado |
|
|
Conjuntos de información de datos de valor añadido |
Además de los conocimientos sobre escenarios de mercado, como el valor de mercado, la tasa de crecimiento, la segmentación, la cobertura geográfica y los principales actores, los informes de mercado seleccionados por Data Bridge Market Research también incluyen un análisis profundo de expertos, epidemiología de pacientes, análisis de la cartera de productos, análisis de precios y marco regulatorio. |
Tendencias del mercado de servicios de escaneo PET-CT en América del Norte
“ Integración rápida de análisis de imágenes impulsados por IA y automatización del flujo de trabajo ”
- Los proveedores están adoptando cada vez más plataformas PET-CT habilitadas con IA que ayudan a los radiólogos a detectar cánceres en etapa temprana, anomalías cardiovasculares y condiciones neurodegenerativas con mayor precisión al analizar automáticamente datos metabólicos y anatómicos, identificar características sutiles de las lesiones y reducir la variabilidad de la interpretación.
- Esta tendencia está impulsada por la creciente carga de casos de oncología, el cambio en América del Norte hacia una atención basada en el valor y la necesidad de resultados de imágenes más rápidos y confiables.
- Los algoritmos de reconstrucción impulsados por IA están reduciendo significativamente la dosis de radiación al tiempo que mejoran la calidad de la imagen, lo que hace que los servicios PET-CT sean más seguros y accesibles para una población de pacientes más amplia.
- Además, las herramientas automatizadas de programación, generación de informes y compartición de imágenes están ayudando a los centros de imágenes a gestionar grandes volúmenes de pacientes, reducir los tiempos de respuesta y mejorar la comunicación entre departamentos.
- La combinación de IA, plataformas de imágenes basadas en la nube y flujos de trabajo de diagnóstico híbridos está posicionando los servicios de exploración PET-CT como un pilar fundamental de la medicina de precisión avanzada, respaldando la planificación personalizada del tratamiento, el seguimiento del tratamiento en tiempo real y la mejora de los resultados de los pacientes en todo el mundo.
Dinámica del mercado de servicios de escaneo PET-CT en América del Norte
Conductor
“Aumento de la incidencia del cáncer y de los trastornos neurológicos”
- La creciente incidencia del cáncer y los trastornos neurológicos se ha convertido en un factor clave que impulsa el crecimiento del mercado de servicios de tomografía PET-CT en Norteamérica. A medida que aumenta la prevalencia del cáncer y las enfermedades neurodegenerativas o neurológicas a nivel mundial, se ha intensificado la demanda de imágenes diagnósticas de alta precisión, como la PET-CT.
- La PET-CT ofrece ventajas cruciales en la detección temprana, la estadificación precisa, la planificación del tratamiento y el seguimiento de la oncología y ciertas indicaciones neurológicas, lo que la convierte en la modalidad diagnóstica preferida donde aumenta la carga de enfermedad. En consecuencia, el aumento de casos de cáncer y trastornos neurológicos en América del Norte se ha traducido en mayores tasas de utilización de los servicios de PET-CT y está impulsando la expansión geográfica de la infraestructura diagnóstica.
- Por ejemplo, en febrero de 2024, la Organización Mundial de la Salud informó que hubo aproximadamente 20 millones de nuevos casos de cáncer en todo el mundo en 2022, y proyectó que la incidencia de cáncer en América del Norte alcanzaría alrededor de 35 millones para 2050, lo que indica un aumento sustancial en el volumen de pacientes oncológicos en América del Norte.
- El aumento de la prevalencia del cáncer y las enfermedades neurológicas en América del Norte se está consolidando como un motor de crecimiento estructural permanente para los servicios de tomografía PET-CT. El aumento continuo de nuevos diagnósticos de cáncer, sumado al crecimiento de la población con trastornos neurológicos crónicos, está creando una necesidad sostenida y acíclica de imágenes moleculares de alta precisión.
- A medida que los protocolos de tratamiento se vuelven cada vez más personalizados y el monitoreo de la terapia se vuelve obligatorio en oncología y neurología, se está fortaleciendo intensamente la dependencia de la PET-CT para la estadificación de la enfermedad, la evaluación del pronóstico y el monitoreo terapéutico.
Restricción/Desafío
“ Desafíos operativos en los hospitales del sector público ”
- Los hospitales públicos de muchas regiones enfrentan desafíos operativos persistentes que afectan directamente la prestación de servicios, la gestión de pacientes y la eficiencia general de la atención médica. Las asignaciones presupuestarias limitadas a menudo provocan escasez de equipos esenciales, retrasos en el mantenimiento y limitaciones en la infraestructura de diagnóstico, incluidos los servicios de imagenología.
- La escasez de personal, especialmente en áreas especializadas como radiología, medicina nuclear y operaciones de imagenología avanzada, sobrecarga aún más la capacidad, lo que resulta en largos tiempos de espera para los pacientes y una reducción en la productividad. Los procesos burocráticos de adquisición ralentizan la adopción de tecnologías avanzadas y limitan la disponibilidad oportuna de consumibles y radiofármacos.
- Por ejemplo, en febrero de 2025, un informe del Contralor y Auditor General de la India (CAG) sobre la infraestructura de salud pública de Delhi reveló que aproximadamente el 21% de los puestos de personal en el departamento de salud estaban vacantes, con una escasez de especialistas (superespecialistas) de hasta el 30%. La auditoría también detectó la falta de equipos y consumibles esenciales, la infrautilización de los servicios de diagnóstico radiológico y los largos tiempos de espera para cirugías mayores, lo que evidencia graves cuellos de botella operativos en los hospitales terciarios.
- Las limitaciones operativas destacadas en los hospitales del sector público (como equipos de diagnóstico no funcionales, tiempos de espera prolongados, escasez de especialistas y desarrollo incompleto de la infraestructura) subrayan una brecha estructural cada vez mayor entre la demanda de diagnóstico y la capacidad del sector público.
- Desde una perspectiva de mercado, esto crea una vía importante para el crecimiento de los servicios de imágenes avanzadas, ya que los sistemas públicos dependen cada vez más de redes de diagnóstico externas, modelos PPP e instalaciones privadas para satisfacer los crecientes volúmenes clínicos.
Alcance del mercado de servicios de escaneo PET-CT en América del Norte
El mercado de servicios de escaneo PET-CT de América del Norte se clasifica en seis segmentos notables que se basan en el tipo de servicio, tipo de escaneo, tipo de trazador, aplicación, usuarios finales y canal de distribución.
- Por tipo de servicio
Según el tipo de servicio, el mercado norteamericano de servicios de PET-CT se segmenta en servicios de PET-CT independientes, servicios de PET-CT in situ y servicios de PET-CT móviles. En 2026, se prevé que el segmento de servicios de PET-CT independientes domine el mercado con una cuota de mercado del 63,51% gracias a su infraestructura consolidada, el mayor volumen de escaneos, la rentabilidad por escaneo y la fuerte preferencia de los profesionales sanitarios por centros de diagnóstico por imagen fijos que ofrecen capacidades de diagnóstico avanzadas.
El segmento de servicios de escaneo PET-CT móvil está creciendo con la CAGR más alta del 6,1% debido a la creciente demanda en áreas remotas y desatendidas, la creciente adopción por parte de hospitales y clínicas más pequeños, la flexibilidad logística mejorada y la menor inversión de capital en comparación con las instalaciones fijas.
- Por tipo de escaneo
Según el tipo de escaneo, el mercado norteamericano de servicios de escaneo PET-CT se segmenta en escaneos de cuerpo completo y escaneos de cuerpo parcial. En 2026, se espera que el segmento de escaneos de cuerpo completo domine con una participación de mercado del 85,81% gracias a su amplia aplicabilidad clínica, su capacidad para proporcionar una evaluación integral de la enfermedad en un solo procedimiento y su sólida adopción para la estadificación del cáncer y el seguimiento del tratamiento.
El segmento de exploraciones de cuerpo completo está creciendo con la CAGR más alta del 5,2 % debido a su papel fundamental en la detección integral de enfermedades, la estadificación y la evaluación de la respuesta a la terapia en aplicaciones de oncología, cardiología y neurología.
- Por tipo de trazador
Según el tipo de trazador, el mercado norteamericano de servicios de escaneo PET-CT se segmenta en FDG (fluorodesoxiglucosa), trazadores sin FDG y trazadores nuevos/emergentes. En 2026, se prevé que el segmento FDG (fluorodesoxiglucosa) domine con una cuota de mercado del 77,48 % gracias a su larga aceptación clínica, su amplia utilidad diagnóstica en diversas enfermedades y su amplia disponibilidad en centros de diagnóstico por PET-CT a nivel mundial.
El segmento de trazadores nuevos/emergentes está creciendo con la CAGR más alta del 6,1 % debido a los crecientes avances en la investigación, la creciente adopción de diagnósticos específicos y personalizados y la expansión de aplicaciones en neurología y oncología de precisión.
- Por aplicación
Según la aplicación, el mercado norteamericano de servicios de escaneo PET-CT se segmenta en oncología, neurología, cardiología, enfermedades infecciosas, enfermedades inflamatorias y otros (ortopedia, pediatría). Se prevé que en 2026, el segmento de oncología domine con una cuota de mercado del 63,97 % debido a la alta prevalencia del cáncer, el uso generalizado del PET-CT para la detección y estadificación de tumores, y su papel crucial en la planificación y el seguimiento del tratamiento.
El segmento de neurología está creciendo con la CAGR más alta del 5,8% debido a la creciente incidencia de trastornos neurológicos, el uso creciente de PET-CT en el diagnóstico temprano de enfermedades y la creciente demanda de técnicas avanzadas de imágenes cerebrales.
- Por el usuario final
En función del usuario final, el mercado norteamericano de servicios de escaneo PET-CT se segmenta en hospitales, centros de diagnóstico por imagen, clínicas especializadas, institutos de investigación y otros. Se prevé que en 2026, el segmento hospitalario domine con una participación de mercado del 54,64 % gracias a la disponibilidad de una infraestructura sanitaria integrada, una mayor afluencia de pacientes y la capacidad de ofrecer servicios PET-CT como parte de estrategias integrales de diagnóstico y tratamiento.
El segmento de centros de diagnóstico por imágenes está creciendo con la CAGR más alta del 5,7 % debido al aumento de los volúmenes de derivaciones, la expansión de las instalaciones de diagnóstico por imágenes independientes y la creciente preferencia de los pacientes por centros especializados que ofrecen tiempos de respuesta más rápidos.
- Por canal de distribución
Según el canal de distribución, el mercado de servicios de escaneo PET-CT en Norteamérica se segmenta en directo e indirecto. En 2026, se espera que el segmento directo domine el mercado con una participación del 76,11% gracias a un mejor control operativo, la interacción directa con el paciente y una mejor coordinación entre los proveedores de servicios de imagenología y las instituciones sanitarias.
El segmento indirecto está creciendo con la CAGR más alta del 6,1% debido a la expansión de las asociaciones con proveedores de servicios externos, un alcance regional más amplio y una mayor dependencia de las redes de referencia para mejorar la accesibilidad al servicio.
Análisis regional del mercado de servicios de escaneo PET-CT en América del Norte
- Estados Unidos domina el mercado de servicios de escaneo PET-CT en Norteamérica, representando el 83,07% de la participación total en 2026. Este liderazgo regional se basa en su infraestructura de salud altamente avanzada, la adopción temprana de tecnologías de imagen innovadoras, la sólida presencia de proveedores líderes de servicios de diagnóstico y las sustanciales inversiones en imágenes oncológicas y cardiológicas. La región se beneficia de la amplia disponibilidad de escáneres PET-CT híbridos, una alta cobertura de reembolso para el diagnóstico de cáncer y continuos avances tecnológicos como la imagenología asistida por IA, las técnicas PET de baja dosis y la innovación en radiotrazadores. Además, la creciente carga de enfermedades crónicas, la mayor concienciación sobre el diagnóstico temprano y el sólido apoyo gubernamental y privado a la investigación en imágenes moleculares refuerzan aún más la posición dominante de Norteamérica en el mercado durante el período de pronóstico.
- EE. UU. registra la tasa de crecimiento anual compuesta (TCAC) más alta de todos los países, con un 5,3 %. Este crecimiento se debe a la rápida expansión de la infraestructura sanitaria, el aumento de las inversiones en diagnóstico por imagen avanzado y la creciente adopción de la tecnología PET-CT para la detección temprana del cáncer en las economías emergentes. La región se beneficia de una creciente prevalencia de trastornos oncológicos y neurológicos, un mejor acceso a las instalaciones de medicina nuclear y las iniciativas gubernamentales destinadas a fortalecer las capacidades radiológicas y diagnósticas. Además, la creciente participación del sector privado, el aumento del turismo médico, la expansión de centros de diagnóstico por imagen especializados y la mayor asequibilidad de los procedimientos PET-CT contribuyen significativamente a la aceleración del mercado estadounidense durante el período de pronóstico.
Análisis del mercado de servicios de escaneo PET-CT en América del Norte
El mercado de servicios de escaneo PET-CT en Norteamérica experimenta un crecimiento sólido y sostenido, impulsado por su infraestructura sanitaria altamente avanzada, la adopción temprana de tecnologías de imagen innovadoras, la sólida presencia de proveedores líderes de servicios de diagnóstico y las sustanciales inversiones en imágenes oncológicas y cardiológicas. La región se beneficia de la amplia disponibilidad de escáneres PET-CT híbridos, una alta cobertura de reembolso para el diagnóstico del cáncer y continuos avances tecnológicos como la imagenología asistida por IA, las técnicas PET de baja dosis y la innovación en radiotrazadores. Además, la creciente carga de enfermedades crónicas, la mayor concienciación sobre el diagnóstico precoz y el sólido apoyo gubernamental y privado a la investigación en imágenes moleculares refuerzan aún más la posición dominante de Norteamérica en el mercado durante el período de pronóstico.
Perspectiva del mercado de servicios de escaneo PET-CT en América del Norte de EE. UU.
Estados Unidos es el país dominante en el mercado de servicios de escaneo PET-CT en Norteamérica, representando el 83,07% de la participación regional en 2026, y se proyecta que crezca a una sólida tasa de crecimiento anual compuesta (TCAC) del 5,3% entre 2026 y 2033, impulsado por su sofisticado ecosistema de atención médica, la amplia disponibilidad de escáneres PET-CT y la sólida adopción de imágenes moleculares avanzadas en oncología, cardiología y neurología. El país se beneficia de sólidos marcos de reembolso, la rápida integración de herramientas de diagnóstico basadas en IA y una importante inversión en medicina de precisión y desarrollo de radiofármacos.
Información sobre el mercado de servicios de escaneo PET-CT en Canadá y América del Norte
Canadá posee el 10,72 % del mercado norteamericano de servicios de tomografía PET-CT en 2026 y se prevé que crezca a una tasa de crecimiento anual compuesta (TCAC) del 4,7 % entre 2026 y 2033, impulsado por el aumento de las inversiones en infraestructura de diagnóstico por imagen avanzado, la creciente adopción de la tecnología PET-CT para aplicaciones oncológicas, neurológicas y cardiológicas, y un mayor énfasis en la detección temprana de enfermedades dentro del sistema de salud pública. El país está experimentando una expansión constante de las instalaciones de medicina nuclear, un mejor acceso a radiotrazadores y una mayor colaboración entre hospitales, centros de diagnóstico por imagen e instituciones de investigación. Además, las iniciativas gubernamentales de apoyo, las políticas de reembolso favorables y la continua modernización de los equipos de diagnóstico por imagen en todas las provincias contribuyen al crecimiento sostenido del mercado canadiense durante el período de pronóstico.
Cuota de mercado de servicios de escaneo PET-CT en América del Norte
El mercado de servicios de escaneo PET-CT de América del Norte está liderado principalmente por empresas bien establecidas, entre las que se incluyen:
- C-HCA, Inc. (EE. UU.)
- Siemens Healthineers AG (Alemania)
- RadNet, Inc. (EE. UU.)
- GenesisCare (Australia)
- Red de Radiología I-MED (Australia)
- Medica Group Ltd (Reino Unido)
- Servicios de imágenes del Capitolio (EE. UU.)
- Shared Medical Services Inc. (EE. UU.)
- Circle Health Group Ltd (Reino Unido)
- Fortis Healthcare (India)
- Alliance Medical Limited (Reino Unido)
- Grupo InHealth (Reino Unido)
- Dignity Health (EE. UU.)
- Apollo Hospitals Enterprises Ltd. (India)
- NM Medical (India)
- Nuclear (India)
- Cobalt Health (Reino Unido)
- DMS Health (EE. UU.)
- Cardiac Imaging, Inc. (EE. UU.)
- Servicios de atención médica Alliance-HNI (EE. UU.)
Últimos avances en el mercado de servicios de escaneo PET-CT en América del Norte
- En octubre de 2025, la división DeepHealth de RadNet firmó una carta de intención con GE Healthcare para impulsar conjuntamente la innovación y la adopción de imágenes basadas en IA en múltiples modalidades. El acuerdo busca ampliar el acceso a tecnologías avanzadas de imagenología, facilitar los flujos de trabajo de escaneo remoto e integrar herramientas de IA para mejorar la precisión diagnóstica y la eficiencia de los informes.
- En noviembre de 2025, RadNet adquirió Cimar UK, empresa británica de servicios de imagenología, lo que fortalece las capacidades de DeepHealth en la generación de informes de imagenología con IA y el cribado basado en imágenes. Se espera que la adquisición impulse la presencia de RadNet en Europa y acelere su ambición de ofrecer diagnósticos remotos y servicios de imagenología con IA en Norteamérica.
- En noviembre de 2025, RadNet amplió sus servicios de escaneo remoto mediante la adquisición de activos de Alpha-RT. Esta expansión mejora la oferta integral de imágenes remotas de RadNet, lo que permite una mayor disponibilidad del servicio y una mayor capacidad para flujos de trabajo de diagnóstico distribuidos.
- En octubre de 2025, I‑MED inauguró su primer centro de tomografía por emisión de positrones (TEP/TC) en el Hospital Privado Mater de Rockhampton, lo que permitió ofrecer imágenes diagnósticas avanzadas por TEP/TC a Queensland Central. Este desarrollo elimina la necesidad de que los pacientes viajen más de 300 km para someterse a TEP/TC en otras ciudades, mejorando así el acceso al diagnóstico oportuno de cáncer, enfermedades cardíacas y neurológicas. La instalación de I‑MED representa un impulso más amplio hacia una atención médica regional equitativa al extender los servicios de imagenología de alta calidad más allá de los centros metropolitanos.
- En agosto de 2020, I‑MED Radiology Network anunció la adquisición de Alfred Medical Imaging, un proveedor consolidado de imágenes que ofrece una gama completa de servicios de diagnóstico, incluyendo resonancia magnética y PET/CT. Esta operación amplió significativamente la presencia de I‑MED en Nueva Gales del Sur, añadiendo seis clínicas en el Inner West de Sídney, una en el Hospital Mater de Sídney Norte, además de los contratos existentes para proporcionar servicios de informes radiológicos a las autoridades sanitarias.
SKU-
Obtenga acceso en línea al informe sobre la primera nube de inteligencia de mercado del mundo

- Panel de análisis de datos interactivo
- Panel de análisis de empresas para oportunidades con alto potencial de crecimiento
- Acceso de analista de investigación para personalización y consultas
- Análisis de la competencia con panel interactivo
- Últimas noticias, actualizaciones y análisis de tendencias
- Aproveche el poder del análisis de referencia para un seguimiento integral de la competencia
Tabla de contenido
1 INTRODUCCIÓN
1.1 OBJETIVOS DEL ESTUDIO
1.2 DEFINICIÓN DE MERCADO
1.3 DESCRIPCIÓN GENERAL DEL MERCADO DE SERVICIOS DE EXPLORACIÓN PET-CT EN AMÉRICA DEL NORTE
1.4 LIMITACIONES
1.5 MERCADOS CUBIERTOS
2 SEGMENTACIÓN DEL MERCADO
2.1 MERCADOS CUBIERTOS
2.2 ÁMBITO GEOGRÁFICO
2,3 AÑOS CONSIDERADOS PARA EL ESTUDIO
2.4 MONEDA Y PRECIOS
2.5 MODELO DE VALIDACIÓN DE DATOS TRÍPODE DBMR
2.6 MODELADO MULTIVARIADO
2.7 ENTREVISTAS PRINCIPALES CON LÍDERES DE OPINIÓN CLAVE
2.8 CUADRÍCULA DE POSICIÓN DE MERCADO DBMR
2.9 CUADRÍCULA DE COBERTURA DE APLICACIONES DEL MERCADO
2.1 ANÁLISIS DE LA PARTICIPACIÓN DE LOS PROVEEDORES
2.11 FUENTES SECUNDARIAS
2.12 SUPUESTOS
3 RESUMEN EJECUTIVO
4 INFORMACIÓN PREMIUM
4.1 LAS CINCO FUERZAS DE PORTER
4.2 SEGUIMIENTO DE INNOVACIÓN Y ANÁLISIS ESTRATÉGICO
4.2.1 ANÁLISIS DE GRANDES ACUERDOS Y ALIANZAS ESTRATÉGICAS
4.2.1.1 EMPRESAS CONJUNTAS
4.2.1.2 FUSIONES Y ADQUISICIONES
4.2.1.3 LICENCIAS Y ASOCIACIONES
4.2.1.4 COLABORACIONES TECNOLÓGICAS
4.2.1.5 DESINVERSIONES ESTRATÉGICAS
4.2.2 NÚMERO DE PRODUCTOS EN DESARROLLO
4.2.3 ETAPA DE DESARROLLO
4.2.4 CRONOGRAMAS E HITOS
4.2.5 ESTRATEGIAS Y METODOLOGÍAS DE INNOVACIÓN
4.2.6 EVALUACIÓN Y MITIGACIÓN DE RIESGOS
4.2.7 PERSPECTIVAS FUTURAS
4.3 ANÁLISIS DE PRECIOS
4.4 ANÁLISIS DE LA CADENA DE SUMINISTRO – MERCADO DE SERVICIOS DE ESCANEADO POR PET-CT EN AMÉRICA DEL NORTE
4.4.1 PRODUCCIÓN DE RADIOTRAZADORES E ISÓTOPOS
4.4.2 COMPOSICIÓN, CONTROL DE CALIDAD Y DISTRIBUCIÓN DE RADIOFARMACIA
4.4.3 FABRICACIÓN, INSTALACIÓN Y SERVICIO DE SOPORTE PARA ESCÁNER PET-CT
4.4.4 OPERACIONES DE INSTALACIONES DE IMÁGENES (HOSPITALES, CENTROS INDEPENDIENTES Y UNIDADES MÓVILES)
4.4.5 FLUJO DE TRABAJO CLÍNICO, PROGRAMACIÓN E INTERFAZ DE REFERENCIA
4.4.6 GESTIÓN DE DATOS, INFORMES Y ARCHIVO
4.4.7 PAGADORES, REEMBOLSOS Y SUPERVISIÓN REGULATORIA
4.4.8 CUELLOS DE BOTELLA, RIESGOS Y RESPUESTAS ESTRATÉGICAS
4.5 ANÁLISIS DE LA CADENA DE VALOR
4.5.1 DESCRIPCIÓN GENERAL
4.5.2 SUMINISTRO DE MATERIA PRIMA
4.5.3 FABRICACIÓN Y PROCESAMIENTO DE COMPONENTES
4.5.4 PROVEEDORES DE EQUIPOS Y TECNOLOGÍA
4.5.5 DISTRIBUCIÓN Y LOGÍSTICA
4.5.6 USUARIOS FINALES (PROVEEDORES Y SECTORES CLÍNICOS)
4.5.7 CONCLUSIÓN
5 ARANCELES E IMPACTO EN EL MERCADO
5.1 TASAS ARANCELARIAS ACTUALES EN LOS MERCADOS DE LOS 5 PAÍSES PRINCIPALES
5.2 PERSPECTIVAS: PRODUCCIÓN LOCAL VS. DEPENDENCIA DE LAS IMPORTACIONES
5.3 DINÁMICA DE LOS CRITERIOS DE SELECCIÓN DE PROVEEDORES
5.4 IMPACTO EN LA CADENA DE SUMINISTRO
5.4.1 ADQUISICIÓN DE MATERIA PRIMA
5.4.2 FABRICACIÓN Y PRODUCCIÓN
5.4.3 LOGÍSTICA Y DISTRIBUCIÓN
5.4.4 PRECIOS Y POSICIÓN EN EL MERCADO
5.5 PARTICIPANTES DE LA INDUSTRIA: ACCIONES PROACTIVAS
5.5.1 OPTIMIZACIÓN DE LA CADENA DE SUMINISTRO
5.5.2 ESTABLECIMIENTOS DE EMPRESAS CONJUNTAS
5.6 IMPACTO EN LOS PRECIOS
5.7 INCLINACIÓN REGULADORA
5.7.1 SITUACIÓN GEOPOLÍTICA
5.7.2 ASOCIACIONES COMERCIALES ENTRE PAÍSES
5.7.3 TRATADOS Y ALIANZAS DE LIBRE COMERCIO
5.7.4 CURSO DE CORRECCIÓN DOMÉSTICA
6 PANORAMA GENERAL DEL MERCADO
6.1 CONDUCTORES
6.1.1 AUMENTO DE LA INCIDENCIA DEL CÁNCER Y LOS TRASTORNOS NEUROLÓGICOS
6.1.2 EXPANSIÓN DE LA INFRAESTRUCTURA DE SALUD EN AMÉRICA DEL NORTE
6.1.3 AUMENTAR LA CONCIENCIA SOBRE EL DIAGNÓSTICO TEMPRANO
6.1.4 CRECIENTE PREFERENCIA POR LAS TÉCNICAS DE IMAGEN HÍBRIDAS
6.2 RESTRICCIONES
6.2.1 ALTO COSTO DE LOS PROCEDIMIENTOS PET-CT Y REEMBOLSO LIMITADO
6.2.2 FALTA DE RADIÓLOGOS Y TECNÓLOGOS CALIFICADOS
6.3 OPORTUNIDADES
6.3.1 EXPANSIÓN EN MERCADOS EMERGENTES COMO ASIA-PACÍFICO Y ORIENTE MEDIO
6.3.2 DESARROLLO DE SERVICIOS PET-CT MÓVILES O DESCENTRALIZADOS
6.3.3 NUEVAS APLICACIONES CLÍNICAS Y AVANCES TECNOLÓGICOS EN IMAGEN PET-CT
6.4 DESAFÍOS
6.4.1 DESAFÍOS OPERATIVOS EN LOS HOSPITALES DEL SECTOR PÚBLICO
6.4.2 PREOCUPACIONES REGLAMENTARIAS Y DE PRIVACIDAD DE DATOS
7 MERCADO DE SERVICIOS DE EXPLORACIÓN PET-CT EN AMÉRICA DEL NORTE, POR TIPO DE SERVICIO
7.1 DESCRIPCIÓN GENERAL
7.2 MERCADO DE SERVICIOS DE EXPLORACIÓN PET-CT EN AMÉRICA DEL NORTE, POR TIPO DE SERVICIO, 2018-2033 (MILES DE USD)
7.2.1 SERVICIOS DE EXPLORACIÓN PET-CT INDEPENDIENTES
7.2.2 SERVICIOS DE EXPLORACIÓN PET-CT EN EL LUGAR
7.2.3 SERVICIOS DE EXPLORACIÓN PET-CT MÓVIL
7.3 SERVICIOS DE ESTUDIOS PET-CT INDEPENDIENTES EN AMÉRICA DEL NORTE, POR TIPO, 2018-2033 (MILES DE USD)
7.3.1 SERVICIOS AMBULATORIOS
7.3.2 SERVICIOS PARA PACIENTES INTERNADOS
7.4 SERVICIOS AMBULATORIOS EN AMÉRICA DEL NORTE EN EL MERCADO DE SERVICIOS DE EXPLORACIÓN PET-CT, POR TIPO, 2018-2033 (MILES DE USD)
7.4.1 CENTROS DE IMAGENOLOGÍA INDEPENDIENTES
7.4.2 ATENCIÓN AMBULATORIA HOSPITALARIA
7.5 SERVICIOS DE INTERNACIÓN EN AMÉRICA DEL NORTE EN EL MERCADO DE SERVICIOS DE EXPLORACIÓN PET-CT, POR TIPO, 2018-2033 (MILES DE USD)
7.5.1 HOSPITALES GENERALES
7.5.2 HOSPITALES DE ESPECIALIDADES
7.5.3 CENTROS DE DIAGNÓSTICO
7.6 SERVICIOS DE ESCANEADO POR PET-CT INDEPENDIENTES EN AMÉRICA DEL NORTE, POR REGIÓN, 2018-2033 (MILES DE USD)
7.6.1 AMÉRICA DEL NORTE
7.6.2 EUROPA
7.6.3 ASIA-PACÍFICO
7.6.4 SUDAMÉRICA
7.6.5 ORIENTE MEDIO Y ÁFRICA
7.7 SERVICIOS DE ESCANEADO POR PET-CT EN SITIO EN AMÉRICA DEL NORTE, POR TIPO, 2018-2033 (MILES DE USD)
7.7.1 HOSPITALES DE ATENCIÓN TERCIARIA
7.7.2 CENTROS MÉDICOS ACADÉMICOS
7.7.3 OTROS
7.8 SERVICIOS DE ESCANEADO POR PET-CT EN SITIO EN AMÉRICA DEL NORTE EN EL MERCADO DE SERVICIOS DE ESCANEADO POR PET-CT, POR REGIÓN, 2018-2033 (MILES DE USD)
7.8.1 AMÉRICA DEL NORTE
7.8.2 EUROPA
7.8.3 ASIA-PACÍFICO
7.8.4 SUDAMÉRICA
7.8.5 ORIENTE MEDIO Y ÁFRICA
7.9 SERVICIOS DE ESCANEADO POR PET-CT MÓVIL EN AMÉRICA DEL NORTE, POR TIPO, 2018-2033 (MILES DE USD)
7.9.1 INICIATIVAS DE EXTENSIÓN RURAL
7.9.2 PROGRAMAS DE SALUD PÚBLICA
7.9.3 CAMPAMENTOS DE CHEQUEO DE SALUD CORPORATIVO
7.1 SERVICIOS DE ESCANEADO POR PET-CT MÓVIL EN AMÉRICA DEL NORTE, POR REGIÓN, 2018-2033 (MILES DE USD)
7.10.1 AMÉRICA DEL NORTE
7.10.2 EUROPA
7.10.3 ASIA-PACÍFICO
7.10.4 SUDAMÉRICA
7.10.5 ORIENTE MEDIO Y ÁFRICA
8 MERCADO DE SERVICIOS DE ESCANEADO POR PET-CT EN AMÉRICA DEL NORTE, POR TIPO DE ESCANEADO
8.1 DESCRIPCIÓN GENERAL
8.2 MERCADO DE SERVICIOS DE ESCANEADO POR PET-CT EN AMÉRICA DEL NORTE, POR TIPO DE ESCANEADO, 2018-2033 (MILES DE USD)
8.3 ESCANEOS DE CUERPO ENTERO
8.3.1 ESCANEOS CORPORALES PARCIALES
8.4. Escáneres de cuerpo entero en el mercado de servicios de escaneo PET-CT en Norteamérica, por región, 2018-2033 (en miles de USD)
8.4.1 AMÉRICA DEL NORTE
8.4.2 EUROPA
8.4.3 ASIA-PACÍFICO
8.4.4 SUDAMÉRICA
8.4.5 ORIENTE MEDIO Y ÁFRICA
8.5 MERCADO DE SERVICIOS DE ESCANEADO POR PET-CT EN AMÉRICA DEL NORTE, POR REGIÓN, 2018-2033 (MILES DE USD)
8.5.1 AMÉRICA DEL NORTE
8.5.2 EUROPA
8.5.3 ASIA-PACÍFICO
8.5.4 SUDAMÉRICA
8.5.5 ORIENTE MEDIO Y ÁFRICA
9 MERCADO DE SERVICIOS DE ESCANEADO PET-CT EN AMÉRICA DEL NORTE, POR TIPO DE TRAZADOR
9.1 DESCRIPCIÓN GENERAL
9.2 MERCADO DE SERVICIOS DE ESCANEADO POR PET-CT EN AMÉRICA DEL NORTE, POR TIPO DE TRAZADOR, 2018-2033 (MILES DE USD)
9.2.1 FDG (fluorodeoxiglucosa)
9.2.2 TRAZADORES NO FDG
9.2.3 TRAZADORES NUEVOS/EMERGENTES
9.3 MERCADO DE SERVICIOS DE ESCANEADO POR PET-CT EN AMÉRICA DEL NORTE CON FDG (FLUORODEOXIGLUCOSA), POR REGIÓN, 2018-2033 (MILES DE USD)
9.3.1 AMÉRICA DEL NORTE
9.3.2 EUROPA
9.3.3 ASIA-PACÍFICO
9.3.4 SUDAMÉRICA
9.3.5 ORIENTE MEDIO Y ÁFRICA
9.4 TRAZADORES NO FDG EN EL MERCADO DE SERVICIOS DE ESCANEADO POR PET-CT EN AMÉRICA DEL NORTE, POR TIPO, 2018-2033 (MILES DE USD)
9.4.1 DOTATATE
9.4.2 COLINA
9.4.3 FLUOROTIMIDINA
9.4.4 OTROS (GA-68, AMONÍACO)
9.5 MERCADO DE SERVICIOS DE ESCANEADO POR PET-CT EN AMÉRICA DEL NORTE CON TRAZADORES NO FDG, POR REGIÓN, 2018-2033 (MILES DE USD)
9.5.1 AMÉRICA DEL NORTE
9.5.2 EUROPA
9.5.3 ASIA-PACÍFICO
9.5.4 SUDAMÉRICA
9.5.5 ORIENTE MEDIO Y ÁFRICA
9.6 TRAZADORES NUEVOS/EMERGENTES EN EL MERCADO DE SERVICIOS DE ESCANEADO POR PET-CT EN AMÉRICA DEL NORTE, POR TIPO, 2018-2033 (MILES DE USD)
9.6.1 Acuerdo sobre el Medio Ambiente y la Seguridad
9.6.2 FAPI
9.7 TRAZADORES NUEVOS/EMERGENTES EN EL MERCADO DE SERVICIOS DE ESCANEADO POR PET-CT EN AMÉRICA DEL NORTE, POR REGIÓN, 2018-2033 (MILES DE USD)
9.7.1 AMÉRICA DEL NORTE
9.7.2 EUROPA
9.7.3 ASIA-PACÍFICO
9.7.4 SUDAMÉRICA
9.7.5 ORIENTE MEDIO Y ÁFRICA
10 MERCADO DE SERVICIOS DE ESCANEADO POR PET-CT EN AMÉRICA DEL NORTE, POR APLICACIÓN
10.1 DESCRIPCIÓN GENERAL
10.2 MERCADO DE SERVICIOS DE ESCANEADO POR PET-CT EN AMÉRICA DEL NORTE, POR APLICACIÓN, 2018-2033 (MILES DE USD)
10.2.1 ONCOLOGÍA
10.2.2 NEUROLOGÍA
10.2.3 CARDIOLOGÍA
10.2.4 ENFERMEDADES INFECCIOSAS
10.2.5 ENFERMEDADES INFLAMATORIAS
10.2.6 OTROS (ORTOPÉDICO, PEDIATRÍA)
10.3 MERCADO DE SERVICIOS DE ONCOLOGÍA EN PET-CT EN AMÉRICA DEL NORTE, POR REGIÓN, 2018-2033 (MILES DE USD)
10.3.1 AMÉRICA DEL NORTE
10.3.2 EUROPA
10.3.3 ASIA-PACÍFICO
10.3.4 SUDAMÉRICA
10.3.5 ORIENTE MEDIO Y ÁFRICA
10.4 MERCADO DE SERVICIOS DE NEUROLOGÍA EN PET-CT EN AMÉRICA DEL NORTE, POR REGIÓN, 2018-2033 (MILES DE USD)
10.4.1 AMÉRICA DEL NORTE
10.4.2 EUROPA
10.4.3 ASIA-PACÍFICO
10.4.4 SUDAMÉRICA
10.4.5 ORIENTE MEDIO Y ÁFRICA
10.5 MERCADO DE SERVICIOS DE CARDIOLOGÍA EN PET-CT EN AMÉRICA DEL NORTE, POR REGIÓN, 2018-2033 (MILES DE USD)
10.5.1 AMÉRICA DEL NORTE
10.5.2 EUROPA
10.5.3 ASIA-PACÍFICO
10.5.4 SUDAMÉRICA
10.5.5 ORIENTE MEDIO Y ÁFRICA
10.6 ENFERMEDADES INFECCIOSAS EN EL MERCADO DE SERVICIOS DE EXPLORACIÓN PET-CT EN AMÉRICA DEL NORTE, POR REGIÓN, 2018-2033 (MILES DE USD)
10.6.1 AMÉRICA DEL NORTE
10.6.2 EUROPA
10.6.3 ASIA-PACÍFICO
10.6.4 SUDAMÉRICA
10.6.5 ORIENTE MEDIO Y ÁFRICA
10.7 ENFERMEDADES INFLAMATORIAS EN EL MERCADO DE SERVICIOS DE EXPLORACIÓN PET-CT EN AMÉRICA DEL NORTE, POR REGIÓN, 2018-2033 (MILES DE USD)
10.7.1 AMÉRICA DEL NORTE
10.7.2 EUROPA
10.7.3 ASIA-PACÍFICO
10.7.4 SUDAMÉRICA
10.7.5 ORIENTE MEDIO Y ÁFRICA
10.8 OTROS EN AMÉRICA DEL NORTE EN EL MERCADO DE SERVICIOS DE ESCANEADO POR PET-CT, POR REGIÓN, 2018-2033 (MILES DE USD)
10.8.1 AMÉRICA DEL NORTE
10.8.2 EUROPA
10.8.3 ASIA-PACÍFICO
10.8.4 SUDAMÉRICA
10.8.5 ORIENTE MEDIO Y ÁFRICA
11 MERCADO DE SERVICIOS DE ESCANEADO POR PET-CT EN AMÉRICA DEL NORTE, POR USUARIO FINAL
11.1 DESCRIPCIÓN GENERAL
11.2 MERCADO DE SERVICIOS DE ESCANEADO POR PET-CT EN AMÉRICA DEL NORTE, POR USUARIO FINAL, 2018-2033 (MILES DE USD)
11.2.1 HOSPITALES
11.2.2 CENTROS DE DIAGNÓSTICO POR IMAGEN
11.2.3 CLÍNICAS ESPECIALIZADAS
11.2.4 INSTITUTOS DE INVESTIGACIÓN
11.2.5 OTROS
11.3 HOSPITALES DE AMÉRICA DEL NORTE EN EL MERCADO DE SERVICIOS DE TOMOGRAFÍA PET-CT, POR REGIÓN, 2018-2033 (MILES DE USD)
11.3.1 AMÉRICA DEL NORTE
11.3.2 EUROPA
11.3.3 ASIA-PACÍFICO
11.3.4 SUDAMÉRICA
11.3.5 ORIENTE MEDIO Y ÁFRICA
11.4 CENTROS DE DIAGNÓSTICO POR IMAGEN EN AMÉRICA DEL NORTE EN EL MERCADO DE SERVICIOS DE ESCANEADO POR PET-CT, POR REGIÓN, 2018-2033 (MILES DE USD)
11.4.1 AMÉRICA DEL NORTE
11.4.2 EUROPA
11.4.3 ASIA-PACÍFICO
11.4.4 SUDAMÉRICA
11.4.5 ORIENTE MEDIO Y ÁFRICA
11.5 CLÍNICAS ESPECIALIZADAS EN EL MERCADO DE SERVICIOS DE TOMOGRAFÍA PET-CT EN AMÉRICA DEL NORTE, POR REGIÓN, 2018-2033 (MILES DE USD)
11.5.1 AMÉRICA DEL NORTE
11.5.2 EUROPA
11.5.3 ASIA-PACÍFICO
11.5.4 SUDAMÉRICA
11.5.5 ORIENTE MEDIO Y ÁFRICA
11.6 INSTITUTOS DE INVESTIGACIÓN DE AMÉRICA DEL NORTE EN EL MERCADO DE SERVICIOS DE ESCANEADO POR PET-CT, POR REGIÓN, 2018-2033 (MILES DE USD)
11.6.1 AMÉRICA DEL NORTE
11.6.2 EUROPA
11.6.3 ASIA-PACÍFICO
11.6.4 SUDAMÉRICA
11.6.5 ORIENTE MEDIO Y ÁFRICA
11.7 OTROS MERCADOS DE SERVICIOS DE ESCANEADO POR PET-CT EN AMÉRICA DEL NORTE, POR REGIÓN, 2018-2033 (MILES DE USD)
11.7.1 AMÉRICA DEL NORTE
11.7.2 EUROPA
11.7.3 ASIA-PACÍFICO
11.7.4 SUDAMÉRICA
11.7.5 ORIENTE MEDIO Y ÁFRICA
12 MERCADO DE SERVICIOS DE ESCANEADO POR PET-CT EN AMÉRICA DEL NORTE, POR CANAL DE DISTRIBUCIÓN
12.1 DESCRIPCIÓN GENERAL
12.2 MERCADO DE SERVICIOS DE ESCANEADO POR PET-CT EN AMÉRICA DEL NORTE, POR CANAL DE DISTRIBUCIÓN, 2018-2033 (MILES DE USD)
12.2.1 DIRECT
12.2.2 INDIRECTO
12.3 AMÉRICA DEL NORTE EN EL MERCADO DE SERVICIOS DE ESCANEADO POR PET-CT, POR REGIÓN, 2018-2033 (MILES DE USD)
12.3.1 AMÉRICA DEL NORTE
12.3.2 EUROPA
12.3.3 ASIA-PACÍFICO
12.3.4 SUDAMÉRICA
12.3.5 ORIENTE MEDIO Y ÁFRICA
12.4 INDIRECTO EN EL MERCADO DE SERVICIOS DE ESCANEADO POR PET-CT EN AMÉRICA DEL NORTE, POR REGIÓN, 2018-2033 (MILES DE USD)
12.4.1 AMÉRICA DEL NORTE
12.4.2 EUROPA
12.4.3 ASIA-PACÍFICO
12.4.4 SUDAMÉRICA
12.4.5 ORIENTE MEDIO Y ÁFRICA
13 MERCADO DE SERVICIOS DE ESCANEADO POR PET-CT EN AMÉRICA DEL NORTE, POR REGIÓN
13.1 AMÉRICA DEL NORTE
13.1.1 EE. UU.
13.1.2 CANADÁ
13.1.3 MÉXICO
14 MERCADO DE SERVICIOS DE ESCANEADO POR PET-CT EN AMÉRICA DEL NORTE: PANORAMA DE LA EMPRESA
14.1 ANÁLISIS DE ACCIONES DE LA EMPRESA: GLOBAL
15 ANÁLISIS FODA
16 PERFIL DE LA EMPRESA
16.1 C-HCA, INC.
16.1.1 INSTANTÁNEA DE LA EMPRESA
16.1.2 ANÁLISIS DE INGRESOS
16.1.3 ANÁLISIS DE LAS ACCIONES DE LA EMPRESA
16.1.4 PORTAFOLIO DE PRODUCTOS
16.1.5 DESARROLLO RECIENTE
16.2 SIEMENS HEALTHINEERS AG
16.2.1 INSTANTÁNEA DE LA EMPRESA
16.2.2 ANÁLISIS DE INGRESOS
16.2.3 ANÁLISIS DE LAS ACCIONES DE LA EMPRESA
16.2.4 PORTAFOLIO DE PRODUCTOS
16.2.5 DESARROLLO RECIENTE
16.3 RADNET INC.
16.3.1 INSTANTÁNEA DE LA EMPRESA
16.3.2 ANÁLISIS DE INGRESOS
16.3.3 ANÁLISIS DE LAS ACCIONES DE LA EMPRESA
16.3.4 PORTAFOLIO DE PRODUCTOS
16.3.5 DESARROLLO RECIENTE
16.4 GÉNESISCARE
16.4.1 INSTANTÁNEA DE LA EMPRESA
16.4.2 ANÁLISIS DE LAS ACCIONES DE LA EMPRESA
16.4.3 PORTAFOLIO DE PRODUCTOS
16.4.4 DESARROLLO RECIENTE
16.5 RED DE RADIOLOGÍA I-MED
16.5.1 INSTANTÁNEA DE LA EMPRESA
16.5.2 ANÁLISIS DE LAS ACCIONES DE LA EMPRESA
16.5.3 PORTAFOLIO DE PRODUCTOS
16.5.4 DESARROLLO RECIENTE
16.6 SERVICIOS DE ATENCIÓN MÉDICA DE ALLIANCE-HNI
16.6.1 INSTANTÁNEA DE LA EMPRESA
16.6.2 PORTAFOLIO DE PRODUCTOS
16.6.3 DESARROLLO RECIENTE
16.7 ALLIANCE MEDICAL LIMITED
16.7.1 INSTANTÁNEA DE LA EMPRESA
16.7.2 PORTAFOLIO DE PRODUCTOS
16.7.3 DESARROLLO RECIENTE
16.8 APOLLO HOSPITALES ENTERPRISES LTD.
16.8.1 INSTANTÁNEA DE LA EMPRESA
16.8.2 ANÁLISIS DE INGRESOS
16.8.3 PORTAFOLIO DE PRODUCTOS
16.8.4 DESARROLLO RECIENTE
16.9 SERVICIOS DE IMÁGENES DEL CAPITOLIO
16.9.1 INSTANTÁNEA DE LA EMPRESA
16.9.2 PORTAFOLIO DE PRODUCTOS
16.9.3 DESARROLLO RECIENTE
16.1 IMÁGENES CARDÍACAS, INC.
16.10.1 INSTANTÁNEA DE LA EMPRESA
16.10.2 PORTAFOLIO DE PRODUCTOS
16.10.3 DESARROLLO RECIENTE
16.11 CIRCLE HEALTH GROUP LTD
16.11.1 INSTANTÁNEA DE LA EMPRESA
16.11.2 PORTAFOLIO DE PRODUCTOS
16.11.3 DESARROLLO RECIENTE
16.12 SALUD DEL COBALTO
16.12.1 INSTANTÁNEA DE LA EMPRESA
16.12.2 PORTAFOLIO DE PRODUCTOS
16.12.3 DESARROLLO RECIENTE
16.13 SALUD DIGNITA
16.13.1 INSTANTÁNEA DE LA EMPRESA
16.13.2 PORTAFOLIO DE PRODUCTOS
16.13.3 DESARROLLO RECIENTE
16.14 DMS SALUD
16.14.1 INSTANTÁNEA DE LA EMPRESA
16.14.2 PORTAFOLIO DE PRODUCTOS
16.14.3 DESARROLLO RECIENTE
16.15 FORTIS SALUD
16.15.1 INSTANTÁNEA DE LA EMPRESA
16.15.2 ANÁLISIS DE INGRESOS
16.15.3 PORTAFOLIO DE PRODUCTOS
16.15.4 DESARROLLO RECIENTE
16.16 GRUPO INHEALTH
16.16.1 INSTANTÁNEA DE LA EMPRESA
16.16.2 PORTAFOLIO DE PRODUCTOS
16.16.3 DESARROLLO RECIENTE
16.17 MEDICA GROUP LTD (SUBSIDIARIA DE MEDICA GROUP)
16.17.1 INSTANTÁNEA DE LA EMPRESA
16.17.2 PORTAFOLIO DE PRODUCTOS
16.17.3 DESARROLLO RECIENTE
16.18 NM MÉDICO
16.18.1 INSTANTÁNEA DE LA EMPRESA
16.18.2 PORTAFOLIO DE PRODUCTOS
16.18.3 DESARROLLO RECIENTE
16.19 NUCLEAR
16.19.1 INSTANTÁNEA DE LA EMPRESA
16.19.2 PORTAFOLIO DE PRODUCTOS
16.19.3 DESARROLLO RECIENTE
16.2 SERVICIOS MÉDICOS COMPARTIDOS INC.
16.20.1 INSTANTÁNEA DE LA EMPRESA
16.20.2 PORTAFOLIO DE PRODUCTOS
16.20.3 DESARROLLO RECIENTE
17 CUESTIONARIO
18 INFORMES RELACIONADOS
Lista de Tablas
TABLA 1 MERCADO DE SERVICIOS DE EXPLORACIÓN PET-CT EN AMÉRICA DEL NORTE, POR TIPO DE SERVICIO, 2018-2033 (MILES DE USD)
TABLA 2 SERVICIOS DE ESCANEADO POR PET-CT INDEPENDIENTES EN AMÉRICA DEL NORTE, POR TIPO, 2018-2033 (MILES DE USD)
TABLA 3 SERVICIOS AMBULATORIOS EN AMÉRICA DEL NORTE EN EL MERCADO DE SERVICIOS DE EXPLORACIÓN PET-CT, POR TIPO, 2018-2033 (MILES DE USD)
TABLA 4 SERVICIOS DE INTERNACIÓN EN AMÉRICA DEL NORTE EN EL MERCADO DE SERVICIOS DE EXPLORACIÓN PET-CT, POR TIPO, 2018-2033 (MILES DE USD)
TABLA 5 SERVICIOS DE ESCANEADO POR PET-CT INDEPENDIENTES EN AMÉRICA DEL NORTE EN EL MERCADO DE SERVICIOS DE ESCANEADO POR PET-CT, POR REGIÓN, 2018-2033 (MILES DE USD)
TABLA 6 SERVICIOS DE ESCANEADO POR PET-CT EN SITIO EN AMÉRICA DEL NORTE EN EL MERCADO DE SERVICIOS DE ESCANEADO POR PET-CT, POR TIPO, 2018-2033 (MILES DE USD)
TABLA 7 SERVICIOS DE ESCANEADO POR PET-CT EN SITIO EN AMÉRICA DEL NORTE EN EL MERCADO DE SERVICIOS DE ESCANEADO POR PET-CT, POR REGIÓN, 2018-2033 (MILES DE USD)
TABLA 8 SERVICIOS DE ESCANEADO POR PET-CT MÓVIL EN AMÉRICA DEL NORTE, POR TIPO, 2018-2033 (MILES DE USD)
TABLA 9 SERVICIOS DE ESCANEADO POR PET-CT MÓVIL EN AMÉRICA DEL NORTE EN EL MERCADO DE SERVICIOS DE ESCANEADO POR PET-CT, POR REGIÓN, 2018-2033 (MILES DE USD)
TABLA 10 MERCADO DE SERVICIOS DE ESCANEADO POR PET-CT EN AMÉRICA DEL NORTE, POR TIPO DE ESCANEADO, 2018-2033 (MILES DE USD)
TABLA 11 ESCANEOS DE CUERPO ENTERO EN AMÉRICA DEL NORTE EN EL MERCADO DE SERVICIOS DE ESCANEADO PET-CT, POR REGIÓN, 2018-2033 (MILES DE USD)
TABLA 12 ESCANEOS CORPORALES PARCIALES EN EL MERCADO DE SERVICIOS DE ESCANEADO PET-CT DE AMÉRICA DEL NORTE, POR REGIÓN, 2018-2033 (MILES DE USD)
TABLA 13 MERCADO DE SERVICIOS DE ESCANEADO POR PET-CT EN AMÉRICA DEL NORTE, POR TIPO DE TRAZADOR, 2018-2033 (MILES DE USD)
TABLA 14 MERCADO DE SERVICIOS DE ESCANEADO POR PET-CT DE FDG (FLUORODEOXIGLUCOSA) EN AMÉRICA DEL NORTE, POR REGIÓN, 2018-2033 (MILES DE USD)
TABLA 15 TRAZADORES NO FDG EN EL MERCADO DE SERVICIOS DE ESCANEADO PET-CT DE AMÉRICA DEL NORTE, POR TIPO, 2018-2033 (MILES DE USD)
TABLA 16 TRAZADORES NO FDG EN EL MERCADO DE SERVICIOS DE ESCANEADO POR PET-CT DE AMÉRICA DEL NORTE, POR REGIÓN, 2018-2033 (MILES DE USD)
TABLA 17 TRAZADORES NUEVOS/EMERGENTES EN EL MERCADO DE SERVICIOS DE ESCANEADO POR PET-CT EN AMÉRICA DEL NORTE, POR TIPO, 2018-2033 (MILES DE USD)
TABLA 18 TRAZADORES NUEVOS/EMERGENTES EN EL MERCADO DE SERVICIOS DE ESCANEADO POR PET-CT EN AMÉRICA DEL NORTE, POR REGIÓN, 2018-2033 (MILES DE USD)
TABLA 19 MERCADO DE SERVICIOS DE EXPLORACIÓN PET-CT EN AMÉRICA DEL NORTE, POR APLICACIÓN, 2018-2033 (MILES DE USD)
TABLA 20 MERCADO DE SERVICIOS DE ONCOLOGÍA EN PET-CT DE AMÉRICA DEL NORTE, POR REGIÓN, 2018-2033 (MILES DE USD)
TABLA 21 MERCADO DE SERVICIOS DE NEUROLOGÍA EN PET-CT DE AMÉRICA DEL NORTE, POR REGIÓN, 2018-2033 (MILES DE USD)
TABLA 22 MERCADO DE SERVICIOS DE CARDIOLOGÍA EN PET-CT DE AMÉRICA DEL NORTE, POR REGIÓN, 2018-2033 (MILES DE USD)
TABLA 23 ENFERMEDADES INFECCIOSAS EN EL MERCADO DE SERVICIOS DE EXPLORACIÓN PET-CT DE AMÉRICA DEL NORTE, POR REGIÓN, 2018-2033 (MILES DE USD)
TABLA 24 ENFERMEDADES INFLAMATORIAS EN EL MERCADO DE SERVICIOS DE EXPLORACIÓN PET-CT DE AMÉRICA DEL NORTE, POR REGIÓN, 2018-2033 (MILES DE USD)
TABLA 25 OTROS MERCADOS DE SERVICIOS DE ESCANEADO POR PET-CT EN AMÉRICA DEL NORTE, POR REGIÓN, 2018-2033 (MILES DE USD)
TABLA 26 MERCADO DE SERVICIOS DE ESCANEADO POR PET-CT EN AMÉRICA DEL NORTE, POR USUARIO FINAL, 2018-2033 (MILES DE USD)
TABLA 27 HOSPITALES DE AMÉRICA DEL NORTE EN EL MERCADO DE SERVICIOS DE EXPLORACIÓN PET-CT, POR REGIÓN, 2018-2033 (MILES DE USD)
TABLA 28 CENTROS DE DIAGNÓSTICO POR IMAGEN EN AMÉRICA DEL NORTE EN EL MERCADO DE SERVICIOS DE ESCANEADO PET-CT, POR REGIÓN, 2018-2033 (MILES DE USD)
TABLA 29 CLÍNICAS ESPECIALIZADAS EN EL MERCADO DE SERVICIOS DE EXPLORACIÓN PET-CT DE AMÉRICA DEL NORTE, POR REGIÓN, 2018-2033 (MILES DE USD)
TABLA 30 INSTITUTOS DE INVESTIGACIÓN DE AMÉRICA DEL NORTE EN EL MERCADO DE SERVICIOS DE ESCANEADO POR PET-CT, POR REGIÓN, 2018-2033 (MILES DE USD)
TABLA 31 OTROS MERCADOS DE SERVICIOS DE EXPLORACIÓN PET-CT EN AMÉRICA DEL NORTE, POR REGIÓN, 2018-2033 (MILES DE USD)
TABLA 32 MERCADO DE SERVICIOS DE ESCANEADO POR PET-CT EN AMÉRICA DEL NORTE, POR CANAL DE DISTRIBUCIÓN, 2018-2033 (MILES DE USD)
TABLA 33 MERCADO DIRECTO DE SERVICIOS DE ESCANEADO POR PET-CT EN AMÉRICA DEL NORTE, POR REGIÓN, 2018-2033 (MILES DE USD)
TABLA 34 MERCADO INDIRECTO DE SERVICIOS DE ESCANEADO POR PET-CT EN AMÉRICA DEL NORTE, POR REGIÓN, 2018-2033 (MILES DE USD)
TABLA 35 MERCADO DE SERVICIOS DE ESCANEADO POR PET-CT EN AMÉRICA DEL NORTE, POR PAÍS, 2018-2033 (MILES DE USD)
TABLA 36 MERCADO DE SERVICIOS DE ESCANEADO POR PET-CT EN AMÉRICA DEL NORTE, POR PAÍS, 2018-2033 (MILES DE USD)
CUADRO 37 AMÉRICA DEL NORTE
TABLA 38 MERCADO DE SERVICIOS DE EXPLORACIÓN PET-CT EN AMÉRICA DEL NORTE, POR TIPO DE SERVICIO, 2018-2033 (MILES DE USD)
TABLA 39 SERVICIOS DE ESCANEADO POR PET-CT INDEPENDIENTES EN AMÉRICA DEL NORTE, POR TIPO, 2018-2033 (MILES DE USD)
TABLA 40 SERVICIOS AMBULATORIOS EN AMÉRICA DEL NORTE EN EL MERCADO DE SERVICIOS DE EXPLORACIÓN PET-CT, POR TIPO, 2018-2033 (MILES DE USD)
TABLA 41 SERVICIOS DE INTERNACIÓN EN AMÉRICA DEL NORTE EN EL MERCADO DE SERVICIOS DE EXPLORACIÓN PET-CT, POR TIPO, 2018-2033 (MILES DE USD)
TABLA 42 SERVICIOS DE ESCANEADO POR PET-CT EN SITIO EN AMÉRICA DEL NORTE EN EL MERCADO DE SERVICIOS DE ESCANEADO POR PET-CT, POR TIPO, 2018-2033 (MILES DE USD)
TABLA 43 SERVICIOS DE ESCANEADO POR PET-CT MÓVIL EN AMÉRICA DEL NORTE, POR TIPO, 2018-2033 (MILES DE USD)
TABLA 44 MERCADO DE SERVICIOS DE ESCANEADO POR PET-CT EN AMÉRICA DEL NORTE, POR TIPO DE ESCANEADO, 2018-2033 (MILES DE USD)
TABLA 45 MERCADO DE SERVICIOS DE ESCANEADO POR PET-CT EN AMÉRICA DEL NORTE, POR TIPO DE TRAZADOR, 2018-2033 (MILES DE USD)
TABLA 46 TRAZADORES NO FDG EN EL MERCADO DE SERVICIOS DE ESCANEADO PET-CT DE AMÉRICA DEL NORTE, POR TIPO, 2018-2033 (MILES DE USD)
TABLA 47 TRAZADORES NUEVOS/EMERGENTES EN EL MERCADO DE SERVICIOS DE ESCANEADO POR PET-CT EN AMÉRICA DEL NORTE, POR TIPO, 2018-2033 (MILES DE USD)
TABLA 48 MERCADO DE SERVICIOS DE ESCANEADO POR PET-CT EN AMÉRICA DEL NORTE, POR APLICACIÓN, 2018-2033 (MILES DE USD)
TABLA 49 MERCADO DE SERVICIOS DE ESCANEADO POR PET-CT EN AMÉRICA DEL NORTE, POR USUARIO FINAL, 2018-2033 (MILES DE USD)
TABLA 50 MERCADO DE SERVICIOS DE ESCANEADO POR PET-CT EN AMÉRICA DEL NORTE, POR CANAL DE DISTRIBUCIÓN, 2018-2033 (MILES DE USD)
TABLA 51 MERCADO DE SERVICIOS DE ESCANEADO POR PET-CT EN EE. UU., POR TIPO DE SERVICIO, 2018-2033 (MILES DE USD)
TABLA 52 SERVICIOS DE ESCANEADO POR PET-CT INDEPENDIENTES EN EE. UU., POR TIPO, 2018-2033 (MILES DE USD)
TABLA 53 SERVICIOS AMBULATORIOS EN EL MERCADO DE SERVICIOS DE EXPLORACIÓN PET-CT DE EE. UU., POR TIPO, 2018-2033 (MILES DE USD)
TABLA 54 SERVICIOS DE INTERNACIÓN EN EL MERCADO DE SERVICIOS DE EXPLORACIÓN PET-CT DE EE. UU., POR TIPO, 2018-2033 (MILES DE USD)
TABLA 55 SERVICIOS DE ESCANEADO POR PET-CT EN SITIO EN EE. UU. EN EL MERCADO DE SERVICIOS DE ESCANEADO POR PET-CT, POR TIPO, 2018-2033 (MILES DE USD)
TABLA 56 SERVICIOS DE ESCANEADO POR PET-CT MÓVIL EN EE. UU. EN EL MERCADO DE SERVICIOS DE ESCANEADO POR PET-CT, POR TIPO, 2018-2033 (MILES DE USD)
TABLA 57 MERCADO DE SERVICIOS DE ESCANEADO POR PET-CT EN EE. UU., POR TIPO DE ESCANEADO, 2018-2033 (MILES DE USD)
TABLA 58 MERCADO DE SERVICIOS DE ESCANEADO POR PET-CT DE EE. UU., POR TIPO DE TRAZADOR, 2018-2033 (MILES DE USD)
TABLA 59 TRAZADORES NO FDG EN EL MERCADO DE SERVICIOS DE ESCANEADO POR PET-CT DE EE. UU., POR TIPO, 2018-2033 (MILES DE USD)
TABLA 60 TRAZADORES NUEVOS/EMERGENTES EN EL MERCADO DE SERVICIOS DE ESCANEADO POR PET-CT EN EE. UU., POR TIPO, 2018-2033 (MILES DE USD)
TABLA 61 MERCADO DE SERVICIOS DE ESCANEADO POR PET-CT EN EE. UU., POR APLICACIÓN, 2018-2033 (MILES DE USD)
TABLA 62 MERCADO DE SERVICIOS DE ESCANEADO POR PET-CT EN EE. UU., POR USUARIO FINAL, 2018-2033 (MILES DE USD)
TABLA 63 MERCADO DE SERVICIOS DE ESCANEADO POR PET-CT EN EE. UU., POR CANAL DE DISTRIBUCIÓN, 2018-2033 (MILES DE USD)
TABLA 64 MERCADO DE SERVICIOS DE EXPLORACIÓN PET-CT DE CANADÁ, POR TIPO DE SERVICIO, 2018-2033 (MILES DE USD)
TABLA 65 SERVICIOS DE ESCANEADO POR PET-CT INDEPENDIENTES EN CANADÁ, POR TIPO, 2018-2033 (MILES DE USD)
TABLA 66 SERVICIOS AMBULATORIOS EN EL MERCADO DE SERVICIOS DE EXPLORACIÓN PET-CT DE CANADÁ, POR TIPO, 2018-2033 (MILES DE USD)
TABLA 67 SERVICIOS DE INTERNACIÓN EN CANADÁ EN EL MERCADO DE SERVICIOS DE EXPLORACIÓN PET-CT, POR TIPO, 2018-2033 (MILES DE USD)
TABLA 68 SERVICIOS DE ESCANEADO POR PET-CT EN EL SITIO DE CANADÁ EN EL MERCADO DE SERVICIOS DE ESCANEADO POR PET-CT, POR TIPO, 2018-2033 (MILES DE USD)
TABLA 69 SERVICIOS DE ESCANEADO POR PET-CT MÓVIL EN CANADÁ, POR TIPO, 2018-2033 (MILES DE USD)
TABLA 70 MERCADO DE SERVICIOS DE ESCANEADO POR PET-CT DE CANADÁ, POR TIPO DE ESCANEADO, 2018-2033 (MILES DE USD)
TABLA 71 MERCADO DE SERVICIOS DE ESCANEADO POR PET-CT DE CANADÁ, POR TIPO DE TRAZADOR, 2018-2033 (MILES DE USD)
TABLA 72 TRAZADORES NO FDG DE CANADÁ EN EL MERCADO DE SERVICIOS DE ESCANEADO POR PET-CT, POR TIPO, 2018-2033 (MILES DE USD)
TABLA 73 TRAZADORES NUEVOS/EMERGENTES EN EL MERCADO DE SERVICIOS DE ESCANEADO POR PET-CT DE CANADÁ, POR TIPO, 2018-2033 (MILES DE USD)
TABLA 74 MERCADO DE SERVICIOS DE ESCANEADO POR PET-CT DE CANADÁ, POR APLICACIÓN, 2018-2033 (MILES DE USD)
TABLA 75 MERCADO DE SERVICIOS DE ESCANEADO POR PET-CT DE CANADÁ, POR USUARIO FINAL, 2018-2033 (MILES DE USD)
TABLA 76 MERCADO DE SERVICIOS DE ESCANEADO POR PET-CT DE CANADÁ, POR CANAL DE DISTRIBUCIÓN, 2018-2033 (MILES DE USD)
TABLA 77 MERCADO DE SERVICIOS DE TOMOGRAFÍA PET-CT EN MÉXICO, POR TIPO DE SERVICIO, 2018-2033 (MILES DE USD)
TABLA 78 SERVICIOS DE ESCANEADO POR PET-CT INDEPENDIENTES EN MÉXICO, POR TIPO, 2018-2033 (MILES DE USD)
TABLA 79 SERVICIOS AMBULATORIOS EN EL MERCADO DE SERVICIOS DE TOMOGRAFÍA PET-CT EN MÉXICO, POR TIPO, 2018-2033 (MILES DE USD)
TABLA 80 SERVICIOS DE INTERNACIÓN EN MÉXICO EN EL MERCADO DE SERVICIOS DE TOMOGRAFÍA PET-CT, POR TIPO, 2018-2033 (MILES DE USD)
TABLA 81 SERVICIOS DE ESCANEADO POR PET-CT EN SITIO EN MÉXICO, POR TIPO, 2018-2033 (MILES DE USD)
TABLA 82 SERVICIOS DE ESCANEADO POR PET-CT MÓVIL EN MÉXICO, POR TIPO, 2018-2033 (MILES DE USD)
TABLA 83 MERCADO DE SERVICIOS DE ESCANEADO POR PET-CT EN MÉXICO, POR TIPO DE ESCANEADO, 2018-2033 (MILES DE USD)
TABLA 84 MERCADO DE SERVICIOS DE ESCANEADO POR PET-CT EN MÉXICO, POR TIPO DE TRAZADOR, 2018-2033 (MILES DE USD)
TABLA 85 TRAZADORES NO FDG EN EL MERCADO DE SERVICIOS DE ESCANEADO PET-CT DE MÉXICO, POR TIPO, 2018-2033 (MILES DE USD)
TABLA 86 TRAZADORES NUEVOS/EMERGENTES EN EL MERCADO DE SERVICIOS DE ESCANEADO PET-CT DE MÉXICO, POR TIPO, 2018-2033 (MILES DE USD)
TABLA 87 MERCADO DE SERVICIOS DE ESCANEADO POR PET-CT EN MÉXICO, POR APLICACIÓN, 2018-2033 (MILES DE USD)
TABLA 88 MERCADO DE SERVICIOS DE ESCANEADO POR PET-CT EN MÉXICO, POR USUARIO FINAL, 2018-2033 (MILES DE USD)
TABLA 89 MERCADO DE SERVICIOS DE ESCANEADO POR PET-CT EN MÉXICO, POR CANAL DE DISTRIBUCIÓN, 2018-2033 (MILES DE USD)
Lista de figuras
FIGURA 1 MERCADO DE SERVICIOS DE EXPLORACIÓN PET-CT EN AMÉRICA DEL NORTE: SEGMENTACIÓN
FIGURA 2 MERCADO DE SERVICIOS DE ESCANEADO PET-CT DE AMÉRICA DEL NORTE: TRIANGULACIÓN DE DATOS
FIGURA 3 MERCADO DE SERVICIOS DE EXPLORACIÓN PET-CT EN AMÉRICA DEL NORTE: ANÁLISIS DROC
FIGURA 4 MERCADO DE SERVICIOS DE EXPLORACIÓN PET-CT EN AMÉRICA DEL NORTE: ANÁLISIS DE AMÉRICA DEL NORTE VS. REGIONAL
FIGURA 5 MERCADO DE SERVICIOS DE EXPLORACIÓN PET-CT EN AMÉRICA DEL NORTE: ANÁLISIS DE INVESTIGACIÓN DE EMPRESAS
FIGURA 6 MERCADO DE SERVICIOS DE EXPLORACIÓN PET-CT DE AMÉRICA DEL NORTE: DATOS DEMOGRÁFICOS DE LAS ENTREVISTAS
FIGURA 7 MERCADO DE SERVICIOS DE ESCANEADO PET-CT DE AMÉRICA DEL NORTE: CUADRÍCULA DE POSICIÓN DE MERCADO DE DBMR
FIGURA 8 MERCADO DE SERVICIOS DE EXPLORACIÓN PET-CT DE AMÉRICA DEL NORTE: CUADRÍCULA DE COBERTURA DE APLICACIONES DEL MERCADO
FIGURA 9 MERCADO DE SERVICIOS DE EXPLORACIÓN PET-CT DE AMÉRICA DEL NORTE: ANÁLISIS DE LA PARTICIPACIÓN DE LOS PROVEEDORES
FIGURA 10 RESUMEN EJECUTIVO
FIGURA 11 DECISIONES ESTRATÉGICAS
FIGURA 12 MERCADO DE SERVICIOS DE EXPLORACIÓN PET-CT EN AMÉRICA DEL NORTE: SEGMENTACIÓN
FIGURA 13 TRES SEGMENTOS COMPRENDEN EL MERCADO DE PELÍCULAS DE EMBALAJE MÉDICO DE AMÉRICA DEL NORTE, POR TIPO DE SERVICIO
FIGURA 14 SE ESPERA QUE AMÉRICA DEL NORTE DOMINE EL MERCADO DE SERVICIOS DE ESCANEADO PET-CT EN AMÉRICA DEL NORTE Y SE ESPERA QUE ASIA-PACÍFICO CREZCA CON LA CAGR MÁS ALTA EN EL PERÍODO PRONOSTICADO DE 2026 A 2033
FIGURA 15 SE ESPERA QUE LA INCIDENCIA AUMENTADA DEL CÁNCER Y LOS TRASTORNOS NEUROLÓGICOS IMPULSEN EL MERCADO DE SERVICIOS DE EXPLORACIÓN PET-CT EN AMÉRICA DEL NORTE EN EL PERÍODO DE PRONÓSTICO DE 2026 A 2033
FIGURA 16 SE ESPERA QUE EL SEGMENTO DE SERVICIOS DE ESCANEADO POR PET-CT INDEPENDIENTES REPRESENTE LA MAYOR PARTICIPACIÓN DEL MERCADO DE SERVICIOS DE ESCANEADO POR PET-CT EN AMÉRICA DEL NORTE EN 2026 Y 2033
FIGURA 17 AMÉRICA DEL NORTE ES EL MERCADO DE MÁS RÁPIDO CRECIMIENTO PARA LOS FABRICANTES DE SERVICIOS DE ESCANEADO POR PET-CT EN EL PERÍODO DE PRONÓSTICO DE 2026 A 2033
FIGURA 18 MERCADO DE SERVICIOS DE EXPLORACIÓN PET-CT EN AMÉRICA DEL NORTE, 2024-2033, PRECIO PROMEDIO (USD/SERVICIO)
FIGURA 19 IMPULSORES, RESTRICCIONES, OPORTUNIDADES Y DESAFÍOS DEL MERCADO DE SERVICIOS DE EXPLORACIÓN PET-CT EN AMÉRICA DEL NORTE
FIGURA 20 MERCADO DE SERVICIOS DE EXPLORACIÓN PET-CT EN AMÉRICA DEL NORTE, POR TIPO DE SERVICIO, 2025
FIGURA 21 MERCADO DE SERVICIOS DE EXPLORACIÓN PET-CT EN AMÉRICA DEL NORTE, POR TIPO DE SERVICIO, 2026 A 2033 (MILES DE USD)
FIGURA 22 MERCADO DE SERVICIOS DE EXPLORACIÓN PET-CT EN AMÉRICA DEL NORTE: POR TIPO DE SERVICIO, CAGR (2026-2033)
FIGURA 23 MERCADO DE SERVICIOS DE EXPLORACIÓN PET-CT DE AMÉRICA DEL NORTE, POR TIPO DE SERVICIO, CURVA LIFELINE
FIGURA 24 MERCADO DE SERVICIOS DE ESCANEADO PET-CT DE AMÉRICA DEL NORTE, POR TIPO DE ESCANEADO,
FIGURA 25 MERCADO DE SERVICIOS DE ESCANEADO POR PET-CT EN AMÉRICA DEL NORTE, POR TIPO DE ESCANEADO, 2026 A 2033 (MILES DE USD)
FIGURA 26 MERCADO DE SERVICIOS DE ESCANEADO POR PET-CT EN AMÉRICA DEL NORTE, POR TIPO DE ESCANEADO, CAGR (2025-2036)
FIGURA 27 MERCADO DE SERVICIOS DE ESCANEADO PET-CT DE AMÉRICA DEL NORTE, POR TIPO DE ESCANEADO, CURVA LIFELINE
FIGURA 28 MERCADO DE SERVICIOS DE ESCANEADO POR PET-CT EN AMÉRICA DEL NORTE, POR TIPO DE TRAZADOR, 2025
FIGURA 29 MERCADO DE SERVICIOS DE ESCANEADO POR PET-CT EN AMÉRICA DEL NORTE, POR TIPO DE TRAZADOR, 2026 A 2033 (MILES DE USD)
FIGURA 30 MERCADO DE SERVICIOS DE ESCANEADO POR PET-CT EN AMÉRICA DEL NORTE, POR TIPO DE TRAZADOR, CAGR (2025-2036)
FIGURA 31 MERCADO DE SERVICIOS DE ESCANEADO PET-CT DE AMÉRICA DEL NORTE, POR TIPO DE TRAZADOR, CURVA LIFELINE
FIGURA 32 MERCADO DE SERVICIOS DE ESCANEADO POR PET-CT EN AMÉRICA DEL NORTE, POR APLICACIÓN, 2025
FIGURA 33 MERCADO DE SERVICIOS DE ESCANEADO POR PET-CT EN AMÉRICA DEL NORTE, POR APLICACIÓN, 2026 A 2033 (MILES DE USD)
FIGURA 34 MERCADO DE SERVICIOS DE ESCANEADO POR PET-CT EN AMÉRICA DEL NORTE, POR APLICACIÓN, CAGR (2025-2036)
FIGURA 35 MERCADO DE SERVICIOS DE EXPLORACIÓN PET-CT DE AMÉRICA DEL NORTE, POR APLICACIÓN, CURVA DE LÍNEA DE VIDA
FIGURA 36 MERCADO DE SERVICIOS DE ESCANEADO POR PET-CT EN AMÉRICA DEL NORTE, POR USUARIO FINAL, 2025
FIGURA 37 MERCADO DE SERVICIOS DE ESCANEADO POR PET-CT EN AMÉRICA DEL NORTE, POR USUARIO FINAL, 2026 A 2033 (MILES DE USD)
FIGURA 38 MERCADO DE SERVICIOS DE ESCANEADO POR PET-CT EN AMÉRICA DEL NORTE, POR USUARIO FINAL, CAGR (2025-2036)
FIGURA 39 MERCADO DE SERVICIOS DE ESCANEADO POR PET-CT EN AMÉRICA DEL NORTE, POR USUARIO FINAL, CURVA LIFELINE
FIGURA 40 MERCADO DE SERVICIOS DE ESCANEADO POR PET-CT EN AMÉRICA DEL NORTE, POR CANAL DE DISTRIBUCIÓN, 2025
FIGURA 41 MERCADO DE SERVICIOS DE ESCANEADO POR PET-CT EN AMÉRICA DEL NORTE, POR CANAL DE DISTRIBUCIÓN, 2026 A 2033 (MILES DE USD)
FIGURA 42 MERCADO DE SERVICIOS DE ESCANEADO POR PET-CT EN AMÉRICA DEL NORTE, POR CANAL DE DISTRIBUCIÓN, CAGR (2025-2036)
FIGURA 43 MERCADO DE SERVICIOS DE ESCANEADO POR PET-CT EN AMÉRICA DEL NORTE, POR CANAL DE DISTRIBUCIÓN, CURVA LIFELINE
FIGURA 44 MERCADO DE SERVICIOS DE EXPLORACIÓN PET-CT EN AMÉRICA DEL NORTE, INSTANTÁNEA (2025)
FIGURA 45 MERCADO DE SERVICIOS DE EXPLORACIÓN PET-CT EN AMÉRICA DEL NORTE: PARTICIPACIÓN DE LA EMPRESA 2025 (%)
Metodología de investigación
La recopilación de datos y el análisis del año base se realizan utilizando módulos de recopilación de datos con muestras de gran tamaño. La etapa incluye la obtención de información de mercado o datos relacionados a través de varias fuentes y estrategias. Incluye el examen y la planificación de todos los datos adquiridos del pasado con antelación. Asimismo, abarca el examen de las inconsistencias de información observadas en diferentes fuentes de información. Los datos de mercado se analizan y estiman utilizando modelos estadísticos y coherentes de mercado. Además, el análisis de la participación de mercado y el análisis de tendencias clave son los principales factores de éxito en el informe de mercado. Para obtener más información, solicite una llamada de un analista o envíe su consulta.
La metodología de investigación clave utilizada por el equipo de investigación de DBMR es la triangulación de datos, que implica la extracción de datos, el análisis del impacto de las variables de datos en el mercado y la validación primaria (experto en la industria). Los modelos de datos incluyen cuadrícula de posicionamiento de proveedores, análisis de línea de tiempo de mercado, descripción general y guía del mercado, cuadrícula de posicionamiento de la empresa, análisis de patentes, análisis de precios, análisis de participación de mercado de la empresa, estándares de medición, análisis global versus regional y de participación de proveedores. Para obtener más información sobre la metodología de investigación, envíe una consulta para hablar con nuestros expertos de la industria.
Personalización disponible
Data Bridge Market Research es líder en investigación formativa avanzada. Nos enorgullecemos de brindar servicios a nuestros clientes existentes y nuevos con datos y análisis que coinciden y se adaptan a sus objetivos. El informe se puede personalizar para incluir análisis de tendencias de precios de marcas objetivo, comprensión del mercado de países adicionales (solicite la lista de países), datos de resultados de ensayos clínicos, revisión de literatura, análisis de mercado renovado y base de productos. El análisis de mercado de competidores objetivo se puede analizar desde análisis basados en tecnología hasta estrategias de cartera de mercado. Podemos agregar tantos competidores sobre los que necesite datos en el formato y estilo de datos que esté buscando. Nuestro equipo de analistas también puede proporcionarle datos en archivos de Excel sin procesar, tablas dinámicas (libro de datos) o puede ayudarlo a crear presentaciones a partir de los conjuntos de datos disponibles en el informe.

