Global Ar Cloud Market
Taille du marché en milliards USD
TCAC :
% 
 USD
7.07 Billion
USD
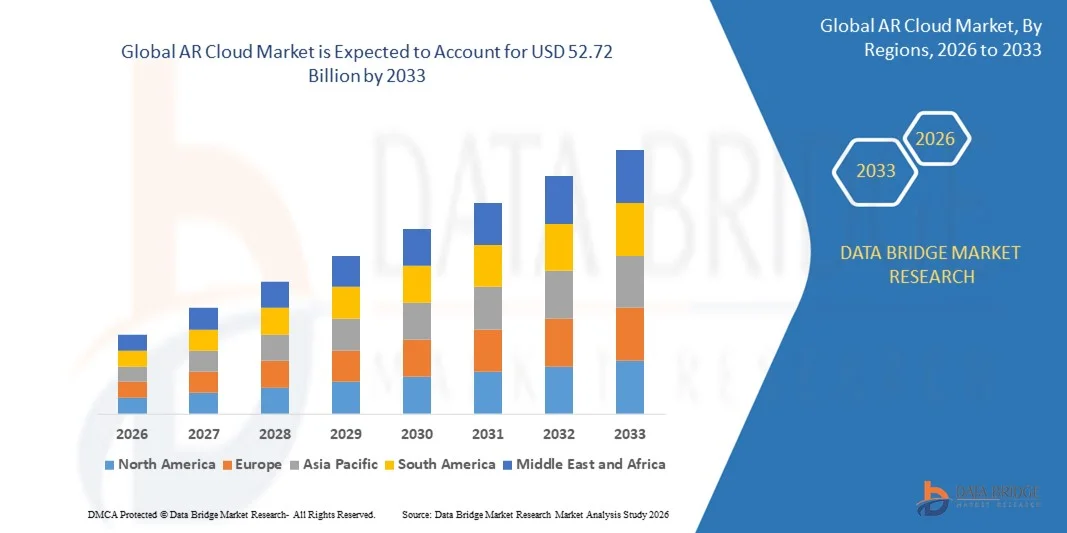
52.72 Billion
2025
2033
USD
7.07 Billion
USD
52.72 Billion
2025
2033
| 2026 –2033 | |
| USD 7.07 Billion | |
| USD 52.72 Billion | |
| % | |
|
Global AR Cloud Market Segmentation, By Component (Hardware, Software, and Services), Organization Size (Grandes entreprises et petites et moyennes entreprises), Type (Marker-Based AR et Marker-Less AR), Déploiement (Public Cloud, Private Cloud, et Hybrid Cloud), et Utilisation Finale (Automobile, Aérospatiale et Défense, Santé, Fabrication, Détail, Médias et Divertissement, Immobilier et Construction, Informatique et Télécommunications, etc.) - Tendances et prévisions de l'industrie jusqu'en 2033
Quelle est la taille et le taux de croissance du marché mondial AR Cloud ?
- La taille du marché mondial des nuages AR a été évaluée à7,07 milliards de dollars en 2025et devrait atteindre52,72 milliards de dollars avant 2033, à unTCAC de28,55 %pendant la période de prévision
- La croissance rapide est stimulée par l'adoption croissante de la réalité augmentée dans les villes intelligentes, les jeux, le commerce de détail, les soins de santé et la navigation, la demande croissante de cartographie spatiale en temps réel et de visualisation 3D, l'utilisation croissante de l'intelligence artificielle, de la vision informatique et de l'informatique de pointe, la prolifération de la connectivité 5G et les investissements croissants dans les expériences numériques immersives, qui accélèrent considérablement l'expansion du marché AR Cloud
Quelles sont les principales tendances du marché du cloud AR ?
- Le déploiement croissant de smartphones, de portables, de tablettes et d'écrans montés sur la tête, ainsi que l'intensification des activités de R-D dans l'informatique spatiale et les plateformes métaverses, créent des possibilités de croissance substantielles pour le marché du cloud AR dans les économies développées et émergentes.
- Toutefois, des défis tels que les coûts élevés de l'infrastructure, la protection des données et les préoccupations en matière de sécurité, l'absence de cadres normalisés pour le cloud AR et la complexité de la gestion des données spatiales à grande échelle peuvent jouer un rôle clé dans la réduction du rythme de croissance du marché.
- L'Amérique du Nord a dominé le marché du nuage AR avec une part de revenus de 32,05 % en 2025, tirée par la forte croissance de l'informatique spatiale, de l'infrastructure du nuage, de l'intégration de l'IA et de l'adoption de technologies immersives aux États-Unis et au Canada.
- L'Asie-Pacifique devrait enregistrer le TCAC le plus rapide de 28,36 % entre 2026 et 2033, grâce à la transformation numérique rapide, à l'expansion de l'infrastructure nuageuse, au déploiement de la 5G et à l'adoption croissante d'AR en Chine, au Japon, en Inde, en Corée du Sud et en Asie du Sud-Est.
- Le segment des logiciels a dominé le marché avec une part estimée à 46,3 % en 2025, en raison de l'adoption croissante de plates-formes de cartographie spatiale, de moteurs AR basés sur le cloud, de logiciels de visualisation et d'outils de reconnaissance des scènes alimentés par l'IA
Portée du rapport et segmentation du marché du cloud AR
| Attributs | AR Cloud Principales perspectives du marché |
| Segments couverts |
|
| Pays couverts | Amérique du Nord
Europe
Asie-Pacifique
Moyen-Orient et Afrique
Amérique du Sud
|
| Principaux acteurs du marché |
|
| Possibilités de marché |
|
| Infos sur la valeur ajoutée | En plus des renseignements sur les scénarios du marché tels que la valeur du marché, le taux de croissance, la segmentation, la couverture géographique et les principaux intervenants, les rapports de marché établis par Data Bridge Market Research comprennent également une analyse approfondie des experts, une analyse des prix, une analyse des parts de marque, une enquête auprès des consommateurs, une analyse démographique, une analyse de la chaîne d'approvisionnement, une analyse de la chaîne de valeur, une vue d'ensemble des matières premières et des consommables, des critères de sélection des fournisseurs, une analyse PESTLE, une analyse Porter et un cadre réglementaire. |
Quelle est la tendance clé du marché du cloud AR?
Changement rapide vers une infrastructure AR évolutive, en temps réel et infonuagique
- Le marché du cloud AR est témoin de l'adoption croissante de plates-formes de calcul spatial en temps réel, natif du cloud, qui permettent un contenu AR persistant, une cartographie à grande échelle et des expériences multi-utilisateurs à travers les appareils
- Les acteurs du marché se concentrent sur le traitement de données spatiales à haute performance, l'intégration bord-cloud et la compréhension de la scène induite par l'IA pour soutenir les applications d'AR immersives
- La demande croissante d'expériences AR légères, agnostiques et à faible latence accélère l'utilisation du rendu en nuage et des ancres spatiales
- Par exemple, des entreprises telles que Microsoft, Google, Niantic, Apple et Meta améliorent les capacités de AR Cloud grâce à la cartographie spatiale, VPS, jumelles numériques et la localisation assistée par l'IA
- Le besoin croissant de collaboration en temps réel, la persistance à grande échelle des EI et l'interopérabilité entre les plates-formes stimulent l'adoption de cas d'utilisation par les entreprises et les consommateurs
- À mesure que les expériences d'AR deviendront plus immersives et évolutives, AR Clouds restera au centre de l'informatique spatiale, du développement métaversal et de l'interaction numérique de prochaine génération
Quels sont les principaux moteurs de AR Cloud Market ?
- Une demande croissante d'expériences d'AR persistantes, partagées et basées sur la localisation dans les domaines du jeu, de la vente au détail, de la navigation et de la collaboration entre entreprises
- Par exemple, en 2024-2025, les principaux acteurs tels que Niantic, Microsoft et Apple ont élargi les écosystèmes de cloud AR par le biais de VPS, d'ancrages spatiaux et de mises à niveau ARKit/ARCore
- L'adoption rapide de la 5G, de l'informatique de bord et de la vision assistée par l'IA améliore considérablement les performances et l'évolutivité de AR Cloud
- L'utilisation accrue des jumelles numériques, des villes intelligentes et des applications industrielles d'AR stimule la demande dans les secteurs de l'automobile, de la fabrication et de l'immobilier
- La pénétration croissante des smartphones AR, des lunettes intelligentes et des écrans montés sur la tête élargit la base d'utilisateurs AR Cloud
- Soutenu par des investissements soutenus dans l'infrastructure cloud, l'IA spatiale et les technologies immersives, le marché AR Cloud devrait connaître une forte croissance à long terme
Quel est le facteur de contestation de la croissance du marché du cloud AR?
- Les coûts élevés associés à la cartographie spatiale à grande échelle, au traitement en nuage et à la synchronisation des données en temps réel limitent l'adoption chez les petits développeurs
- Par exemple, pendant les années 2024-2025, l'augmentation des coûts de l'informatique en nuage et les défis liés à l'échelle des infrastructures ont affecté l'économie de déploiement des plateformes AR
- La complexité dans la gestion de la confidentialité des données, la précision de l'emplacement et la synchronisation en temps réel entre les appareils pose des défis techniques
- Une normalisation et une interopérabilité limitées entre les plateformes, les dispositifs et les environnements nuageux ralentissent le développement des écosystèmes
- La concurrence des solutions AR centrées sur les appareils, des cadres AR hors ligne et des écosystèmes propriétaires crée une fragmentation
- Pour relever ces défis, les entreprises investissent dans des architectures cloud rentables, des standards ouverts, l'optimisation de l'IA et des plateformes AR Cloud adaptées aux développeurs
Comment le marché du cloud AR est-il segmenté?
Le marché est segmenté sur la base decomposante, taille de l'organisation, type, déploiement et utilisation finale.
- Par composante
Sur la base d'un composant, le marché AR Cloud est segmenté en matériels, logiciels et services. Le segment des logiciels a dominé le marché avec une part estimée à 46,3 % en 2025, grâce à l'adoption croissante de plates-formes de cartographie spatiale, de moteurs AR basés sur le cloud, de logiciels de visualisation et d'outils de reconnaissance des scènes alimentés par l'IA. Les solutions logicielles forment le noyau des écosystèmes AR Cloud en permettant la localisation en temps réel, la persistance du contenu et la synchronisation multi-utilisateurs entre les appareils. Les progrès continus de l'informatique spatiale, des jumelles numériques et de l'analyse de l'IA soutiennent davantage la domination du segment.
On s'attend à ce que le segment des services augmente au rythme le plus rapide du TCAC de 2026 à 2033, grâce à la demande croissante de services d'intégration, de déploiement, de maintenance et de personnalisation AR Cloud. Les entreprises des secteurs du commerce de détail, de la fabrication, des soins de santé et des villes intelligentes comptent de plus en plus sur des services gérés et des conseils pour déployer efficacement des infrastructures évoluables AR Cloud.
- Selon la taille de l'organisation
Sur la base de la taille de l'organisation, le marché AR Cloud est segmenté en grandes entreprises et petites et moyennes entreprises (PME). Les grandes entreprises ont dominé le marché avec une part de 61,8 % des revenus en 2025, en raison de leur forte capacité financière, de l'adoption rapide de technologies immersives et du déploiement à grande échelle de plateformes AR Cloud pour la formation, les jumeaux numériques, la collaboration à distance et l'engagement des clients. Les grandes entreprises utilisent AR Clouds pour améliorer l'efficacité opérationnelle, la visibilité de la chaîne d'approvisionnement et la productivité de la main-d'oeuvre.
On prévoit que le segment des PME sera témoin du TCAC le plus rapide de 2026 à 2033, en raison de la baisse des coûts de l'infrastructure en nuage, de la disponibilité croissante de plateformes AR basées sur SaaS et de l'adoption accrue de l'AR pour la commercialisation, la visualisation et les démonstrations de produits. Les initiatives de transformation numérique soutenues par l'État et l'accessibilité au cloud accélèrent encore la pénétration du cloud AR parmi les PME.
- Par type
Sur la base du type, le marché AR Cloud est segmenté en AR à base de marqueurs et en AR à base de marqueurs. Le segment AR de Marker-Less a dominé le marché avec une part de 58,4% en 2025, car il permet des expériences plus transparentes, évolutives et immersives sans se fier à des marqueurs physiques. Sans marque AR exploite les technologies SLAM, GPS, AI et de vision informatique, ce qui le rend idéal pour la navigation, les villes intelligentes, le commerce de détail et les applications industrielles AR.
On s'attend à ce que le segment des AR basés sur les marqueurs augmente régulièrement, particulièrement dans des environnements contrôlés comme la fabrication de planchers, l'éducation et la formation à l'entretien, où la précision et la répétabilité sont essentielles. Cependant, l'élan de croissance le plus rapide demeure avec des EI sans marque en raison de l'augmentation de la demande de services basés sur l'emplacement, du contenu persistant des EI et des déploiements extérieurs à grande échelle.
- Par déploiement
Sur la base du déploiement, le marché AR Cloud est segmenté en Public Cloud, Private Cloud et Hybrid Cloud. Le segment du Cloud Public a dominé le marché avec une part de 49,6 % en 2025, en raison de son évolutivité, de son rapport coût-efficacité, de son déploiement rapide et de sa compatibilité avec les applications AR nécessitant un traitement en temps réel des données et une accessibilité mondiale. Les plates-formes de cloud public sont largement adoptées pour les expériences d'AR orientées vers les consommateurs, les jeux, la visualisation de détail et les services de navigation.
Le segment du cloud hybride devrait enregistrer le TCAC le plus rapide de 2026 à 2033, car les entreprises cherchent un équilibre entre la sécurité des données et l'évolutivité. Le déploiement hybride permet aux organisations de stocker des données spatiales sensibles sur l'infrastructure privée tout en tirant parti des ressources du cloud public pour le traitement et la visualisation, ce qui le rend idéal pour les soins de santé, la défense et les cas d'utilisation industrielle.
- Par utilisation finale
Sur la base de l'utilisation finale, le marché AR Cloud est segmenté en Automotive, Aerospace & Defense, Healthcare, Manufacturing, Retail, Media & Entertainment, Real Estate & Construction, IT & Telecommunications, et autres. Le segment du commerce de détail a dominé le marché avec une part de 34,7% en 2025, animée par l'adoption généralisée de solutions AR Cloud pour les essais virtuels, la navigation en magasin, la publicité immersive et l'expérience client personnalisée.
On prévoit que le segment de la fabrication augmentera au TCAC le plus rapidement, passant de 2026 à 2033, grâce à l'adoption croissante de jumeaux numériques alimentés par des AR, à l'aide à distance, à la maintenance prédictive et à la formation de la main-d'oeuvre. Augmenter les initiatives de l'Industrie 4.0 et les déploiements d'usines intelligentes accélèrent l'intégration AR Cloud dans les environnements de fabrication mondiaux.
Quelle région détient la plus grande part du marché du cloud AR?
- L'Amérique du Nord a dominé le marché du nuage AR avec une part de revenus de 32,05 % en 2025, tirée par la forte croissance de l'informatique spatiale, de l'infrastructure du nuage, de l'intégration de l'IA et de l'adoption de technologies immersives aux États-Unis et au Canada. Une forte pénétration des plateformes AR avancées, de solides écosystèmes de services nuageux et l'adoption rapide de solutions AR basées sur l'emplacement et persistantes continuent d'alimenter la demande d'AR Clouds dans les domaines de la visualisation automobile, de la fabrication intelligente, de la formation en soins de santé, de la production de médias et de la collaboration entre entreprises.
- Les principales entreprises d'Amérique du Nord améliorent continuellement les plateformes AR Cloud grâce à une cartographie spatiale avancée, à la localisation assistée par l'IA, au rendu en temps réel et à des modèles de déploiement cloud-natif, renforçant ainsi le leadership technologique de la région. Des investissements soutenus dans l'IA, l'informatique de pointe, la 5G et l'infrastructure cloud soutiennent l'expansion à long terme du marché AR Cloud
- Une forte concentration de talents qualifiés, des écosystèmes de démarrage robustes et un financement solide du capital-risque renforcent encore le leadership nord-américain sur le marché mondial du nuage AR
Aperçu du marché américain du cloud AR
Les États-Unis sont le principal contributeur en Amérique du Nord, appuyé par l'adoption de solutions AR Cloud dans les secteurs du commerce de détail, de la fabrication, de la défense, des soins de santé et des médias. Le développement rapide d'expériences d'AR pilotées par l'IA, de jumeaux numériques et de plateformes métaverses accélère la demande. La présence de grandes entreprises technologiques, de fournisseurs de cloud et d'innovateurs d'AR stimule la croissance du marché.
Aperçu du marché canadien des nuages AR
Le Canada contribue de façon importante à la croissance régionale, en raison de l'expansion des grappes de recherche sur les AR, de l'adoption croissante de technologies immersives et de programmes d'innovation numérique appuyés par le gouvernement. Les universités, les start-up et les entreprises exploitent de plus en plus AR Clouds pour des projets de ville intelligente, des formations industrielles et des applications de visualisation.
Marché des nuages AR Asie-Pacifique
L'Asie-Pacifique devrait enregistrer le TCAC le plus rapide de 28,36 %, de 2026 à 2033, grâce à la transformation numérique rapide, à l'expansion de l'infrastructure nuageuse, au déploiement de la 5G et à l'adoption croissante d'AR en Chine, au Japon, en Inde, en Corée du Sud et en Asie du Sud-Est. La hausse de la demande de services de distribution immersive, de fabrication intelligente et d'AR basés sur la localisation accélère la croissance régionale.
China AR Cloud Aperçu du marché
La Chine est à la tête de l'Asie-Pacifique en raison d'un solide soutien gouvernemental, d'initiatives à grande échelle de villes intelligentes et d'investissements massifs dans l'AR, l'IA et l'informatique en nuage. Une forte adoption dans l'ensemble de la fabrication, du commerce de détail et du divertissement favorise une expansion soutenue du marché.
Aperçu du marché japonais du cloud AR
Le Japon affiche une croissance soutenue grâce à la robotique avancée, à l'innovation automobile et à la fabrication de précision. L'accent mis sur la fiabilité et les solutions immersives performantes soutient l'adoption d'AR Cloud.
Quelles sont les meilleures entreprises du marché du cloud AR?
L'industrie du cloud AR est principalement dirigée par des entreprises bien établies, notamment :
- Microsoft Corporation (États-Unis)
- Apple Inc. (États-Unis)
- Google LLC (États-Unis)
- Magic Leap, Inc. (États-Unis)
- Niantic, Inc. (États-Unis)
- Snap Inc. (États-Unis)
- Vuzix Corporation (États-Unis)
- Qualcomm Technologies, Inc. (États-Unis)
- PTC Inc. (États-Unis)
- Epson America, Inc. (États-Unis)
- Ultraleap (Royaume-Uni)
- Nréal (Chine)
- Vuforia (PTC) (États-Unis)
- Société Sony (Japon)
- Intel Corporation (États-Unis)
- Samsung Electronics (Corée du Sud)
- Meta Platforms, Inc. (États-Unis)
- Huawei Technologies Co., Ltd. (Chine)
- Bosch Sensortec GmbH (Allemagne)
Quels sont les développements récents sur le marché mondial du cloud AR ?
- En octobre 2025, Amazon Web Services, Inc. (AWS) (États-Unis) a conclu une collaboration stratégique avec Esri pour intégrer la plateforme d'IA géospatiale d'Esri, ArcGIS, avec l'infrastructure cloud d'AWS, permettant des applications géospatiales à l'échelle de l'entreprise, AR, VR et AR Cloud dans de multiples industries, renforçant l'influence des AWS sur le marché du cloud d'AR et soutenant des expériences immersives évolutives et intelligentes de localisation
- En juillet 2025, Niantic, Inc. (États-Unis) a annoncé un partenariat technologique avec KOJIMA PRODUCTIONS afin de fournir des expériences d'AR géospatiale immersive à l'IA dans des environnements réels, mettant en lumière l'accent mis par Niantic sur la construction d'une couche d'AR Cloud persistante, et démontrant l'engagement de la société à combler les expériences numériques et physiques
- En mai 2025, Google LLC (États-Unis) a introduit des mises à jour de sa plate-forme de développement ARCore, y compris des Ancres Cloud améliorés pour des expériences AR partagées, la détection verticale de plans, et une meilleure reconnaissance d'image augmentée, renforçant les capacités de Google AR Cloud et permettant un contenu spatial partagé et persistant sur tous les appareils
- En février 2025, Microsoft Corporation (États-Unis) a publié des guides et des exemples d'outils combinant des outils de verrouillage mondiaux et des ancrages spatiaux d'azur, démontrant comment créer des espaces de coordination stables et partageables entre les appareils et les sessions, et fournissant des éléments de base essentiels pour la fonctionnalité persistante d'AR Cloud
- En novembre 2024, Niantic, Inc. (États-Unis) a lancé la plate-forme spatiale Niantic, élargissant la carte de Lightship et le système de positionnement visuel (SPV) à un million de sites de production, permettant un contenu AR persistant et partagé à l'échelle et renforçant sa position de leader dans les solutions de développement AR Cloud
SKU-
Accédez en ligne au rapport sur le premier cloud mondial de veille économique

- Tableau de bord d'analyse de données interactif
- Tableau de bord d'analyse d'entreprise pour les opportunités à fort potentiel de croissance
- Accès d'analyste de recherche pour la personnalisation et les requêtes
- Analyse de la concurrence avec tableau de bord interactif
- Dernières actualités, mises à jour et analyse des tendances
- Exploitez la puissance de l'analyse comparative pour un suivi complet de la concurrence
Méthodologie de recherche
La collecte de données et l'analyse de l'année de base sont effectuées à l'aide de modules de collecte de données avec des échantillons de grande taille. L'étape consiste à obtenir des informations sur le marché ou des données connexes via diverses sources et stratégies. Elle comprend l'examen et la planification à l'avance de toutes les données acquises dans le passé. Elle englobe également l'examen des incohérences d'informations observées dans différentes sources d'informations. Les données de marché sont analysées et estimées à l'aide de modèles statistiques et cohérents de marché. De plus, l'analyse des parts de marché et l'analyse des tendances clés sont les principaux facteurs de succès du rapport de marché. Pour en savoir plus, veuillez demander un appel d'analyste ou déposer votre demande.
La méthodologie de recherche clé utilisée par l'équipe de recherche DBMR est la triangulation des données qui implique l'exploration de données, l'analyse de l'impact des variables de données sur le marché et la validation primaire (expert du secteur). Les modèles de données incluent la grille de positionnement des fournisseurs, l'analyse de la chronologie du marché, l'aperçu et le guide du marché, la grille de positionnement des entreprises, l'analyse des brevets, l'analyse des prix, l'analyse des parts de marché des entreprises, les normes de mesure, l'analyse globale par rapport à l'analyse régionale et des parts des fournisseurs. Pour en savoir plus sur la méthodologie de recherche, envoyez une demande pour parler à nos experts du secteur.
Personnalisation disponible
Data Bridge Market Research est un leader de la recherche formative avancée. Nous sommes fiers de fournir à nos clients existants et nouveaux des données et des analyses qui correspondent à leurs objectifs. Le rapport peut être personnalisé pour inclure une analyse des tendances des prix des marques cibles, une compréhension du marché pour d'autres pays (demandez la liste des pays), des données sur les résultats des essais cliniques, une revue de la littérature, une analyse du marché des produits remis à neuf et de la base de produits. L'analyse du marché des concurrents cibles peut être analysée à partir d'une analyse basée sur la technologie jusqu'à des stratégies de portefeuille de marché. Nous pouvons ajouter autant de concurrents que vous le souhaitez, dans le format et le style de données que vous recherchez. Notre équipe d'analystes peut également vous fournir des données sous forme de fichiers Excel bruts, de tableaux croisés dynamiques (Fact book) ou peut vous aider à créer des présentations à partir des ensembles de données disponibles dans le rapport.

