Global Oil And Gas Infrastructure Market
Taille du marché en milliards USD
TCAC :
% 
 USD
561.30 Million
USD
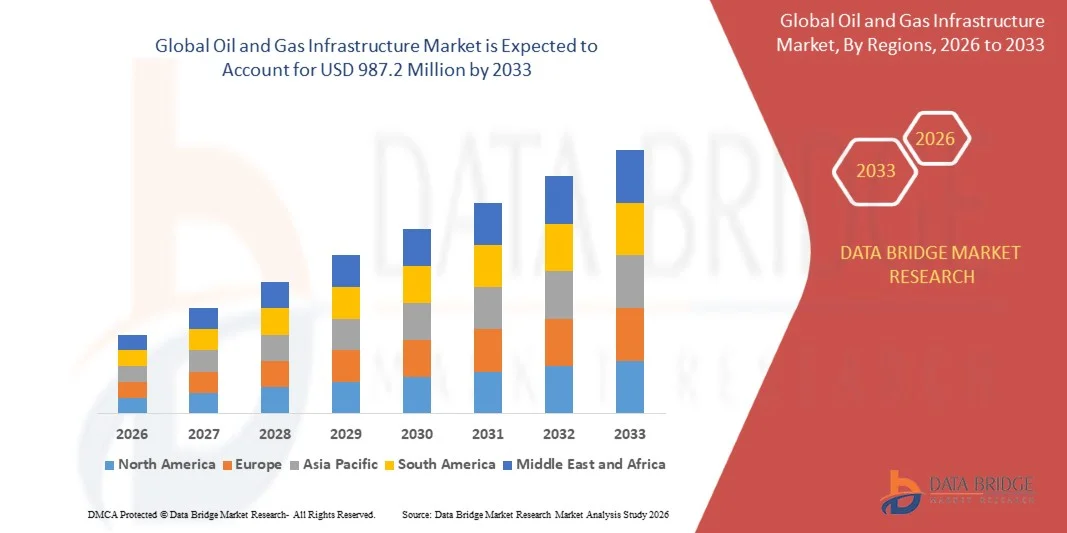
987.20 Million
2025
2033
USD
561.30 Million
USD
987.20 Million
2025
2033
| 2026 –2033 | |
| USD 561.30 Million | |
| USD 987.20 Million | |
| % | |
|
Segmentation du marché mondial de l'infrastructure pétrolière et gazière, par catégorie (équipement de surface et de location, collecte et transformation, gazoducs et gazoducs, stockage du pétrole et du gaz, affinage et produits pétroliers, et terminaux d'exportation), exploitation (transmission et distribution) - tendances et prévisions de l'industrie jusqu'en 2033
Qu'est-ce que l'infrastructure pétrolière et gazière mondialeTaille du marché et taux de croissance?
- La taille du marché mondial des infrastructures pétrolières et gazières a été évaluée à561,3 millions de dollars en 2025et devrait atteindre987,2 millions de dollars en 2033, à unTCAC de 5,20%pendant la période de prévision
- La croissance du marché est soutenue par la demande croissante de systèmes électroniques à haut rendement et à haut rendement, l'application croissante des analyseurs logiques dans les circuits intégrés, les ordinateurs personnels et les dispositifs de mémoire, et le besoin croissant de détection d'erreurs, de débogage logique complexe et de tests de circuits numériques
- En outre, l'adoption rapide d'appareils compatibles avec l'IoT, les progrès technologiques dans les analyseurs de logique numérique et les capacités accrues de déclenchement et d'analyse devraient accélérer davantage l'expansion du marché.
Quels sont les principaux débouchés du marché des infrastructures pétrolières et gazières?
- L'expansion de la demande de tablettes, de PC et de systèmes électroniques de pointe dans les économies en développement, conjuguée à un nombre croissant d'initiatives de recherche-développement, crée d'importantes possibilités de croissance et renforce les perspectives à long terme du marché des infrastructures pétrolières et gazières
- Toutefois, les problèmes tels que la pénurie de professionnels qualifiés, la complexité croissante de la conception et de l'intégration et les problèmes d'interaction entre les systèmes devraient constituer des contraintes clés, ce qui pourrait limiter la croissance du marché au cours de la période de prévision.
- L'Amérique du Nord a dominé le marché des infrastructures pétrolières et gazières avec une part des revenus estimée à 34,26 % en 2025, grâce à des investissements à grande échelle dans les réseaux de pipelines, les terminaux de GNL, les installations de stockage du pétrole et les infrastructures de raffinage aux États-Unis et au Canada.
- L'Asie-Pacifique devrait enregistrer le TCAC le plus rapide de 5,9 % entre 2026 et 2033, en raison de l'augmentation de la demande d'énergie, de l'industrialisation rapide, de l'urbanisation et de l'augmentation de la consommation de pétrole et de gaz en Chine, en Inde, au Japon, en Corée du Sud et en Asie du Sud-Est.
- Le segment des gazoducs de gaz et de GNL a dominé le marché avec une part estimée de 38,6 % en 2025, en raison d'investissements considérables dans les gazoducs de transport transfrontalier, de l'augmentation de la demande de gaz naturel et de l'expansion des réseaux de transport de GNL et de GNL.
Portée etSegmentation du marché des infrastructures pétrolières et gazières
| Attributs | Infrastructure pétrolière et gazièrePerspectives du marché |
| Segments couverts |
|
| Pays couverts | Amérique du Nord
Europe
Asie-Pacifique
Moyen-Orient et Afrique
Amérique du Sud
|
| Principaux acteurs du marché |
|
| Possibilités de marché |
|
| Infos sur la valeur ajoutée | En plus des renseignements sur les scénarios du marché tels que la valeur du marché, le taux de croissance, la segmentation, la couverture géographique et les principaux intervenants, les rapports de marché établis par Data Bridge Market Research comprennent également une analyse approfondie des experts, une analyse des prix, une analyse des parts de marque, une enquête auprès des consommateurs, une analyse démographique, une analyse de la chaîne d'approvisionnement, une analyse de la chaîne de valeur, une vue d'ensemble des matières premières et des consommables, des critères de sélection des fournisseurs, une analyse PESTLE, une analyse Porter et un cadre réglementaire. |
Quelle est la tendance clé du marché de l'infrastructure pétrolière et gazière?
(en milliers de dollars)Accroître le changement vers des systèmes numériques, intelligents et intégrés d'infrastructure pétrolière et gazière(en milliers de dollars)
- Le marché de l'infrastructure pétrolière et gazière est témoin de l'adoption croissante de systèmes de surveillance numérique, de capteurs intelligents et de systèmes de contrôle intégrés pour améliorer l'efficacité opérationnelle, la sécurité et la fiabilité des actifs dans les installations en amont, en aval et en milieu de cours d'eau
- Les développeurs d'infrastructure déploient des plateformes d'automatisation, des systèmes SCADA, des jumelles numériques et des analyses adaptées à l'IA pour optimiser les opérations de pipeline, la gestion du stockage et les processus de raffinage
- La demande croissante d'infrastructures rentables, surveillées à distance et prédictives pour l'entretien entraîne l'adoption de pipelines, de terminaux, de raffineries et d'installations offshore.
- Par exemple, des entreprises telles que Shell, BP, Exxon Mobil et Baker Hughes intègrent les technologies des champs pétrolifères numériques, la surveillance des actifs en temps réel et les plateformes de décision axées sur les données dans les projets d'infrastructure mondiaux.
- L'accent accru mis sur la transparence opérationnelle, la surveillance des émissions et la conformité à la réglementation accélère le passage à une infrastructure pétrolière et gazière intelligente et connectée
- À mesure que les systèmes énergétiques deviendront plus complexes et axés sur la durabilité, l'infrastructure pétrolière et gazière numérique demeurera essentielle au transport et au traitement de l'énergie résilients, sûrs et efficaces.
Quels sont les principaux moteurs du marché de l'infrastructure pétrolière et gazière?
- Augmentation de la demande mondiale de transport d'énergie, de capacité de stockage et d'infrastructure de raffinage pour soutenir la consommation croissante de pétrole et de gaz
- Entre 2024 et 2025, par exemple, les principaux opérateurs tels que TotalEnergies, Chevron et SLB ont accru leurs investissements dans la modernisation des pipelines, les terminaux GNL et la modernisation des infrastructures numériques.
- Le développement croissant des installations de GNL, des pipelines transfrontaliers et des terminaux d'exportation en Amérique du Nord, en Asie-Pacifique et au Moyen-Orient stimule les dépenses d'infrastructure
- Les progrès de l'automatisation, de l'ingénierie des matériaux, de la surveillance de la corrosion et de la gestion numérique des actifs renforcent la performance de l'infrastructure et l'efficacité du cycle de vie
- L'augmentation des investissements dans l'infrastructure du gaz naturel en tant que combustible de transition, ainsi que les actifs compatibles avec l'hydrogène et les faibles émissions de carbone soutiennent la croissance à long terme
- Soutenu par des dépenses en capital soutenues, des initiatives de sécurité énergétique et des programmes de modernisation de l'infrastructure, le marché de l'infrastructure pétrolière et gazière devrait connaître une expansion soutenue à long terme.
Quel facteur met en cause la croissance du marché des infrastructures pétrolières et gazières?
- Les coûts en capital élevés associés à la construction de pipelines, à l'infrastructure en mer, aux installations de stockage et à la modernisation des raffineries limitent le déploiement rapide
- Entre 2024 et 2025, par exemple, la volatilité des prix des matières premières, les perturbations de la chaîne d'approvisionnement et les pénuries de main-d'oeuvre qualifiée ont augmenté les coûts du projet et prolongé les délais.
- Des cadres réglementaires complexes, des approbations environnementales et des défis liés à l'acquisition de terres retardent le développement des infrastructures
- La pression croissante exercée par les politiques de transition énergétique, les objectifs de décarbonisation et l'opposition du public crée une incertitude pour les investissements à long terme dans l'infrastructure des combustibles fossiles
- La concurrence des infrastructures d'énergies renouvelables et des carburants de substitution influe sur la répartition des capitaux et la hiérarchisation des projets
- Pour atténuer ces défis, les entreprises mettent l'accent sur l'optimisation numérique, la construction modulaire, les technologies de réduction des émissions et la réfection des infrastructures pour soutenir la croissance du marché des infrastructures pétrolières et gazières.
Comment le marché de l'infrastructure pétrolière et gazière est-il segmenté?
Le marché est segmenté sur la base deCatégorie et fonctionnement.
• Par catégorie
En fonction de la catégorie, le marché de l'infrastructure pétrolière et gazière est segmenté en équipement de surface et de location, collecte et traitement, gazoducs et gazoducs, stockage du pétrole et du gaz, affinage et transport de produits pétroliers et terminaux d'exportation. Le segment des gazoducs de gaz et de GNL a dominé le marché avec une part estimée de 38,6 % en 2025, en raison d'investissements considérables dans les gazoducs de transport transfrontalier, de l'augmentation de la demande de gaz naturel et de l'expansion des réseaux de transport de GNL et de GNL. Les pipelines demeurent l'épine dorsale de l'infrastructure pétrolière et gazière, offrant des services de transport continu, de grande capacité et rentables en amont, en milieu de cours d'eau et en aval. L'accent mis de plus en plus sur la sécurité énergétique, la connectivité interrégionale et le remplacement des réseaux de pipelines vieillissants appuie davantage la domination.
On s'attend à ce que le segment des terminaux d'exportation augmente au rythme le plus rapide du TCAC de 2026 à 2033, en raison de la croissance rapide des exportations de GNL, de l'augmentation du commerce du pétrole brut et de l'expansion des infrastructures portuaires en Amérique du Nord, au Moyen-Orient et en Asie-Pacifique. La croissance du commerce mondial de l'énergie et les investissements dans les installations de stockage et de chargement accélèrent la croissance du segment.
• Par opération
Sur la base de l'exploitation, le marché des infrastructures pétrolières et gazières est segmenté en transport et distribution. Le segment du transport a dominé le marché avec une part des revenus d'environ 61,4 % en 2025, soutenue par des investissements à grande échelle dans les pipelines longue distance, les réseaux de transport à grande capacité et les corridors énergétiques transfrontaliers. L'infrastructure de transport joue un rôle essentiel dans le transport du pétrole brut, du gaz naturel et des produits raffinés des sites de production et de transformation aux centres de consommation et d'exportation. Le développement accru des gazoducs de transport de gaz naturel, des lignes d'alimentation en GNL et des réseaux interétatiques renforce ce segment.
Le segment de la distribution devrait croître au rythme le plus rapide du TCAC de 2026 à 2033, en raison de l'urbanisation croissante, de l'expansion des réseaux urbains de distribution de gaz et de l'augmentation de la demande de connectivité au dernier kilomètre dans les secteurs industriel, commercial et résidentiel. Les initiatives gouvernementales visant à élargir l'accès au gaz et à moderniser l'infrastructure de distribution favorisent une croissance rapide.
Quelle région détient la plus grande part du marché de l'infrastructure pétrolière et gazière?
- L'Amérique du Nord a dominé le marché de l'infrastructure pétrolière et gazière avec une part de revenus estimée à 34,26 % en 2025, grâce à des investissements à grande échelle dans les réseaux de pipelines, les terminaux de GNL, les installations de stockage du pétrole et les infrastructures de raffinage aux États-Unis et au Canada. La forte production de pétrole et de gaz de schiste, l'expansion des actifs en milieu de cours d'eau et la modernisation des infrastructures vieillissantes continuent d'alimenter la croissance du marché régional
- Les principales entreprises pétrolières et gazières d'Amérique du Nord investissent massivement dans l'expansion des pipelines, les terminaux d'exportation de GNL, les systèmes de surveillance numérique et les améliorations de la sécurité, renforçant ainsi le leadership des infrastructures de la région. L'allocation continue de capitaux à la sécurité énergétique et à la capacité d'exportation soutient l'expansion à long terme du marché
- Des cadres réglementaires bien établis, des capacités d'ingénierie avancées et une forte présence d'opérateurs mondiaux de pétrole et de gaz renforcent encore la domination de l'Amérique du Nord sur le marché des infrastructures pétrolières et gazières
Aperçu du marché américain des infrastructures pétrolières et gazières
Les États-Unis sont le plus gros contributeur en Amérique du Nord, appuyés par une importante production de schiste, un réseau de pipelines dense, une grande capacité de raffinage et l'expansion rapide des terminaux d'exportation de GNL. L'augmentation des investissements dans les pipelines de pétrole brut, le transport de gaz naturel, les installations de stockage et les infrastructures portuaires est à l'origine d'une forte demande. La présence de grandes compagnies pétrolières et gazières, la forte disponibilité de capitaux et la modernisation continue de l'infrastructure favorisent la croissance du marché.
Aperçu du marché de l'infrastructure pétrolière et gazière du Canada
Le Canada contribue de façon importante au développement continu de l'infrastructure des sables bitumineux, des pipelines transfrontaliers, des installations de traitement du gaz et des projets d'exportation de GNL. Le soutien gouvernemental aux exportations d'énergie, à la modernisation des infrastructures et à la diversification des itinéraires d'exportation renforce la croissance à long terme du marché.
Marché de l'infrastructure pétrolière et gazière en Asie-Pacifique
L'Asie-Pacifique devrait enregistrer le TCAC le plus rapide de 5,9 % entre 2026 et 2033, en raison de l'augmentation de la demande d'énergie, de l'industrialisation rapide, de l'urbanisation et de l'augmentation de la consommation de pétrole et de gaz en Chine, en Inde, au Japon, en Corée du Sud et en Asie du Sud-Est. Les investissements à grande échelle dans les raffineries, les pipelines, les terminaux d'importation de GNL et les installations de stockage accélèrent le développement des infrastructures.
Aperçu du marché des infrastructures pétrolières et gazières en Chine
La Chine est le principal contributeur de l'Asie-Pacifique, soutenue par des investissements massifs dans les pipelines, les terminaux de GNL, les réserves de pétrole stratégiques et la capacité de raffinage. Les initiatives gouvernementales en matière de sécurité énergétique et l'augmentation de la consommation de gaz continuent de stimuler l'expansion des infrastructures.
Aperçu du marché japonais des infrastructures pétrolières et gazières
Le Japon affiche une croissance régulière en raison de la forte demande de terminaux d'importation de GNL, d'installations de stockage et de modernisations de raffinage. L'accent mis sur la sécurité énergétique et la diversification des sources d'approvisionnement favorise des investissements soutenus dans les infrastructures.
Aperçu du marché indien des infrastructures pétrolières et gazières
L'Inde est en voie de devenir un marché à forte croissance, alimenté par l'expansion rapide des gazoducs, des réseaux urbains de distribution de gaz, des raffineries et des terminaux de GNL. Les initiatives gouvernementales et l'augmentation de la demande énergétique accélèrent le développement des infrastructures.
Corée du Sud Aperçu du marché des infrastructures pétrolières et gazières
La Corée du Sud apporte une contribution importante par des investissements dans les terminaux GNL, la capacité de raffinage et l'infrastructure de stockage. La forte demande industrielle et la dépendance à l'égard des importations d'énergie soutiennent la croissance continue du marché.
Quelles sont les principales entreprises du marché de l'infrastructure pétrolière et gazière?
L'industrie de l'infrastructure pétrolière et gazière est principalement dirigée par des entreprises bien établies, notamment :
- Exxon Mobil Corporation (États-Unis)
- Shell (Royaume-Uni)
- BP (Royaume-Uni)
- Chevron Corporation (États-Unis)
- TotalEnergies (France)
- Société Baker Hughes (États-Unis)
- Centrica (Royaume-Uni)
- ConocoPhillips (États-Unis)
- Transfert d'énergie (États-Unis)
- Partenaires des produits d'entreprise (États-Unis)
- Hatch (Canada)
- Halliburton (États-Unis)
- Kinder Morgan (États-Unis)
- Marathon Oil Company (États-Unis)
- LNG Partenaires énergétiques (États-Unis)
- Société pétrolière occidentale (États-Unis)
- Oui.
- Royal Vopak (Pays-Bas)
- SLB (États-Unis)
- WILLIAMS (États-Unis)
Quelles sont les évolutions récentes du marché mondial des infrastructures pétrolières et gazières?
- En janvier 2025, Baker Hughes a obtenu une commande importante de Tecnicas Reunidas pour fournir six compresseurs de propane et six trains de compression de gaz pour la troisième phase du champ gazier Saudi Aramco , y compris des solutions de compression électrique à moteur, et le projet complétera également la collaboration à long terme de Baker Hughes , avec Aramco dans plusieurs installations de gaz, renforçant la position de l'entreprise dans la chaîne de valeur du gaz naturel et les projets d'infrastructure de gaz à grande échelle
- En janvier 2025, BP a lancé avec succès le flux de gaz provenant des puits du projet GNL de la phase 1 du Grand Tortue Ahmeyim, acheminant la production vers son navire FPSO pour la prochaine étape de mise en service, et une fois achevé, le projet devrait fournir plus de 2,3 millions de tonnes de GNL par année, marquant ainsi un jalon clé qui améliore l'empreinte mondiale de BP.
- En septembre 2024, Exxon Mobil Corporation et Mitsubishi Corporation ont signé un accord-cadre qui permettra à Mitsubishi de participer à l'usine avancée de Baytown, au Texas, qui produira de l'hydrogène à faible teneur en carbone avec environ 98 % d'efficacité de captage du carbone et jusqu'à un milliard de bcf par jour d'hydrogène ainsi qu'un million de tonnes d'ammoniac à faible teneur en carbone chaque année, soutenant les deux entreprises dans leur effort stratégique vers des infrastructures énergétiques à faible teneur en carbone.
- En août 2024, Chevron a annoncé un investissement de 1 milliard de dollars pour la création d'un centre d'excellence en ingénierie et en innovation à Bengaluru, son premier centre d'ingénierie et d'innovation à grande échelle en Inde, axé sur les capacités numériques et en ingénierie, renforçant ainsi l'engagement à long terme de Chevron dans les solutions énergétiques axées sur la technologie et l'expansion de l'innovation mondiale.
SKU-
Accédez en ligne au rapport sur le premier cloud mondial de veille économique

- Tableau de bord d'analyse de données interactif
- Tableau de bord d'analyse d'entreprise pour les opportunités à fort potentiel de croissance
- Accès d'analyste de recherche pour la personnalisation et les requêtes
- Analyse de la concurrence avec tableau de bord interactif
- Dernières actualités, mises à jour et analyse des tendances
- Exploitez la puissance de l'analyse comparative pour un suivi complet de la concurrence
Méthodologie de recherche
La collecte de données et l'analyse de l'année de base sont effectuées à l'aide de modules de collecte de données avec des échantillons de grande taille. L'étape consiste à obtenir des informations sur le marché ou des données connexes via diverses sources et stratégies. Elle comprend l'examen et la planification à l'avance de toutes les données acquises dans le passé. Elle englobe également l'examen des incohérences d'informations observées dans différentes sources d'informations. Les données de marché sont analysées et estimées à l'aide de modèles statistiques et cohérents de marché. De plus, l'analyse des parts de marché et l'analyse des tendances clés sont les principaux facteurs de succès du rapport de marché. Pour en savoir plus, veuillez demander un appel d'analyste ou déposer votre demande.
La méthodologie de recherche clé utilisée par l'équipe de recherche DBMR est la triangulation des données qui implique l'exploration de données, l'analyse de l'impact des variables de données sur le marché et la validation primaire (expert du secteur). Les modèles de données incluent la grille de positionnement des fournisseurs, l'analyse de la chronologie du marché, l'aperçu et le guide du marché, la grille de positionnement des entreprises, l'analyse des brevets, l'analyse des prix, l'analyse des parts de marché des entreprises, les normes de mesure, l'analyse globale par rapport à l'analyse régionale et des parts des fournisseurs. Pour en savoir plus sur la méthodologie de recherche, envoyez une demande pour parler à nos experts du secteur.
Personnalisation disponible
Data Bridge Market Research est un leader de la recherche formative avancée. Nous sommes fiers de fournir à nos clients existants et nouveaux des données et des analyses qui correspondent à leurs objectifs. Le rapport peut être personnalisé pour inclure une analyse des tendances des prix des marques cibles, une compréhension du marché pour d'autres pays (demandez la liste des pays), des données sur les résultats des essais cliniques, une revue de la littérature, une analyse du marché des produits remis à neuf et de la base de produits. L'analyse du marché des concurrents cibles peut être analysée à partir d'une analyse basée sur la technologie jusqu'à des stratégies de portefeuille de marché. Nous pouvons ajouter autant de concurrents que vous le souhaitez, dans le format et le style de données que vous recherchez. Notre équipe d'analystes peut également vous fournir des données sous forme de fichiers Excel bruts, de tableaux croisés dynamiques (Fact book) ou peut vous aider à créer des présentations à partir des ensembles de données disponibles dans le rapport.

