Us Busway Market
Taille du marché en milliards USD
TCAC :
% 
 USD
2.58 Billion
USD
4.60 Billion
2025
2033
USD
2.58 Billion
USD
4.60 Billion
2025
2033
| 2026 –2033 | |
| USD 2.58 Billion | |
| USD 4.60 Billion | |
| % | |
|
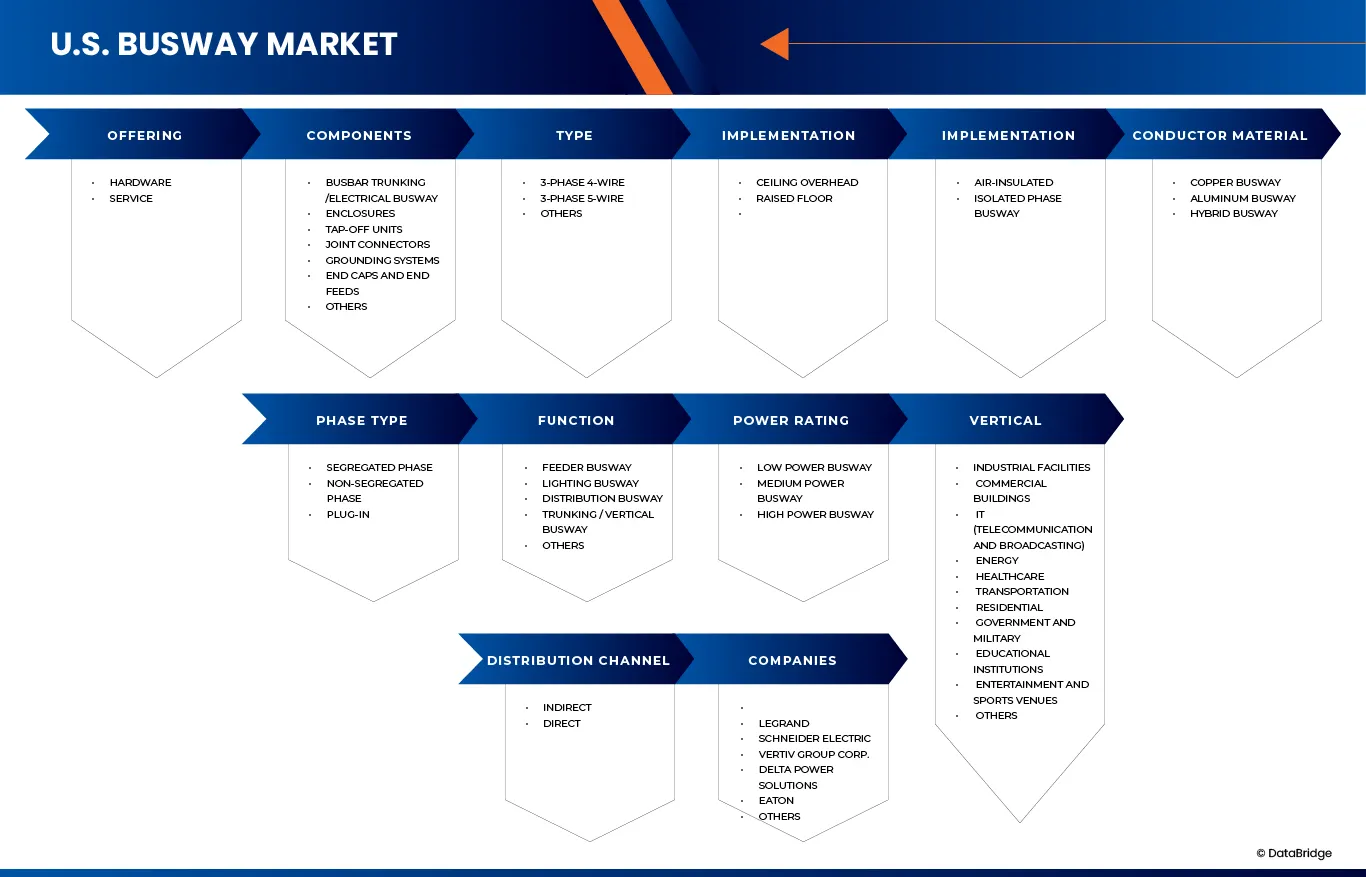
Segmentation du marché américain des barres omnibus, par offre (matériel et service), composants (goulottes électriques, boîtiers, unités de dérivation, connecteurs, systèmes de mise à la terre, embouts et alimentations, et autres), type (triphasé 4 fils, triphasé 5 fils et autres), mise en œuvre (plafond et plancher technique), isolation (à air, phase isolée et barre omnibus), matériaux conducteurs (cuivre, aluminium et hybride), type de phase (phase séparée, phase non séparée et enfichable), fonction (barrette d'alimentation, d'éclairage, de distribution, goulotte verticale et autres), puissance nominale (basse puissance, moyenne puissance et haute puissance), secteur d'activité (informatique (télécommunications et radiodiffusion), résidentiel, bâtiments commerciaux, installations industrielles, santé, transport, établissements d'enseignement, énergie, gouvernement et armée, lieux de divertissement et sportifs, etc.). Autres), Canal de distribution (direct et indirect) - Tendances et prévisions du secteur jusqu'en 2033
Taille du marché américain des busway
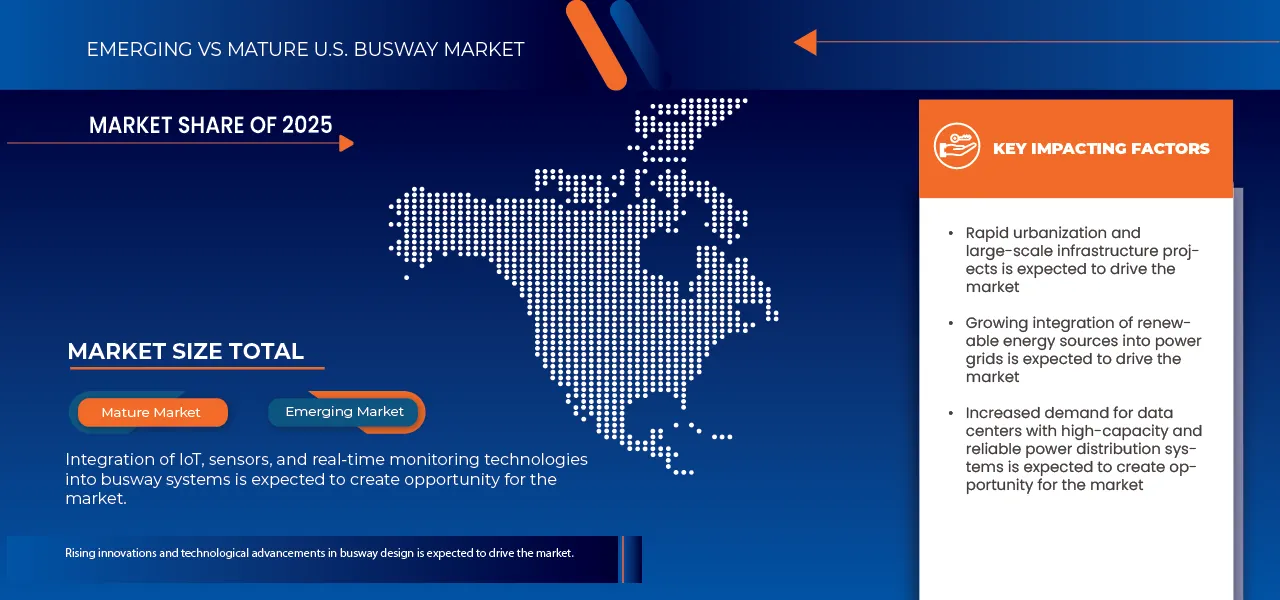
- Le marché américain des voies de bus partagées était évalué à 2,58 milliards de dollars en 2025 et devrait atteindre 4,60 milliards de dollars d'ici 2033 , avec un TCAC de 7,6 % au cours de la période de prévision.
- Le marché américain des systèmes de barres omnibus connaît une forte croissance, portée par la demande croissante de systèmes de distribution d'énergie efficaces, fiables et sûrs dans les secteurs commercial, industriel et institutionnel. Les systèmes de barres omnibus sont de plus en plus privilégiés par rapport au câblage traditionnel en raison de leur facilité d'installation, de leurs besoins de maintenance réduits, de leur sécurité accrue et de leur évolutivité. L'expansion du marché est également soutenue par les progrès technologiques, l'importance croissante accordée à l'efficacité énergétique et le développement continu des infrastructures. Parmi les principaux moteurs de croissance figurent l'expansion rapide des centres de données, l'automatisation croissante dans tous les secteurs et l'urbanisation accélérée, autant d'éléments qui favorisent l'adoption de solutions de barres omnibus modulaires et performantes. Les innovations produits continues, telles que les matériaux d'isolation avancés, les conceptions modulaires et la compatibilité avec les systèmes d'énergies renouvelables, renforcent la compétitivité du marché et assurent une adoption à long terme.
- Le marché est segmenté selon de multiples dimensions, notamment l'offre, les composants, le type, la mise en œuvre, l'isolation, le matériau conducteur, le type de phase, la fonction, la puissance nominale, le secteur d'activité et le canal de distribution. En fonction de l'offre, le marché se divise en matériel et services. Le segment du matériel comprend les barres omnibus pour centres de données, les barres omnibus pour installations industrielles, les systèmes multimoteurs à bus rapide et autres. La catégorie « centres de données » est elle-même subdivisée en unités de distribution d'énergie (PDU), barres omnibus blindées haute tension, barres omnibus à isolation renforcée et barres omnibus à jonction aérienne. Le segment des services comprend les services professionnels (conception et ingénierie, fabrication sur mesure et installation) et les services gérés (maintenance, surveillance à distance et mises à niveau des systèmes).
- D'ici 2026, le segment du matériel devrait dominer le marché américain des systèmes de barres omnibus, sous l'effet de la demande croissante en énergie et du besoin d'infrastructures de distribution électrique performantes et efficaces, notamment dans les centres de données et les installations industrielles. En comparaison, le segment des services devrait croître plus lentement, car les activités d'installation et de maintenance sont généralement ponctuelles et interviennent après le déploiement initial du matériel, plutôt que de constituer les principaux moteurs de la demande.
Analyse du marché américain des busway
- L'évolution des systèmes de barres omnibus a débuté au début du XXe siècle, sous l'impulsion de l'industrialisation rapide et du besoin croissant d'une distribution d'énergie électrique plus sûre et plus efficace. Les méthodes de câblage traditionnelles, reposant sur de vastes réseaux de cuivre ou d'aluminium, sont devenues de plus en plus complexes et inefficaces face à l'augmentation des besoins en énergie des grandes installations industrielles et commerciales. Pour relever ces défis, les systèmes de barres omnibus, également appelés conduits électriques, ont été introduits comme une alternative simplifiée, capable de supporter des intensités plus élevées tout en améliorant la sécurité et en simplifiant l'installation. Au fil du temps, les progrès réalisés dans les matériaux conducteurs, les technologies d'isolation et la conception structurelle ont considérablement amélioré les performances des barres omnibus, les imposant comme une solution standard dans les infrastructures électriques modernes.
- Aujourd'hui, les systèmes de barres omnibus sont largement utilisés dans les usines, les bâtiments commerciaux, les centres de données et les plateformes de transport en raison de leur flexibilité, de leur fiabilité et de leur évolutivité. Les récents développements sur le marché américain des barres omnibus témoignent de cette demande croissante. En mai 2024, LS Cable & System a annoncé son projet de construction d'une nouvelle usine de fabrication de barres omnibus à Querétaro, au Mexique, destinée à approvisionner les marchés américain et canadien. Cette usine, dont la mise en service est prévue pour mi-2025, permettra de répondre à la demande croissante des centres de données, des usines de semi-conducteurs, des fabricants de véhicules électriques et des usines de batteries, soulignant ainsi le rôle des systèmes de barres omnibus dans le développement des infrastructures à grande échelle et l'aménagement urbain en Amérique du Nord.
- L'innovation sur le marché s'accélère. En septembre 2021, Vertiv a lancé le tableau de distribution électrique à distance Liebert RXA et le système de barres omnibus Liebert MBX, conçus pour répondre aux contraintes d'espace, d'évolutivité et d'efficacité énergétique dans les environnements à haute densité tels que les centres de données. Ces solutions permettent une distribution électrique aérienne flexible, une sécurité accrue et une utilisation optimisée de l'espace au sol. Ces avancées soulignent la transition du secteur vers des systèmes de distribution électrique modulaires, économes en énergie et durables, et renforcent l'importance croissante des technologies de barres omnibus pour répondre aux besoins électriques modernes.
- Le segment des canalisations électriques à barres omnibus devrait dominer le marché avec une part de marché de 42,11 % en 2026, grâce à son rendement élevé en matière de transmission de puissance, sa conception compacte et ses pertes d'énergie réduites par rapport aux systèmes de câbles conventionnels. De plus, sa facilité d'installation, ses besoins de maintenance réduits et ses caractéristiques de sécurité supérieures rendent les systèmes de canalisations électriques à barres omnibus particulièrement adaptés aux bâtiments commerciaux, aux installations industrielles, aux centres de données et aux grands projets d'infrastructure, favorisant ainsi leur adoption et leur position dominante sur le marché.
Portée du rapport et segmentation du marché américain des busway
|
Attributs |
Aperçus clés du marché des systèmes de busway aux États-Unis |
|
Segments couverts |
|
|
Pays couverts |
NOUS |
|
Acteurs clés du marché |
|
|
Opportunités de marché |
|
|
Ensembles d'informations de données à valeur ajoutée |
En plus des informations sur le marché telles que la valeur du marché, le taux de croissance, les segments de marché, la couverture géographique, les acteurs du marché et le scénario de marché, le rapport de marché élaboré par l'équipe de Data Bridge Market Research comprend une analyse approfondie d'experts, une analyse des importations/exportations, une analyse des prix, une analyse de la consommation de production et une analyse PESTLE. |
Tendances du marché américain des voies de bus
« Intégration croissante des sources d’énergie renouvelables dans les réseaux électriques »
- L'intégration croissante des énergies renouvelables aux réseaux électriques est un moteur important du marché américain des barres omnibus. Avec la multiplication des installations d'énergies renouvelables, telles que les parcs solaires et éoliens, le besoin en systèmes de distribution d'énergie efficaces, évolutifs et fiables s'est considérablement accru. Les barres omnibus, reconnues pour leur conception préfabriquée et leurs faibles pertes d'énergie, sont idéales pour raccorder les sites de production d'énergie renouvelable aux réseaux électriques et de distribution. Leur capacité à gérer des charges électriques élevées et leur adaptabilité à diverses configurations en font un élément essentiel de la modernisation des infrastructures de réseau afin de s'adapter aux fluctuations de la production d'énergie renouvelable.
- De plus, l'intérêt croissant pour la décarbonation et les solutions énergétiques durables aux États-Unis a entraîné des investissements importants dans les projets d'énergies renouvelables. Les secteurs public et privé privilégient la modernisation des infrastructures afin d'intégrer harmonieusement les sources d'énergie renouvelables aux réseaux électriques existants. Les barres omnibus jouent un rôle crucial dans cette transition en offrant des solutions de distribution d'énergie compactes, durables et efficaces, répondant à la demande croissante de systèmes de stockage d'énergie et de micro-réseaux. Cette tendance devrait stimuler une croissance substantielle du marché des barres omnibus aux États-Unis.
- L'intégration des énergies renouvelables aux réseaux électriques accélère la demande en solutions de distribution d'énergie avancées, telles que les barres omnibus. Leur efficacité, leur évolutivité et leur adaptabilité les rendent indispensables à la modernisation des infrastructures de réseau et à la transition énergétique. Face à la hausse continue des investissements dans les énergies renouvelables, le marché des barres omnibus est promis à une croissance substantielle et jouera un rôle crucial dans la construction d'un avenir énergétique plus propre et plus efficace.
Dynamique du marché américain des busway
Conducteur
« Intérêt croissant pour les systèmes de distribution d’énergie écoénergétiques dans les secteurs industriels et commerciaux »
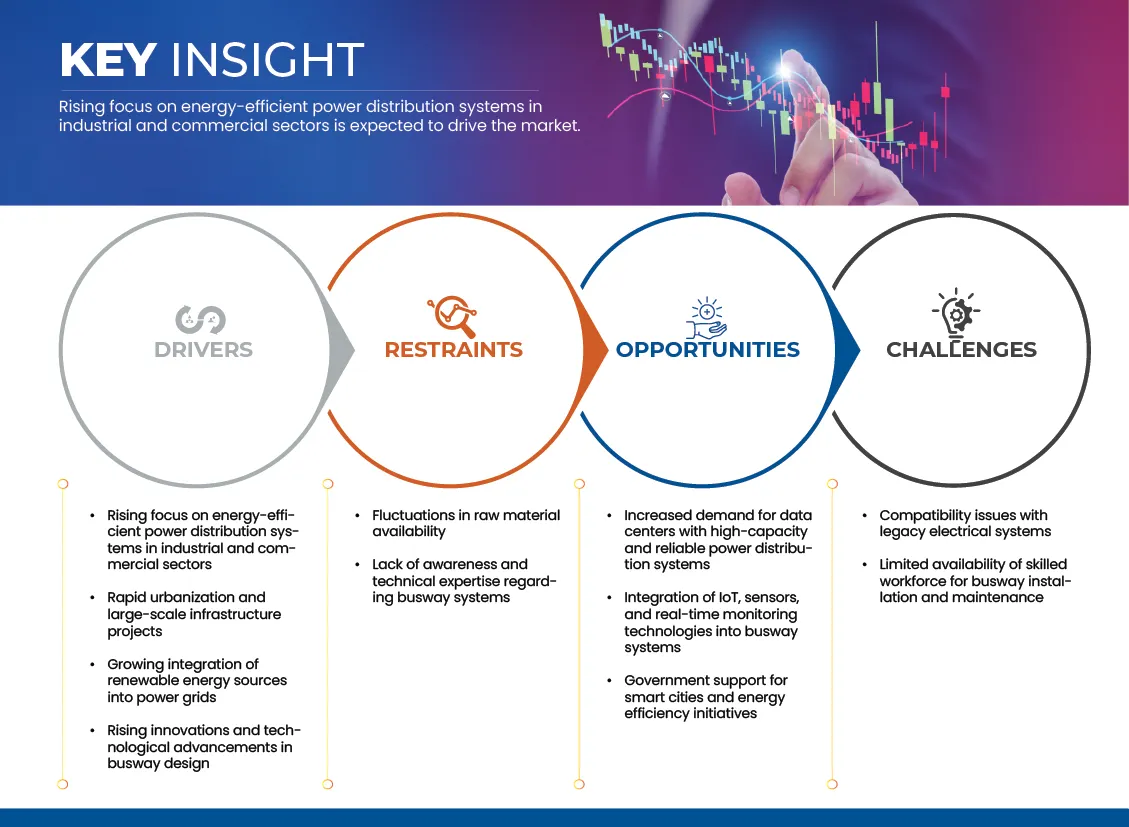
- Aux États-Unis, l'intérêt croissant pour les systèmes de distribution d'énergie à haute efficacité énergétique dans les secteurs industriels et commerciaux stimule fortement la croissance du marché des barres omnibus. Les industries sont soumises à une pression accrue pour se conformer à des réglementations environnementales strictes et réduire leurs coûts d'exploitation, ce qui engendre une demande pour des solutions minimisant les pertes d'énergie. Les barres omnibus sont particulièrement intéressantes dans ce contexte, car elles permettent un transfert d'énergie plus efficace avec des pertes électriques moindres que les systèmes de câbles traditionnels. Les secteurs à forte consommation d'énergie, tels que les usines, les centres de données et les bâtiments commerciaux, adoptent de plus en plus les barres omnibus pour optimiser leur consommation d'énergie et améliorer leur efficacité opérationnelle.
- L'accent mis sur le développement durable et les initiatives de construction écologique accélère l'adoption des systèmes de barres omnibus à haut rendement énergétique aux États-Unis. Ces systèmes améliorent non seulement l'efficacité énergétique, mais optimisent également l'utilisation de l'espace, permettant aux entreprises d'améliorer leurs performances opérationnelles tout en réduisant leur empreinte environnementale. Les barres omnibus offrent une grande flexibilité de conception, permettant des solutions sur mesure qui répondent à des besoins énergétiques spécifiques et s'intègrent parfaitement aux infrastructures modernes. Par conséquent, de plus en plus de secteurs intègrent les barres omnibus à leurs stratégies de gestion de l'énergie, stimulant ainsi l'innovation et l'expansion du marché.
- Les développements récents illustrent cette tendance. En septembre 2021, Vertiv a lancé le panneau de distribution déporté Liebert RXA et le système de barres omnibus Liebert MBX, offrant des solutions flexibles, compactes et économes en énergie pour les applications haute densité telles que les centres de données. En avril 2024, Schneider Electric a présenté l'I-Line Track, une barre omnibus de moyenne puissance conçue pour un déploiement évolutif et écoénergétique dans les centres de données. Par ailleurs, en mai 2022, Elsewedy Electric a inauguré la première usine africaine de production de systèmes d'isolation diélectrique époxy pour barres omnibus, proposant des solutions économes en énergie, compactes et faciles à installer. Ces innovations témoignent de l'importance accordée par le marché au développement durable, à l'efficacité opérationnelle et à l'optimisation énergétique, renforçant ainsi l'adoption des systèmes de barres omnibus comme composante essentielle de l'infrastructure de distribution électrique américaine.
Retenue/Défi
« Fluctuations de la disponibilité des matières premières »
- La production de systèmes de barres omnibus dépend fortement de matériaux clés tels que le cuivre, l'aluminium, l'acier et les isolants spécialisés, dont les prix sont souvent sujets à la volatilité des prix et aux perturbations des chaînes d'approvisionnement. La variabilité de la disponibilité de ces matières premières peut entraîner une hausse des coûts de production, des retards de fabrication et une limitation des approvisionnements, ce qui affecte la livraison des systèmes de barres omnibus aux clients dans les délais impartis. Cela représente un défi pour les fabricants qui s'efforcent de répondre à une demande croissante, notamment dans les régions connaissant un développement important des infrastructures et une expansion industrielle.
- Les fluctuations des prix des matières premières peuvent également réduire la compétitivité des systèmes de barres omnibus par rapport aux autres systèmes de distribution d'énergie. Des hausses importantes du coût des matériaux peuvent contraindre les fabricants à augmenter les prix des barres omnibus, les rendant moins rentables pour certains consommateurs et risquant de freiner leur adoption sur les marchés sensibles aux prix. Pour atténuer ces difficultés, les entreprises du secteur des barres omnibus doivent diversifier leurs fournisseurs, optimiser leurs processus de production et explorer des matériaux alternatifs afin de stabiliser leurs coûts et de maintenir leur compétitivité.
- Des exemples récents soulignent l'impact des fluctuations des matières premières sur le marché des barres omnibus. En octobre 2024, les prix de l'aluminium au London Metal Exchange ont augmenté de 1,8 % pour atteindre 2 640 USD la tonne, en raison du coût élevé de l'alumine et de la demande croissante de la Chine, illustrant ainsi les fragilités de la chaîne d'approvisionnement. De même, en novembre 2024, les prix du cuivre ont fluctué en raison de pénuries de cuivre secondaire et de retards douaniers au port de Klang West en Malaisie, ce qui devrait entraîner une baisse des exportations de 20 à 40 %. Ces fluctuations augmentent les coûts de production et créent des incertitudes quant à l'approvisionnement, soulignant la nécessité d'une gestion stratégique des approvisionnements en matières premières afin de garantir la stabilité et la croissance à long terme du marché des barres omnibus.
Étendue du marché des busway aux États-Unis
Le marché américain des systèmes de barres omnibus est segmenté en onze segments notables qui sont basés sur l'offre, les composants, le type, la mise en œuvre, l'isolation, le matériau conducteur, le type de phase, la fonction, la puissance nominale, la verticalité et le canal de distribution.
- En offrant
En fonction de l'offre, le marché est segmenté en matériel et services. En 2026, le segment du matériel devrait dominer le marché américain des systèmes de barres omnibus avec une part de marché de 77,37 %, en raison de la forte demande en composants physiques tels que les barres omnibus, les armoires électriques et les unités de dérivation pour les nouvelles constructions et les mises à niveau d'infrastructures, ainsi que de leur longue durée de vie et du fait qu'il s'agit d'un investissement initial unique.
Le segment du matériel devrait connaître la plus forte croissance annuelle composée (TCAC) de 7,7 % au cours de la période de prévision allant de 2026 à 2033, grâce à la poursuite des investissements dans les installations industrielles, les centres de données et les bâtiments commerciaux, ainsi qu'au remplacement croissant des systèmes de câbles conventionnels par des solutions de barres omnibus.
- Par composants
Le marché est segmenté, selon les composants, en canalisations électriques, coffrets, unités de dérivation, connecteurs, systèmes de mise à la terre, embouts et alimentations, et autres. En 2026, le segment des canalisations électriques devrait dominer le marché américain des systèmes de distribution d'énergie avec une part de marché de 42,11 %, grâce à son rôle essentiel dans la distribution d'énergie, sa capacité de transport de courant élevée, sa conception compacte et ses pertes de puissance réduites par rapport aux systèmes de câblage traditionnels.
Le segment des canalisations électriques/busway devrait connaître la plus forte croissance annuelle composée (TCAC) de 8,5 % au cours de la période de prévision allant de 2026 à 2033, en raison de son adoption croissante dans des applications énergivores telles que les centres de données, les infrastructures pour véhicules électriques et les projets d'automatisation industrielle.
- Par type
Le marché est segmenté, selon le type de système, en systèmes triphasés à 4 fils, systèmes triphasés à 5 fils et autres. En 2026, le segment des systèmes triphasés à 4 fils devrait dominer le marché américain des barres omnibus avec une part de marché de 63,96 %, grâce à sa large applicabilité dans les systèmes de distribution d'énergie commerciaux et industriels et à son rapport coût-efficacité par rapport aux configurations plus complexes.
Le segment triphasé à 4 fils devrait connaître la plus forte croissance annuelle composée (TCAC) de 7,8 % au cours de la période de prévision allant de 2026 à 2033, en raison de l'expansion des activités de construction commerciale et de la demande accrue de solutions de distribution d'énergie efficaces à basse et moyenne tension.
- Par la mise en œuvre
Selon le mode de mise en œuvre, le marché est segmenté en deux catégories : les systèmes suspendus au plafond et les planchers techniques. En 2026, le segment des systèmes suspendus au plafond devrait dominer le marché américain des systèmes de barres omnibus avec une part de marché de 59,24 %, grâce à sa facilité d’installation, l’optimisation de l’espace qu’il offre, une sécurité accrue et son adéquation aux sites industriels et aux entrepôts.
Le segment des plafonds suspendus devrait connaître la plus forte croissance annuelle composée (TCAC) de 7,9 % au cours de la période de prévision allant de 2026 à 2033, en raison de son adoption croissante dans les installations de fabrication et les centres logistiques qui recherchent des configurations de distribution électrique flexibles et évolutives.
- Par isolation
En fonction du type d'isolation, le marché est segmenté en barres omnibus à isolation par air et barres omnibus à phase isolée. En 2026, le segment des barres omnibus à isolation par air devrait dominer le marché américain des barres omnibus avec une part de marché de 77,69 %, grâce à son rapport coût-efficacité, sa conception plus simple et son adoption généralisée dans les applications basse et moyenne tension.
Le segment des isolants à air devrait connaître la plus forte croissance annuelle composée (TCAC) de 7,7 % au cours de la période de prévision allant de 2026 à 2033, en raison de son utilisation croissante dans les bâtiments commerciaux et les environnements industriels où les performances d'isolation standard sont suffisantes.
- Par matériau conducteur
En fonction du matériau conducteur, le marché est segmenté en barres omnibus en cuivre, en aluminium et hybrides. En 2026, le segment des barres omnibus en cuivre devrait dominer le marché américain avec une part de marché de 54,92 %, grâce à sa conductivité électrique supérieure, ses performances thermiques plus élevées et sa fiabilité dans les applications à forte charge.
Le segment des barres omnibus en cuivre devrait connaître la plus forte croissance annuelle composée (TCAC) de 7,9 % au cours de la période de prévision allant de 2026 à 2033, en raison de son déploiement croissant dans des infrastructures critiques telles que les centres de données, les établissements de santé et les usines industrielles.
- Par type de phase
Selon le type de phase, le marché est segmenté en phases séparées, phases non séparées et enfichables. En 2026, le segment des phases non séparées devrait dominer le marché américain des systèmes de barres omnibus avec une part de marché de 48,67 %, grâce à sa structure compacte, ses avantages en termes de coûts et son adéquation aux applications industrielles et commerciales standard.
Le segment des phases non séparées devrait connaître la plus forte croissance annuelle composée (TCAC) de 7,8 % au cours de la période de prévision allant de 2026 à 2033, en raison de la demande croissante de solutions de distribution d'énergie économiques et peu encombrantes.
- Par fonction
En fonction de leur fonction, le marché est segmenté en systèmes de barres omnibus d'alimentation, systèmes de barres omnibus d'éclairage, systèmes de barres omnibus de distribution, systèmes de barres omnibus verticales et autres. En 2026, le segment des systèmes de barres omnibus d'alimentation devrait dominer le marché américain des systèmes de barres omnibus avec une part de marché de 36,92 %, grâce à leur utilisation intensive pour le transport de l'énergie des sous-stations vers les points de distribution dans les installations industrielles et commerciales.
Le segment des systèmes de distribution par barres omnibus devrait connaître la plus forte croissance annuelle composée (TCAC) de 7,9 % au cours de la période de prévision allant de 2026 à 2033, en raison de l'électrification industrielle croissante et de l'expansion des projets d'infrastructure à grande échelle.
- Par puissance nominale
En fonction de la puissance nominale, le marché est segmenté en barres omnibus de faible puissance, de moyenne puissance et de haute puissance. En 2026, le segment des barres omnibus de moyenne puissance devrait dominer le marché américain avec une part de marché de 49,66 %, grâce à son adéquation aux applications commerciales et industrielles.
Le segment des barres omnibus de moyenne puissance devrait connaître la plus forte croissance annuelle composée (TCAC) de 7,9 % au cours de la période de prévision allant de 2026 à 2033, en raison de la demande croissante des unités de fabrication, des complexes commerciaux et des centres de données.
- Par vertical
Le marché est segmenté par secteur d'activité : télécommunications et radiodiffusion, résidentiel, bâtiments commerciaux, installations industrielles, santé, transports, établissements d'enseignement, énergie, administration publique et armée, lieux de divertissement et de sport, et autres. En 2026, le segment des installations industrielles devrait dominer le marché américain des systèmes de barres omnibus avec une part de marché de 24,63 %, en raison des besoins élevés en énergie, du fonctionnement continu et de l'automatisation croissante dans tous les secteurs.
Le segment des installations industrielles devrait connaître la plus forte croissance annuelle composée (TCAC) de 8,4 % au cours de la période de prévision allant de 2026 à 2033, en raison de l'expansion industrielle en cours, de la relocalisation de la production et de la modernisation des infrastructures énergétiques.
- Par canal de distribution
En fonction du canal de distribution, le marché est segmenté en distribution indirecte et directe. En 2026, le segment indirect devrait dominer le marché américain des systèmes de barres omnibus avec une part de marché de 74,54 %, grâce à la forte présence de distributeurs, d'intégrateurs de systèmes et d'entrepreneurs EPC proposant des solutions intégrées et un support technique.
Le segment de la vente directe devrait connaître la plus forte croissance annuelle composée (TCAC) de 7,8 % au cours de la période de prévision allant de 2026 à 2033, en raison de la préférence croissante des grandes entreprises pour l'approvisionnement direct auprès des fabricants afin de réduire les coûts et d'assurer la personnalisation.
Analyse du marché américain des systèmes de busway
Le marché américain des systèmes de busway est promis à une forte croissance, portée par un intérêt croissant pour les systèmes de distribution d'énergie économes en énergie dans les secteurs industriels et commerciaux, l'urbanisation rapide et les projets d'infrastructure à grande échelle, l'intégration croissante des sources d'énergie renouvelables dans les réseaux électriques et les innovations et progrès technologiques croissants dans la conception des systèmes de busway.
Part de marché des busway aux États-Unis
Le secteur des voies de bus est principalement dominé par des entreprises bien établies, notamment :
- ABB (Suisse)
- Siemens (Allemagne)
- Schneider Electric (France)
- Eaton (Irlande)
- EAE ELECTRIK (Turquie)
- Furukawa Electric Co., Ltd. (Japon)
- Honeywell International Inc. (États-Unis)
- Powell Industries (États-Unis)
- Starline Holdings, LLC. (États-Unis)
- Produits Chatsworth (États-Unis)
- Panduit Corp. (États-Unis)
- Delta Power Solutions (Taïwan)
- Rittal Pvt. Ltd (Allemagne)
- Vertiv Group Corp. (États-Unis)
- Legrand (France)
- Anord Mardix (Irlande)
- Groupe MEGABARRE (Italie)
- USPWR (États-Unis)
- LS Cable & System USA (États-Unis)
Dernières évolutions du marché américain des busway
- En décembre 2024, Legrand a fait l'acquisition de Power Bus Way, leader nord-américain des barres omnibus d'alimentation Cable Bus pour centres de données. Cette acquisition, la huitième de l'année pour l'entreprise, renforce sa position sur le marché en pleine croissance des centres de données, axé sur la transition énergétique et numérique.
- En septembre 2024, Legrand a annoncé l'acquisition d'UPSistemas en Colombie et d'APP en Australie, renforçant ainsi sa présence sur les marchés des centres de données et de la gestion des câbles. Ces acquisitions portent à sept le nombre total d'opérations de croissance externe réalisées cette année, contribuant à un chiffre d'affaires annualisé de près de 350 millions d'euros.
- En octobre 2024, Schneider Electric s'est associé à l'aéroport international de Noida pour mettre en œuvre des solutions avancées de gestion des bâtiments et de l'énergie, notamment des systèmes SCADA électriques et ADMS. Ces solutions permettront d'améliorer l'efficacité énergétique, la durabilité et la performance opérationnelle, contribuant ainsi au bon fonctionnement de l'aéroport et à la réduction des émissions de carbone.
- En octobre 2024, Eaton a agrandi son usine de Puducherry, ajoutant 11 150 mètres carrés dédiés aux produits de distribution d'énergie et à un centre de recherche et développement. Cet agrandissement double la capacité de production de produits essentiels, soutient l'initiative indienne « Make in India » et crée plus de 300 emplois.
SKU-
Accédez en ligne au rapport sur le premier cloud mondial de veille économique

- Tableau de bord d'analyse de données interactif
- Tableau de bord d'analyse d'entreprise pour les opportunités à fort potentiel de croissance
- Accès d'analyste de recherche pour la personnalisation et les requêtes
- Analyse de la concurrence avec tableau de bord interactif
- Dernières actualités, mises à jour et analyse des tendances
- Exploitez la puissance de l'analyse comparative pour un suivi complet de la concurrence
Table des matières
1 INTRODUCTION
1.1 OBJECTIFS DE L'ÉTUDE
1.2 DÉFINITION DU MARCHÉ
1.3 APERÇU DU MARCHÉ DES BUSWAYS AUX ÉTATS-UNIS
1.4 DEVISES ET TARIFICATION
1.5 LIMITES
1,6 MARCHÉS COUVERTS
2. SEGMENTATION DU MARCHÉ
2.1 MARCHÉS COUVERTS
2,2 ANS PÉRIODE CONSIDÉRÉE POUR L'ÉTUDE
2.3 MODÈLE DE VALIDATION DES DONNÉES DBMR TRIPOD
2.4 ENTRETIENS PRIMAIRES AVEC LES PRINCIPAUX LEADERS D'OPINION
2.5 Grille de position de marché DBMR
2.6 ANALYSE DES PARTS DE MARCHÉ DES FOURNISSEURS
2.7 MODÉLISATION MULTIVARIÉE
2.8 COURBE DU CALENDRIER DE L'OFFRE
2.9 GRILLE DE COUVERTURE VERTICALE DU MARCHÉ
2.1 SOURCES SECONDAIRES
2.11 HYPOTHÈSES
3. RÉSUMÉ
4 APERÇUS PREMIUM
4.1 LES CINQ FORCES DE PORTER
4.2 PRODUITS DE BUSWAY
4.2.1 États-Unis
4.2.1.1 VOIES DE BUS INTÉRIEURES
4.2.1.2 VOIES DE BUS EXTÉRIEURES
4.2.1.3 BUSWAY À CONNECTEUR
4.3 NORMES RÉGLEMENTAIRES
4.4 ANALYSE DU SECTEUR ET SCÉNARIO FUTURISTE
4.4.1 ANALYSE DU SECTEUR
4.4.1.1 DEMANDE CROISSANTE DE SYSTÈMES DE DISTRIBUTION D'ÉNERGIE ÉCONOMES EN ÉNERGIE
4.4.1.2 INTÉGRATION CROISSANTE DES SOURCES D'ÉNERGIE RENOUVELABLES DANS LES RÉSEAUX ÉLECTRIQUES
4.4.2 SCÉNARIO FUTURISTE (PRÉVISIONS JUSQU'EN 2032)
4.4.3 CONCLUSION
4.5 CONCLUSION
4.6 CARTOGRAPHIE DE LA PÉNÉTRATION ET DES PERSPECTIVES DE CROISSANCE
4.6.1 PÉNÉTRATION DU MARCHÉ
4.6.1.1 TAILLE DU MARCHÉ ET PROJECTIONS DE CROISSANCE :
4.7 COMPORTEMENT DU CONSOMMATEUR
4.8 ANALYSE TECHNOLOGIQUE
4.9 DÉFIS
4.1 CLIENTS CLÉS
4.11 MISE EN ŒUVRE INTERNE/MISE EN ŒUVRE SOUS-TRAITÉE (PAR UN TIERS)
4.12 MATRICE TECHNOLOGIQUE
4.13 ANALYSE COMPARATIVE DES ENTREPRISES
4.14 MATRICE DE LA PLATEFORME DE SERVICES DE L'ENTREPRISE
4.15 ÉTATS D'USAGE ET LEUR ANALYSE
4.16 ANALYSE DES TARIFICATIONS BASÉE SUR LES VENTES, LE MARKETING ET LE SERVICE CLIENT
5. APERÇU DU MARCHÉ
5.1 PILOTES
5.1.1 INTÉRÊT CROISSANT POUR LES SYSTÈMES DE DISTRIBUTION D'ÉNERGIE ÉCONOMES EN ÉNERGIE DANS LES SECTEURS INDUSTRIEL ET COMMERCIAL
5.1.2 URBANISATION RAPIDE ET PROJETS D'INFRASTRUCTURE À GRANDE ÉCHELLE
5.1.3 INTÉGRATION CROISSANTE DES SOURCES D'ÉNERGIE RENOUVELABLES DANS LES RÉSEAUX ÉLECTRIQUES
5.1.4 INNOVATIONS ET AVANCÉES TECHNOLOGIQUES ÉMERGENTES DANS LA CONCEPTION DES VOIES DE BUS
5.2 MESURES DE RETENUE
5.2.1 FLUCTUATIONS DE LA DISPONIBILITÉ DES MATIÈRES PREMIÈRES
5.2.2 MANQUE DE CONNAISSANCES ET D'EXPERTISE TECHNIQUE CONCERNANT LES SYSTÈMES DE BUSWAY
5.3 OPPORTUNITÉS
5.3.1 DEMANDE ACCRUE DE CENTRES DE DONNÉES AVEC DES SYSTÈMES DE DISTRIBUTION ÉNERGÉTIQUE À HAUTE CAPACITÉ ET FIABLES
5.3.2 INTÉGRATION DES TECHNOLOGIES IOT, DES CAPTEURS ET DE SURVEILLANCE EN TEMPS RÉEL DANS LES SYSTÈMES DE VOIES PUBLIQUES
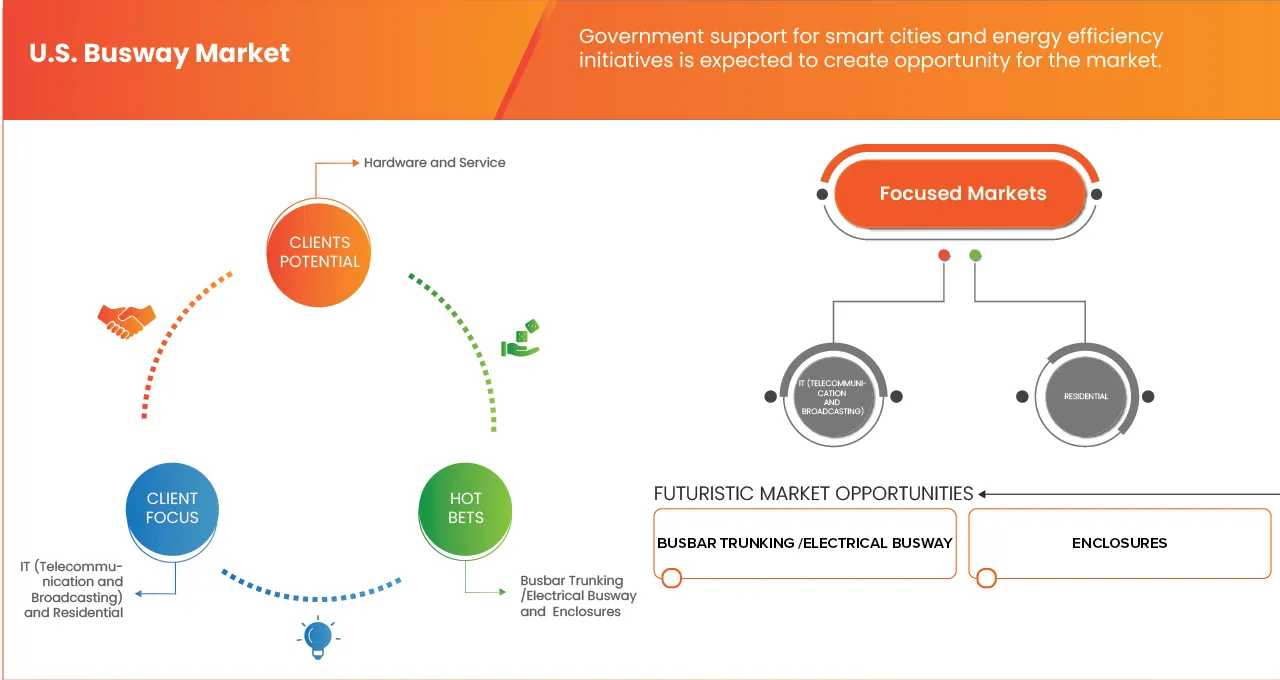
5.3.3 SOUTIEN GOUVERNEMENTAL AUX INITIATIVES DE VILLES INTELLIGENTES ET D'EFFICACITÉ ÉNERGÉTIQUE
5.4 DÉFIS
5.4.1 PROBLÈMES DE COMPATIBILITÉ AVEC LES SYSTÈMES ÉLECTRIQUES ANCIENS
5.4.2 DISPONIBILITÉ LIMITÉE DE MAIN-D'ŒUVRE QUALIFIÉE POUR L'INSTALLATION ET L'ENTRETIEN DES BUSWAYS
6 US BUSWAY MARKET, PAR OFFRE
6.1 APERÇU
6.2 MATÉRIEL
6.2.1 CENTRE DE DONNÉES
6.2.1.1 UNITÉS DE DISTRIBUTION D'ÉNERGIE (PDUS)
6.2.1.2 CHEMIN DE BUS FERMÉ À HAUTE RÉSISTANCE (CFW)
6.2.1.3 CHEMIN DE BUS À ÉPISSURE AIR (BMC)
6.2.1.4 BUSWAY À BOUCHON D'ISOLATION INTENSIVE (CMC)
6.2.1.5 VOIE DE BUS DE L'USINE
6.2.1.6 BUS RAPIDE MULTI-MOTEUR
6.2.1.7 AUTRES
6.3 SERVICE
6.3.1 SERVICE GÉRÉ
6.3.1.1 ENTRETIEN ET RÉPARATIONS
6.3.1.2 SURVEILLANCE À DISTANCE ET MAINTENANCE PRÉDICTIVE
6.3.1.3 PRISE EN CHARGE DES MISES À NIVEAU ET DE L'EXTENSION
6.3.2 SERVICE PROFESSIONNEL
6.3.2.1 CONCEPTION ET INGÉNIERIE
6.3.2.2 FABRICATION SUR MESURE
6.3.2.3 INSTALLATION ET MISE EN SERVICE
7 US BUSWAY MARKET, PAR OFFRE
7.1 APERÇU
7.2 GAINES DE BARRES BUS / VOIE DE BUS ÉLECTRIQUE
7.2.1 Voie de bus en cuivre
7.2.2 VOIE PUBLIQUE EN ALUMINIUM
7.2.3 VOIE DE BUS HYBRIDE
7.3 ENCEINTES
7.3.1 Voie de bus en cuivre
7.3.2 VOIE PUBLIQUE EN ALUMINIUM
7.3.3 VOIE DE BUS HYBRIDE
7.4 UNITÉS DE DÉPOSE
7.4.1 Voie de bus en cuivre
7.4.2 VOIE PUBLIQUE EN ALUMINIUM
7.4.3 VOIE DE BUS HYBRIDE
7.5 CONNECTEURS DE JOINT
7.5.1 Voie de bus en cuivre
7.5.2 VOIE PUBLIQUE EN ALUMINIUM
7.5.3 VOIE DE BUS HYBRIDE
7.6 SYSTÈMES DE MISE À LA TERRE
7.6.1 Voie de bus en cuivre
7.6.2 VOIE PUBLIQUE EN ALUMINIUM
7.6.3 VOIE DE BUS HYBRIDE
7.7 EMBOUTS ET ALIMENTATIONS D'EXTRÉMITÉ
7.7.1 Voie de bus en cuivre
7.7.2 VOIE PUBLIQUE EN ALUMINIUM
7.7.3 VOIE DE BUS HYBRIDE
7,8 AUTRES
8 MARCHÉ DES BUSWAYS AMÉRICAINS, PAR TYPE
8.1 APERÇU
8.2 TRIPHASÉ À 4 FILS
8.2.1 PLAFOND
8.2.2 PLANCHER SURÉLEVÉ
8.3 TRIPHASÉ 5 FILS
8.3.1 PLAFOND AU-DESSUS
8.3.2 PLANCHER SURÉLEVÉ
8.4 AUTRES
8.4.1 PLAFOND
8.4.2 PLANCHER SURÉLEVÉ
9 MARCHÉ DES BUSWAYS AMÉRICAINS, PAR MISE EN ŒUVRE
9.1 APERÇU
9.2 PLAFOND AU-DESSUS
9.3 PLANCHER SURÉLEVÉ
10 US BUSWAY MARKET, PAR ISOLATION\
10.1 APERÇU
10.2 ISOLATION À AIR
10.3 VOIE DE BUS À PHASE ISOLÉE
11 MARCHÉ DES BUSWAYS AMÉRICAINS, PAR MATÉRIAU CONDUCTEUR
11.1 APERÇU
11.1.1 Voie de bus en cuivre
11.1.2 VOIE PUBLIQUE EN ALUMINIUM
11.1.3 VOIE DE BUS HYBRIDE
12 MARCHÉS DES BUSWAYS AMÉRICAINS, PAR TYPE DE PHASE
12.1 APERÇU
12.2 PHASE NON SÉGRÉGÉE
12.3 PLUG-IN
12.4 PHASE SÉGRÉGÉE
13 MARCHÉ DES BUS US, PAR FONCTION
13.1 APERÇU
13.1.1 VOIE DE SERVICE D'ALIMENTATION
13.1.2 VOIE DE DISTRIBUTION DES BUS
13.1.3 VOIE DE BUS VERTICALE
13.1.4 ÉCLAIRAGE DE LA VOIE DE BUS
13.1.5 AUTRES
14 MARCHÉ DES BUSWAYS AMÉRICAINS, PAR PUISSANCE
14.1 APERÇU
14.2 VOIE DE BUS DE MOYENNE PUISSANCE
14.2.1 Voie de bus en cuivre
14.2.2 VOIE PUBLIQUE EN ALUMINIUM
14.2.3 VOIE DE BUS HYBRIDE
14.3 VOIE DE BUS À FAIBLE PUISSANCE
14.3.1 Voie de bus en cuivre
14.3.2 VOIE PUBLIQUE EN ALUMINIUM
14.3.3 VOIE DE BUS HYBRIDE
14.4 VOIE DE BUS À HAUTE PUISSANCE
14.4.1 Voie de bus en cuivre
14.4.2 VOIE PUBLIQUE EN ALUMINIUM
14.4.3 VOIE DE BUS HYBRIDE
15 US BUSWAY MARKET, PAR VERTICAL
15.1 APERÇU
15.1.1 INSTALLATIONS INDUSTRIELLES
15.1.2 BÂTIMENTS COMMERCIAUX
15.1.3 TI (TÉLÉCOMMUNICATIONS ET RADIODIFFUSION)
15.1.4 ÉNERGIE
15.1.5 SOINS DE SANTÉ
15.1.6 TRANSPORT
15.1.7 RÉSIDENTIEL
15.1.8 GOUVERNEMENT ET ARMÉE
15.1.9 ÉTABLISSEMENTS D'ENSEIGNEMENT
15.1.10 LIEUX DE DIVERTISSEMENT ET DE SPORTS
15.1.11 AUTRES
15.2 INSTALLATIONS INDUSTRIELLES AMÉRICAINES SUR LE MARCHÉ DE BUSWAY, PAR DEMANDE, 2018-2033 (MILLIERS DE DOLLARS USD)
15.2.1 CENTRE DE DONNÉES
15.2.2 Ferme de serveurs
15.2.3 CENTRES D'OPÉRATIONS DE RÉSEAU (NOCS)
15.2.4 AUTRES
15.3 INSTALLATIONS INDUSTRIELLES AMÉRICAINES SUR LE MARCHÉ DE BUSWAY, PAR OFFRE, 2018-2033 (MILLIERS DE DOLLARS USD)
15.3.1 MATÉRIEL
15.3.2 SERVICE
15.4 INSTALLATIONS INDUSTRIELLES AMÉRICAINES SUR LE MARCHÉ DES BUSWAYS, PAR TYPE DE MATÉRIEL, 2018-2033 (MILLIERS DE DOLLARS AMÉRICAINS)
15.4.1 CENTRE DE DONNÉES
15.4.2 FERME DE SERVEURS
15.4.3 CENTRES D'OPÉRATIONS RÉSEAU (NOCS)
15.4.4 AUTRES
15,5 CENTRES DE DONNÉES AMÉRICAINS SUR LE MARCHÉ DE BUSWAY, PAR TYPE, 2018-2033 (MILLIERS DE DONNÉES USD)
15.5.1 UNITÉS DE DISTRIBUTION D'ÉNERGIE (PDUS)
15.5.2 CHEMIN DE BUS FERMÉ HAUTE RÉSISTANCE (CFW)
15.5.3 INSÉRER À L'AIR DANS LA VOIE BUSWAY (BMC)
15.5.4 BUSWAY À BOUCHON D'ISOLATION INTENSIVE (CMC)
15.6 INSTALLATIONS INDUSTRIELLES AMÉRICAINES SUR LE MARCHÉ DES BUSWAYS, PAR TYPE DE SERVICE, 2018-2033 (MILLIERS DE DOLLARS USD)
15.6.1 SERVICE GÉRÉ
15.6.2 SERVICE PROFESSIONNEL
15.7 SERVICES PROFESSIONNELS AMÉRICAINS SUR LE MARCHÉ DES BUSWAYS, PAR TYPE, 2018-2033 (MILLIERS DE DOLLARS AMÉRICAINS)
15.7.1 INSTALLATION ET MISE EN SERVICE
15.7.2 FABRICATION SUR MESURE
15.7.3 CONCEPTION ET INGÉNIERIE
15.8 SERVICES GÉRÉS AUX ÉTATS-UNIS SUR LE MARCHÉ DES BUSWAYS, PAR TYPE, 2018-2033 (MILLIERS DE DOLLARS AMÉRICAINS)
15.8.1 ENTRETIEN ET RÉPARATIONS
15.8.2 SURVEILLANCE À DISTANCE ET MAINTENANCE PRÉDICTIVE
15.8.3 MISES À NIVEAU ET SUPPORT D'EXTENSION
15,9 BÂTIMENTS COMMERCIAUX AMÉRICAINS DANS LE MARCHÉ DE BUSWAY, PAR DEMANDE, 2018-2033 (MILLIERS DE DOLLARS)
15.9.1 IMMEUBLES DE BUREAUX
15.9.2 CENTRES COMMERCIAUX
15.9.3 HÔTELS
15.9.4 MAGASINS DE DÉTAIL
15.1 BÂTIMENTS COMMERCIAUX AMÉRICAINS DANS LE MARCHÉ DE BUSWAY, PAR OFFRE, 2018-2033 (MILLIERS DE DOLLARS USD)
15.10.1 MATÉRIEL
15.10.2 SERVICE
15.11 BÂTIMENTS COMMERCIAUX AMÉRICAINS DANS LE MARCHÉ DE BUSWAY, PAR TYPE DE QUINCAILLERIE, 2018-2033 (MILLIERS DE DOLLARS AMÉRICAINS)
15.11.1 CENTRE DE DONNÉES
Ferme de serveurs 15.11.2
15.11.3 CENTRES D'OPÉRATIONS RÉSEAU (NOCS)
15.11.4 AUTRES
15.12 CENTRES DE DONNÉES AMÉRICAINS SUR LE MARCHÉ DE BUSWAY, PAR TYPE, 2018-2033 (MILLIERS DE DOLLARS)
15.12.1 UNITÉS DE DISTRIBUTION D'ÉNERGIE (PDUS)
15.12.2 VOIE PUBLIQUE FERMÉE HAUTE RÉSISTANCE (CFW)
15.12.3 INSÉRER UNE CHEMINÉE PNEUMATIQUE (BMC)
15.12.4 BUSWAY À BOUCHON D'ISOLATION INTENSIVE (CMC)
15.13 BÂTIMENTS COMMERCIAUX AMÉRICAINS DANS LE MARCHÉ DES BUSWAYS, PAR TYPE DE SERVICE, 2018-2033 (MILLIERS DE DOLLARS AMÉRICAINS)
15.13.1 SERVICE GÉRÉ
15.13.2 SERVICE PROFESSIONNEL
15.14 SERVICES PROFESSIONNELS AMÉRICAINS SUR LE MARCHÉ DES BUSWAYS, PAR TYPE, 2018-2033 (MILLIERS DE DOLLARS AMÉRICAINS)
15.14.1 INSTALLATION ET MISE EN SERVICE
15.14.2 FABRICATION SUR MESURE
15.14.3 CONCEPTION ET INGÉNIERIE
15.15 SERVICES GÉRÉS AUX ÉTATS-UNIS SUR LE MARCHÉ DES BUSWAYS, PAR TYPE, 2018-2033 (MILLIERS DE DOLLARS AMÉRICAINS)
15.15.1 ENTRETIEN ET RÉPARATIONS
15.15.2 SURVEILLANCE À DISTANCE ET MAINTENANCE PRÉDICTIVE
15.15.3 PRISE EN CHARGE DES MISES À NIVEAU ET DES EXTENSIONS
15.16 US IT (TÉLÉCOMMUNICATIONS ET RADIODIFFUSION) SUR LE MARCHÉ DE BUSWAY, PAR DEMANDE, 2018-2033 (MILLIERS DE DOLLARS)
15.16.1 CENTRE DE DONNÉES
Ferme de serveurs 15.16.2
15.16.3 CENTRES D'OPÉRATIONS DE RÉSEAU (NOCS)
15.16.4 AUTRES
15.17 US IT (TÉLÉCOMMUNICATIONS ET RADIODIFFUSION) SUR LE MARCHÉ DE BUSWAY, PAR OFFRE, 2018-2033 (MILLIERS DE DOLLARS)
15.17.1 MATÉRIEL
15.17.2 SERVICE
15.18 TÉLÉCOMMUNICATIONS ET RADIODIFFUSION AUX ÉTATS-UNIS SUR LE MARCHÉ DES BUSWAYS, PAR TYPE DE MATÉRIEL, 2018-2033 (MILLIERS DE DOLLARS)
15.18.1 CENTRE DE DONNÉES
Ferme de serveurs 15.18.2
15.18.3 CENTRES D'OPÉRATIONS RÉSEAU (NOCS)
15.18.4 AUTRES
15.19 CENTRES DE DONNÉES AMÉRICAINS SUR LE MARCHÉ DE BUSWAY, PAR TYPE, 2018-2033 (MILLIERS DE DOLLARS)
15.19.1 UNITÉS DE DISTRIBUTION D'ÉNERGIE (PDUS)
15.19.2 VOIE PUBLIQUE FERMÉE À HAUTE RÉSISTANCE (CFW)
15.19.3 INSÉRER PAR AIR DANS LA VOIE PUBLIQUE (BMC)
15.19.4 BUSWAY À BOUCHON D'ISOLATION INTENSIF (CMC)
15.2 TÉLÉCOMMUNICATIONS ET RADIODIFFUSION AUX ÉTATS-UNIS SUR LE MARCHÉ DES BUSWAYS, PAR TYPE DE SERVICE, 2018-2033 (MILLIERS DE DOLLARS)
15.20.1 SERVICE GÉRÉ
15.20.2 SERVICE PROFESSIONNEL
15.21 SERVICES PROFESSIONNELS AMÉRICAINS SUR LE MARCHÉ DES BUSWAYS, PAR TYPE, 2018-2033 (MILLIERS DE DOLLARS USD)
15.21.1 INSTALLATION ET MISE EN SERVICE
15.21.2 FABRICATION SUR MESURE
15.21.3 CONCEPTION ET INGÉNIERIE
15.22 SERVICES GÉRÉS AMÉRICAINS SUR LE MARCHÉ DES BUSWAYS, PAR TYPE, 2018-2033 (MILLIERS DE DOLLARS USD)
15.22.1 ENTRETIEN ET RÉPARATIONS
15.22.2 SURVEILLANCE À DISTANCE ET MAINTENANCE PRÉDICTIVE
15.22.3 PRISE EN CHARGE DES MISES À NIVEAU ET DE L'EXTENSION
15.23 ÉNERGIE AMÉRICAINE SUR LE MARCHÉ DES BUSWAYS, PAR APPLICATION, 2018-2033 (MILLIERS DE DOLLARS USD)
15.23.1 CENTRE DE DONNÉES
Ferme de serveurs 15.23.2
15.23.3 CENTRES D'OPÉRATIONS RÉSEAU (NOCS)
15.23.4 AUTRES
15.24 ÉNERGIE AMÉRICAINE SUR LE MARCHÉ DES BUSWAYS, PAR OFFRE, 2018-2033 (MILLIERS DE DOLLARS USD)
15.24.1 MATÉRIEL
15.24.2 SERVICE
15.25 ÉNERGIE AMÉRICAINE SUR LE MARCHÉ DES BUSWAYS, PAR TYPE DE MATÉRIEL, 2018-2033 (MILLIERS DE DOLLARS USD)
15.25.1 CENTRE DE DONNÉES
Ferme de serveurs 15.25.2
15.25.3 CENTRES D'OPÉRATIONS RÉSEAU (NOCS)
15.25.4 AUTRES
15.26 CENTRES DE DONNÉES AMÉRICAINS SUR LE MARCHÉ DE BUSWAY, PAR TYPE, 2018-2033 (MILLIERS DE DOLLARS)
15.26.1 UNITÉS DE DISTRIBUTION D'ÉNERGIE (PDUS)
15.26.2 VOIE PUBLIQUE FERMÉE À HAUTE RÉSISTANCE (CFW)
15.26.3 INSÉRER LES GAINS PAR AIR (BMC)
15.26.4 BUSWAY À BOUCHON D'ISOLATION INTENSIVE (CMC)
15.27 ÉNERGIE AMÉRICAINE SUR LE MARCHÉ DES BUSWAYS, PAR TYPE DE SERVICE, 2018-2033 (MILLIERS DE DOLLARS USD)
15.27.1 SERVICE GÉRÉ
15.27.2 SERVICE PROFESSIONNEL
15.28 SERVICES PROFESSIONNELS AMÉRICAINS SUR LE MARCHÉ DES BUSWAYS, PAR TYPE, 2018-2033 (MILLIERS DE DOLLARS)
15.28.1 INSTALLATION ET MISE EN SERVICE
15.28.2 FABRICATION SUR MESURE
15.28.3 CONCEPTION ET INGÉNIERIE
15.29 SERVICES GÉRÉS AMÉRICAINS SUR LE MARCHÉ DES BUSWAY, PAR TYPE, 2018-2033 (MILLIERS DE DOLLARS USD)
15.29.1 ENTRETIEN ET RÉPARATIONS
15.29.2 SURVEILLANCE À DISTANCE ET MAINTENANCE PRÉDICTIVE
15.29.3 PRISE EN CHARGE DES MISES À NIVEAU ET DES EXTENSIONS
15.3 SOINS DE SANTÉ AMÉRICAINS SUR LE MARCHÉ DE BUSWAY, PAR DEMANDE, 2018-2033 (MILLIERS DE DOLLARS)
15.30.1 CENTRE DE DONNÉES
Ferme de serveurs 15.30.2
15.30.3 CENTRES D'OPÉRATIONS RÉSEAU (NOCS)
15.30.4 AUTRES
15.31 SOINS DE SANTÉ AMÉRICAINS SUR LE MARCHÉ DE BUSWAY, PAR OFFRE, 2018-2033 (MILLIERS DE DOLLARS)
15.31.1 MATÉRIEL
15.31.2 SERVICE
15.32 SOINS DE SANTÉ AUX ÉTATS-UNIS SUR LE MARCHÉ DE BUSWAY, PAR TYPE DE MATÉRIEL, 2018-2033 (MILLIERS DE DOLLARS)
15.32.1 CENTRE DE DONNÉES
Ferme de serveurs 15.32.2
15.32.3 CENTRES D'OPÉRATIONS RÉSEAU (NOCS)
15.32.4 AUTRES
15.33 CENTRES DE DONNÉES AMÉRICAINS SUR LE MARCHÉ DE BUSWAY, PAR TYPE, 2018-2033 (MILLIERS DE DOLLARS)
15.33.1 UNITÉS DE DISTRIBUTION D'ÉNERGIE (PDUS)
15.33.2 VOIE PUBLIQUE FERMÉE À HAUTE RÉSISTANCE (CFW)
15.33.3 INSÉRER PAR AIR DANS LA VOIE PUBLIQUE (BMC)
15.33.4 BUSWAY À BOUCHON D'ISOLATION INTENSIVE (CMC)
15.34 SOINS DE SANTÉ AUX ÉTATS-UNIS SUR LE MARCHÉ DE BUSWAY, PAR TYPE DE SERVICE, 2018-2033 (MILLIERS DE DOLLARS)
15.34.1 SERVICE GÉRÉ
15.34.2 SERVICE PROFESSIONNEL
15.35 SERVICES PROFESSIONNELS AMÉRICAINS SUR LE MARCHÉ DES BUSWAYS, PAR TYPE, 2018-2033 (MILLIERS DE DOLLARS)
15.35.1 INSTALLATION ET MISE EN SERVICE
15.35.2 FABRICATION SUR MESURE
15.35.3 CONCEPTION ET INGÉNIERIE
15.36 SERVICES GÉRÉS AMÉRICAINS SUR LE MARCHÉ DES BUSWAY, PAR TYPE, 2018-2033 (MILLIERS DE DOLLARS USD)
15.36.1 ENTRETIEN ET RÉPARATIONS
15.36.2 SURVEILLANCE À DISTANCE ET MAINTENANCE PRÉDICTIVE
15.36.3 PRISE EN CHARGE DES MISES À NIVEAU ET DE L'EXTENSION
15.37 TRANSPORTS AMÉRICAINS SUR LE MARCHÉ DES BUSWAYS, PAR DEMANDE, 2018-2033 (MILLIERS DE DOLLARS)
15.37.1 CENTRE DE DONNÉES
Ferme de serveurs 15.37.2
15.37.3 CENTRES D'OPÉRATIONS RÉSEAU (NOCS)
15.37.4 AUTRES
15.38 TRANSPORTS AMÉRICAINS SUR LE MARCHÉ DES BUSWAYS, PAR OFFRE, 2018-2033 (MILLIERS DE DOLLARS)
15.38.1 MATÉRIEL
15.38.2 SERVICE
15.39 TRANSPORTS AMÉRICAINS SUR LE MARCHÉ DES BUSWAYS, PAR TYPE DE MATÉRIEL, 2018-2033 (MILLIERS DE DOLLARS AMÉRICAINS)
15.39.1 CENTRE DE DONNÉES
Ferme de serveurs 15.39.2
15.39.3 CENTRES D'OPÉRATIONS RÉSEAU (NOCS)
15.39.4 AUTRES
15.4 CENTRES DE DONNÉES AMÉRICAINS SUR LE MARCHÉ DE BUSWAY, PAR TYPE, 2018-2033 (MILLIERS DE DOLLARS)
15.40.1 UNITÉS DE DISTRIBUTION D'ÉNERGIE (PDUS)
15.40.2 VOIE PUBLIQUE FERMÉE À HAUTE RÉSISTANCE (CFW)
15.40.3 INSÉRER PAR AIR DANS LA VOIE PUBLIQUE (BMC)
15.40.4 BUSWAY À BOUCHON D'ISOLATION INTENSIVE (CMC)
15.41 TRANSPORTS AMÉRICAINS SUR LE MARCHÉ DES BUSWAYS, PAR TYPE DE SERVICE, 2018-2033 (MILLIERS DE DOLLARS AMÉRICAINS)
15.41.1 SERVICE GÉRÉ
15.41.2 SERVICE PROFESSIONNEL
15.42 SERVICES PROFESSIONNELS AMÉRICAINS SUR LE MARCHÉ DES BUSWAYS, PAR TYPE, 2018-2033 (MILLIERS DE DOLLARS)
15.42.1 INSTALLATION ET MISE EN SERVICE
15.42.2 FABRICATION SUR MESURE
15.42.3 CONCEPTION ET INGÉNIERIE
15.43 SERVICES GÉRÉS AUX ÉTATS-UNIS SUR LE MARCHÉ DES BUSWAYS, PAR TYPE, 2018-2033 (MILLIERS DE DOLLARS AMÉRICAINS)
15.43.1 ENTRETIEN ET RÉPARATIONS
15.43.2 SURVEILLANCE À DISTANCE ET MAINTENANCE PRÉDICTIVE
15.43.3 PRISE EN CHARGE DES MISES À NIVEAU ET DES EXTENSIONS
15,44 LOGEMENTS RÉSIDENTIELS AMÉRICAINS DANS LE MARCHÉ DE BUSWAY, SUR DEMANDE, 2018-2033 (MILLIERS DE DOLLARS AMÉRICAINS)
15.44.1 RÉSIDENCES IMMOBILIÈRES
15.44.2 MAISONS INTELLIGENTES
15.44.3 RÉSIDENCES SÉCURISÉES
15.44.4 AUTRES
15,45 LOGEMENTS RÉSIDENTIELS AMÉRICAINS DANS LE MARCHÉ DE BUSWAY, PAR OFFRE, 2018-2033 (MILLIERS DE DOLLARS USD)
15.45.1 MATÉRIEL
15.45.2 SERVICE
15.46 RÉSIDENTIEL AMÉRICAIN DANS LE MARCHÉ DES BUSWAYS, PAR TYPE DE QUINCAILLERIE, 2018-2033 (MILLIERS DE DOLLARS)
15.46.1 CENTRE DE DONNÉES
Ferme de serveurs 15.46.2
15.46.3 CENTRES D'OPÉRATIONS DE RÉSEAU (NOCS)
15.46.4 AUTRES
15.47 CENTRES DE DONNÉES AMÉRICAINS SUR LE MARCHÉ DE BUSWAY, PAR TYPE, 2018-2033 (MILLIERS DE DOLLARS)
15.47.1 UNITÉS DE DISTRIBUTION D'ÉNERGIE (PDUS)
15.47.2 VOIE PUBLIQUE FERMÉE À HAUTE RÉSISTANCE (CFW)
15.47.3 INSÉRER PAR AIR DANS LA VOIE PUBLIQUE (BMC)
15.47.4 BUSWAY À BOUCHON D'ISOLATION INTENSIVE (CMC)
15,48 RÉSIDENTIEL AMÉRICAIN DANS LE MARCHÉ DES BUSWAYS, PAR TYPE DE SERVICE, 2018-2033 (MILLIERS DE DOLLARS AMÉRICAINS)
15.48.1 SERVICE GÉRÉ
15.48.2 SERVICE PROFESSIONNEL
15.49 SERVICES PROFESSIONNELS AMÉRICAINS SUR LE MARCHÉ DES BUSWAYS, PAR TYPE, 2018-2033 (MILLIERS DE DOLLARS)
15.49.1 INSTALLATION ET MISE EN SERVICE
15.49.2 FABRICATION SUR MESURE
15.49.3 CONCEPTION ET INGÉNIERIE
15.5 SERVICES GÉRÉS AMÉRICAINS SUR LE MARCHÉ DES BUSWAYS, PAR TYPE, 2018-2033 (MILLIERS DE DOLLARS USD)
15.50.1 1.78.2 ENTRETIEN ET RÉPARATIONS
15.50.2 1.78.3 SURVEILLANCE À DISTANCE ET MAINTENANCE PRÉDICTIVE
15.50.3 1.78.4 PRISE EN CHARGE DES MISES À NIVEAU ET DES EXTENSIONS
15,51 GOUVERNEMENT AMÉRICAIN ET ARMÉE SUR LE MARCHÉ DE BUSWAY, SUR DEMANDE, 2018-2033 (MILLIERS DE DOLLARS AMÉRICAINS)
15.51.1 CENTRE DE DONNÉES
Ferme de serveurs 15.51.2
15.51.3 CENTRES D'OPÉRATIONS RÉSEAU (NOCS)
15.51.4 AUTRES
15,52 GOUVERNEMENT AMÉRICAIN ET ARMÉE SUR LE MARCHÉ DE BUSWAY, PAR OFFRE, 2018-2033 (MILLIERS DE DOLLARS AMÉRICAINS)
15.52.1 MATÉRIEL
15.52.2 SERVICE
15.53 GOUVERNEMENT ET ARMÉE AMÉRICAINS SUR LE MARCHÉ DES BUSWAYS, PAR TYPE DE MATÉRIEL, 2018-2033 (MILLIERS DE DOLLARS AMÉRICAINS)
15.53.1 CENTRE DE DONNÉES
Ferme de serveurs 15.53.2
15.53.3 CENTRES D'OPÉRATIONS RÉSEAU (NOCS)
15.53.4 AUTRES
15.54 CENTRES DE DONNÉES AMÉRICAINS SUR LE MARCHÉ DE BUSWAY, PAR TYPE, 2018-2033 (MILLIERS DE DOLLARS)
15.54.1 UNITÉS DE DISTRIBUTION D'ÉNERGIE (PDUS)
15.54.2 VOIE PUBLIQUE FERMÉE À HAUTE RÉSISTANCE (CFW)
15.54.3 INSTALLATEUR À AIR POUR CHEMIN DE BUS (BMC)
15.54.4 BUSWAY À BOUCHON D'ISOLATION INTENSIF (CMC)
15.55 GOUVERNEMENT AMÉRICAIN ET ARMÉE SUR LE MARCHÉ DES BUSWAYS, PAR TYPE DE SERVICE, 2018-2033 (MILLIERS DE DOLLARS)
15.55.1 SERVICE GÉRÉ
15.55.2 SERVICE PROFESSIONNEL
15.56 SERVICES PROFESSIONNELS AMÉRICAINS SUR LE MARCHÉ DES BUSWAYS, PAR TYPE, 2018-2033 (MILLIERS DE DOLLARS)
15.56.1 INSTALLATION ET MISE EN SERVICE
15.56.2 FABRICATION SUR MESURE
15.56.3 CONCEPTION ET INGÉNIERIE
15.57 SERVICES GÉRÉS AMÉRICAINS SUR LE MARCHÉ DES BUSWAY, PAR TYPE, 2018-2033 (MILLIERS DE DOLLARS)
15.57.1 ENTRETIEN ET RÉPARATIONS
15.57.2 SURVEILLANCE À DISTANCE ET MAINTENANCE PRÉDICTIVE
15.57.3 PRISE EN CHARGE DES MISES À NIVEAU ET DES EXTENSIONS
15,58 ÉTABLISSEMENTS D'ENSEIGNEMENT AMÉRICAINS SUR LE MARCHÉ DE BUSWAY, PAR DEMANDE, 2018-2033 (MILLIERS DE DOLLARS)
15.58.1 CENTRE DE DONNÉES
Ferme de serveurs 15.58.2
15.58.3 CENTRES D'OPÉRATIONS RÉSEAU (NOCS)
15.58.4 AUTRES
15.59 ÉTABLISSEMENTS D'ENSEIGNEMENT AMÉRICAINS SUR LE MARCHÉ DE BUSWAY, PAR OFFRE, 2018-2033 (MILLIERS DE DOLLARS)
15.59.1 MATÉRIEL
15.59.2 SERVICE
15.6 ÉTABLISSEMENTS D'ENSEIGNEMENT AMÉRICAINS SUR LE MARCHÉ DES BUSWAYS, PAR TYPE DE MATÉRIEL, 2018-2033 (MILLIERS DE DOLLARS)
15.60.1 CENTRE DE DONNÉES
Ferme de serveurs 15.60.2
15.60.3 CENTRES D'OPÉRATIONS RÉSEAU (NOCS)
15.60.4 AUTRES
15.61 CENTRES DE DONNÉES AMÉRICAINS SUR LE MARCHÉ DE BUSWAY, PAR TYPE, 2018-2033 (MILLIERS DE DOLLARS)
15.61.1 UNITÉS DE DISTRIBUTION D'ÉNERGIE (PDUS)
15.61.2 VOIE PUBLIQUE FERMÉE À HAUTE RÉSISTANCE (CFW)
15.61.3 CHEMIN DE BUS À ÉPISSAGE AIR (BMC)
15.61.4 BUSWAY À BOUCHON D'ISOLATION INTENSIVE (CMC)
15.62 ÉTABLISSEMENTS D'ENSEIGNEMENT AMÉRICAINS SUR LE MARCHÉ DES BUSWAYS, PAR TYPE DE SERVICE, 2018-2033 (MILLIERS DE DOLLARS AMÉRICAINS)
15.62.1 SERVICE GÉRÉ
15.62.2 SERVICE PROFESSIONNEL
15,63 SERVICES PROFESSIONNELS AMÉRICAINS SUR LE MARCHÉ DES BUSWAYS, PAR TYPE, 2018-2033 (MILLIERS DE DOLLARS AMÉRICAINS)
15.63.1 INSTALLATION ET MISE EN SERVICE
15.63.2 FABRICATION SUR MESURE
15.63.3 CONCEPTION ET INGÉNIERIE
15,64 SERVICES GÉRÉS AMÉRICAINS SUR LE MARCHÉ DES BUSWAYS, PAR TYPE, 2018-2033 (MILLIERS DE DOLLARS USD)
15.64.1 ENTRETIEN ET RÉPARATIONS
15.64.2 SURVEILLANCE À DISTANCE ET MAINTENANCE PRÉDICTIVE
15.64.3 PRISE EN CHARGE DES MISES À NIVEAU ET DE L'EXTENSION
15,65 ÉTABLIS DE DIVERTISSEMENT ET DE SPORTS AMÉRICAINS DANS LE MARCHÉ DE BUSWAY, PAR DEMANDE, 2018-2033 (MILLIERS DE DOLLARS AMÉRICAINS)
15.65.1 CENTRE DE DONNÉES
Ferme de serveurs 15.65.2
15.65.3 CENTRES D'OPÉRATIONS RÉSEAU (NOCS)
15.65.4 AUTRES
15,66 SITES DE DIVERTISSEMENT ET DE SPORTS AMÉRICAINS DANS LE MARCHÉ DE BUSWAY, PAR OFFRE, 2018-2033 (MILLIERS DE DOLLARS)
15.66.1 MATÉRIEL
15.66.2 SERVICE
15,67 ÉTABLIS DE DIVERTISSEMENT ET DE SPORTS AMÉRICAINS DANS LE BUSWAY MARKET, PAR TYPE DE MATÉRIEL, 2018-2033 (MILLIERS DE DOLLARS)
15.67.1 CENTRE DE DONNÉES
Ferme de serveurs 15.67.2
15.67.3 CENTRES D'OPÉRATIONS DE RÉSEAU (NOCS)
15.67.4 AUTRES
15,68 CENTRES DE DONNÉES AMÉRICAINS SUR LE MARCHÉ DE BUSWAY, PAR TYPE, 2018-2033 (MILLIERS DE DOLLARS)
15.68.1 UNITÉS DE DISTRIBUTION D'ÉNERGIE (PDUS)
15.68.2 VOIE PUBLIQUE FERMÉE À HAUTE RÉSISTANCE (CFW)
15.68.3 CHEMIN DE BUS À ÉPISSAGE AIR (BMC)
15.68.4 BUSWAY À BOUCHON D'ISOLATION INTENSIF (CMC)
15,69 AUTRES ÉTATS-UNIS SUR LE MARCHÉ DES BUSWAYS, PAR TYPE DE SERVICE, 2018-2033 (MILLIERS DE DOLLARS AMÉRICAINS)
15.69.1 SERVICE GÉRÉ
15.69.2 SERVICE PROFESSIONNEL
15.7 SERVICES PROFESSIONNELS AMÉRICAINS SUR LE MARCHÉ DES BUSWAYS, PAR TYPE, 2018-2033 (MILLIERS DE DOLLARS AMÉRICAINS)
15.70.1 INSTALLATION ET MISE EN SERVICE
15.70.2 FABRICATION SUR MESURE
15.70.3 CONCEPTION ET INGÉNIERIE
15.71 SERVICES GÉRÉS AUX ÉTATS-UNIS SUR LE MARCHÉ DES BUSWAYS, PAR TYPE, 2018-2033 (MILLIERS DE DOLLARS AMÉRICAINS)
15.71.1 ENTRETIEN ET RÉPARATIONS
15.71.2 SURVEILLANCE À DISTANCE ET MAINTENANCE PRÉDICTIVE
15.71.3 PRISE EN CHARGE DES MISES À NIVEAU ET DES EXTENSIONS
15,72 AUTRES ÉTATS-UNIS SUR LE MARCHÉ DE BUSWAY, PAR OFFRE, 2018-2033 (MILLIERS DE DOLLARS)
15.72.1 MATÉRIEL
15.72.2 SERVICE
15,73 AUTRES FOURNISSEURS AMÉRICAINS SUR LE MARCHÉ DES BUSWAYS, PAR TYPE DE MATÉRIEL, 2018-2033 (MILLIERS DE DOLLARS)
15.73.1 CENTRE DE DONNÉES
Ferme de serveurs 15.73.2
15.73.3 CENTRES D'OPÉRATIONS RÉSEAU (NOCS)
15.73.4 AUTRES
15,74 CENTRES DE DONNÉES AMÉRICAINS SUR LE MARCHÉ DE BUSWAY, PAR TYPE, 2018-2033 (MILLIERS DE DOLLARS)
15.74.1 UNITÉS DE DISTRIBUTION D'ÉNERGIE (PDUS)
15.74.2 VOIE PUBLIQUE FERMÉE À HAUTE RÉSISTANCE (CFW)
15.74.3 CHEMIN DE BUS À ÉPISSAGE AIR (BMC)
15.74.4 BUSWAY À BOUCHON D'ISOLATION INTENSIVE (CMC)
15,75 AUTRES ÉTATS-UNIS SUR LE MARCHÉ DES BUSWAYS, PAR TYPE DE SERVICE, 2018-2033 (MILLIERS DE DOLLARS AMÉRICAINS)
15.75.1 SERVICE GÉRÉ
15.75.2 SERVICE PROFESSIONNEL
15,76 SERVICES PROFESSIONNELS AMÉRICAINS SUR LE MARCHÉ DES BUSWAYS, PAR TYPE, 2018-2033 (MILLIERS DE DOLLARS)
15.76.1 INSTALLATION ET MISE EN SERVICE
15.76.2 FABRICATION SUR MESURE
15.76.3 CONCEPTION ET INGÉNIERIE
15,77 SERVICES GÉRÉS AMÉRICAINS SUR LE MARCHÉ DES BUSWAY, PAR TYPE, 2018-2033 (MILLIERS DE DOLLARS)
15.77.1 ENTRETIEN ET RÉPARATIONS
15.77.2 SURVEILLANCE À DISTANCE ET MAINTENANCE PRÉDICTIVE
15.77.3 PRISE EN CHARGE DES MISES À NIVEAU ET DES EXTENSIONS
16 MARCHÉ DES BUS US, PAR CANAL DE DISTRIBUTION
16.1 APERÇU
16.2 INDIRECT
MARCHÉ INDIRECT AMÉRICAIN SUR LES BUSWAYS, PAR CANAL DE DISTRIBUTION, 2018-2033 (MILLIERS DE DOLLARS) 219
16.3 DISTRIBUTEURS / REVENDEURS
16.4 INTÉGRATEURS DE SYSTÈMES / EPCS
16.5 ENTREPRENEURS CLÉ EN MAIN
16.6 DIRECT
16,7 % DES VENTES DIRECTES AMÉRICAINES SUR LE MARCHÉ BUSWAY, PAR CANAL DE DISTRIBUTION, 2018-2033 (MILLIERS DE DOLLARS)
16.7.1 SITE WEB DE L'ENTREPRISE
16.7.2 PLATEFORMES DE COMMERCE ÉLECTRONIQUE
17 US BUSWAY MARKET, PAYSAGE DE L'ENTREPRISE
17.1 ANALYSE DES ACTIONS DE LA SOCIÉTÉ : É.-U.
18 ANALYSE SWOT
19 PROFILS D'ENTREPRISE
19.1 LEGRAND
19.1.1 APERÇU DE L'ENTREPRISE
19.1.2 ANALYSE DES REVENUS
19.1.3 PORTEFEUILLE DE PRODUITS
19.1.4 ÉVOLUTIONS RÉCENTES
19.2 SCHNEIDER ÉLECTRIQUE
19.2.1 APERÇU DE L'ENTREPRISE
19.2.2 ANALYSE DES REVENUS
19.2.3 PORTEFEUILLE DE PRODUITS
19.2.4 ÉVOLUTION RÉCENTE
19.3 VERTIV GROUP CORP.
19.3.1 APERÇU DE L'ENTREPRISE
19.3.2 ANALYSE DES REVENUS
19.3.3 PORTEFEUILLE DE PRODUITS
19.3.4 ÉVOLUTIONS RÉCENTES
19.4 SOLUTIONS D'ÉNERGIE DELTA
19.4.1 APERÇU DE L'ENTREPRISE
19.4.2 ANALYSE DES REVENUS
19.4.3 PORTEFEUILLE DE PRODUITS
19.4.4 ÉVOLUTION RÉCENTE
19,5 EATON
19.5.1 APERÇU DE L'ENTREPRISE
19.5.2 ANALYSE DES REVENUS
19.5.3 PORTEFEUILLE DE PRODUITS
19.5.4 ÉVOLUTION RÉCENTE
19,6 ABB
19.6.1 APERÇU DE L'ENTREPRISE
19.6.2 ANALYSE DES REVENUS
19.6.3 PORTEFEUILLE DE PRODUITS
19.6.4 ÉVOLUTIONS RÉCENTES
19.7 ANORD MARDIX
19.7.1 APERÇU DE L'ENTREPRISE
19.7.2 PORTEFEUILLE DE PRODUITS
19.7.3 ÉVOLUTION RÉCENTE
19.8 PRODUITS CHATSWORTH
19.8.1 APERÇU DE L'ENTREPRISE
19.8.2 PORTEFEUILLE DE PRODUITS
19.8.3 ÉVOLUTION RÉCENTE
19.9 EAE ÉLECTRIQUE
19.9.1 APERÇU DE L'ENTREPRISE
19.9.2 PORTEFEUILLE DE PRODUITS
19.9.3 ÉVOLUTION RÉCENTE
19.1 FURUKAWA ELECTRIC CO., LTD.
19.10.1 APERÇU DE L'ENTREPRISE
19.10.2 ANALYSE DES REVENUS
19.10.3 PORTEFEUILLE DE PRODUITS
19.10.4 DÉVELOPPEMENTS RÉCENTS
19.11 HONEYWELL INTERNATIONAL INC.
19.11.1 APERÇU DE L'ENTREPRISE
19.11.2 ANALYSE DES REVENUS
19.11.3 PORTEFEUILLE DE PRODUITS
19.11.4 DÉVELOPPEMENTS RÉCENTS
19.12 S CÂBLE ET SYSTÈME USA
19.12.1 APERÇU DE L'ENTREPRISE
19.12.2 PORTEFEUILLE DE PRODUITS
19.12.3 ÉVOLUTION RÉCENTE
19.13 MEGABARRE GROUP, LTD
19.13.1 APERÇU DE L'ENTREPRISE
19.13.2 PORTEFEUILLE DE PRODUITS
19.13.3 ÉVOLUTION RÉCENTE
19.14 PANDUIT CORP.
19.14.1 APERÇU DE L'ENTREPRISE
19.14.2 PORTEFEUILLE DE PRODUITS
19.14.3 ÉVOLUTION RÉCENTE
19.15 INDUSTRIES POWELL
19.15.1 APERÇU DE L'ENTREPRISE
19.15.2 1.1.4 ANALYSE DES REVENUS
19.15.3 PORTEFEUILLE DE PRODUITS
19.15.4 ÉVOLUTION RÉCENTE
19.16 RITTAL PVT. LTD
19.16.1 APERÇU DE L'ENTREPRISE
19.16.2 PORTEFEUILLE DE PRODUITS
19.16.3 ÉVOLUTION RÉCENTE
19.17 SEIMENS
19.17.1 APERÇU DE L'ENTREPRISE
19.17.2 ANALYSE DES REVENUS
19.17.3 PORTEFEUILLE DE PRODUITS
19.17.4 DÉVELOPPEMENTS RÉCENTS
19.18 STARLINE HOLDINGS, LLC.
19.18.1 APERÇU DE L'ENTREPRISE
19.18.2 PORTEFEUILLE DE PRODUITS
19.18.3 ÉVOLUTION RÉCENTE
19.19 USPWR
19.19.1 APERÇU DE L'ENTREPRISE
19.19.2 PORTEFEUILLE DE PRODUITS
19.19.3 ÉVOLUTION RÉCENTE
QUESTIONNAIRE 20
21 RAPPORTS CONNEXES
Liste des tableaux
TABLEAU 1 CADRE RÉGLEMENTAIRE
TABLEAU 2 MATRICE TECHNOLOGIQUE DES PRINCIPAUX ACTEURS DU MARCHÉ
TABLEAU 3 ANALYSE COMPARATIVE DES ENTREPRISES PRINCIPALES ACTEURS DU MARCHÉ
TABLEAU 4 MATRICE DES PLATEFORMES DE SERVICES DES ENTREPRISES POUR LES PRINCIPAUX ACTEURS DU MARCHÉ
TABLEAU 5 ANALYSE DES CAS D'UTILISATION
TABLEAU 6 MARCHÉ DES BUSWAYS AUX ÉTATS-UNIS, PAR OFFRE, 2018-2033 (MILLIERS DE DOLLARS USD)
TABLEAU 7 MATÉRIEL AMÉRICAIN SUR LE MARCHÉ DES BUSWAYS, PAR TYPE, 2018-2033 (MILLIERS DE DOLLARS USD)
TABLEAU 8 CENTRES DE DONNÉES AMÉRICAINS SUR LE MARCHÉ DE BUSWAY, PAR TYPE, 2018-2033 (MILLIERS DE DOLLARS USD)
TABLEAU 9 SERVICES AMÉRICAINS SUR LE MARCHÉ DES BUSWAYS, PAR TYPE, 2018-2033 (MILLIERS DE DOLLARS USD)
TABLEAU 10 SERVICES GÉRÉS AMÉRICAINS SUR LE MARCHÉ DES BUSWAYS, PAR TYPE, 2018-2033 (MILLIERS DE DOLLARS USD)
TABLEAU 11 SERVICES PROFESSIONNELS AMÉRICAINS SUR LE MARCHÉ DES BUSWAYS, PAR TYPE, 2018-2033 (MILLIERS DE DOLLARS USD)
TABLEAU 12 MARCHÉ DES BUSWAYS AUX ÉTATS-UNIS, PAR COMPOSANTES, 2018-2033 (MILLIERS DE DOLLARS AMÉRICAINS)
TABLEAU 13 MARCHÉ DES BUSWAYS AUX ÉTATS-UNIS / BUSWAY ÉLECTRIQUES, PAR MATÉRIAU CONDUCTEUR, 2018-2033 (MILLIERS DE DOLLARS AMÉRICAINS)
TABLEAU 14 ENCLOSIONS AMÉRICAINES SUR LE MARCHÉ DES BUSWAYS, PAR MATÉRIAU CONDUCTEUR, 2018-2033 (MILLIERS DE DOLLARS USD)
TABLEAU 15 UNITÉS DE DÉPOSE AMÉRICAINES SUR LE MARCHÉ DES BUSWAYS, PAR MATÉRIAU CONDUCTEUR, 2018-2033 (MILLIERS DE DOLLARS AMÉRICAINS)
TABLEAU 16 CONNECTEURS AMÉRICAINS SUR LE MARCHÉ DES BUSWAYS, PAR MATÉRIAU CONDUCTEUR, 2018-2033 (MILLIERS DE DOLLARS USD)
TABLEAU 17 SYSTÈMES DE MISE À LA TERRE AUX ÉTATS-UNIS SUR LE MARCHÉ DES BUSWAYS, PAR MATÉRIAU CONDUCTEUR, 2018-2033 (MILLIERS DE DOLLARS AMÉRICAINS)
TABLEAU 18 EMBOUTS ET ALIMENTS D'EXTRÉMITÉ AMÉRICAINS SUR LE MARCHÉ DES BUSWAYS, PAR MATÉRIAU CONDUCTEUR, 2018-2033 (MILLIERS DE DOLLARS USD)
TABLEAU 19 MARCHÉ DES BUSWAYS AUX ÉTATS-UNIS, PAR TYPE, 2018-2033 (MILLIERS DE DOLLARS AMÉRICAINS)
TABLEAU 20 MARCHÉ AMÉRICAIN DES BUSWAYS TRIPHASÉES À 4 FILS, PAR MÉTHODE DE MISE EN ŒUVRE, 2018-2033 (MILLIERS DE DOLLARS AMÉRICAINS)
TABLEAU 21 MARCHÉ AMÉRICAIN DES BUSWAYS TRIPHASÉES À 5 FILS, PAR MÉTHODE DE MISE EN ŒUVRE, 2018-2033 (MILLIERS DE DOLLARS AMÉRICAINS)
TABLEAU 22 AUTRES ÉTATS-UNIS SUR LE MARCHÉ DES BUSWAYS, PAR MÉTHODE DE MISE EN ŒUVRE, 2018-2033 (MILLIERS DE DOLLARS AMÉRICAINS)
TABLEAU 23 AUTRES ÉTATS-UNIS SUR LE MARCHÉ DES BUSWAYS, PAR MÉTHODE DE MISE EN ŒUVRE, 2018-2033 (MILLIERS DE DOLLARS AMÉRICAINS)
TABLEAU 24 MARCHÉ DES BUSWAYS AUX ÉTATS-UNIS, PAR ISOLATION, 2018-2033 (MILLIERS DE DOLLARS AMÉRICAINS)
TABLEAU 25 MARCHÉ AMÉRICAIN DES BUSWAYS, PAR MATÉRIAU CONDUCTEUR, 2018-2033 (MILLIERS DE DOLLARS AMÉRICAINS)
TABLEAU 26 MARCHÉ DES BUSWAYS AUX ÉTATS-UNIS, PAR TYPE DE PHASE, 2018-2033 (MILLIERS DE DOLLARS AMÉRICAINS)
TABLEAU 27 MARCHÉ DES BUSWAYS AUX ÉTATS-UNIS, PAR FONCTION, 2018-2033 (MILLIERS DE DOLLARS AMÉRICAINS)
TABLEAU 28 MARCHÉ DES BUSWAYS AUX ÉTATS-UNIS, PAR PUISSANCE, 2018-2033 (MILLIERS DE DOLLARS AMÉRICAINS)
TABLEAU 29 : BUSWAY DE PUISSANCE MOYENNE AUX ÉTATS-UNIS SUR LE MARCHÉ DES BUSWAYS, PAR PUISSANCE, 2018-2033 (MILLIERS DE DOLLARS AMÉRICAINS)
TABLEAU 30 : BUSWAY À FAIBLE PUISSANCE AUX ÉTATS-UNIS SUR LE MARCHÉ DES BUSWAY, PAR PUISSANCE, 2018-2033 (MILLIERS DE DOLLARS AMÉRICAINS)
TABLEAU 31 : BUSWAY À HAUTE PUISSANCE AUX ÉTATS-UNIS SUR LE MARCHÉ DES BUSWAY, PAR PUISSANCE, 2018-2033 (MILLIERS DE DOLLARS AMÉRICAINS)
TABLEAU 32 MARCHÉ DES BUSWAYS AUX ÉTATS-UNIS, PAR SECTEUR VERTICAL, 2018-2033 (MILLIERS DE DOLLARS AMÉRICAINS)
TABLEAU 33 INSTALLATIONS INDUSTRIELLES AMÉRICAINES SUR LE MARCHÉ DES BUSWAYS, PAR APPLICATION, 2018-2033 (MILLIERS DE DOLLARS USD)
TABLEAU 34 INSTALLATIONS INDUSTRIELLES AMÉRICAINES SUR LE MARCHÉ DE BUSWAY, PAR OFFRE, 2018-2033 (MILLIERS DE DOLLARS USD)
TABLEAU 35 INSTALLATIONS INDUSTRIELLES AMÉRICAINES SUR LE MARCHÉ DES BUSWAYS, PAR TYPE DE MATÉRIEL, 2018-2033 (MILLIERS DE DOLLARS USD)
TABLEAU 36 CENTRES DE DONNÉES AMÉRICAINS SUR LE MARCHÉ DE BUSWAY, PAR TYPE, 2018-2033 (MILLIERS DE DOLLARS USD)
TABLEAU 37 INSTALLATIONS INDUSTRIELLES AMÉRICAINES SUR LE MARCHÉ DES BUSWAYS, PAR TYPE DE SERVICE, 2018-2033 (MILLIERS DE DOLLARS USD)
TABLEAU 38 SERVICES PROFESSIONNELS AMÉRICAINS SUR LE MARCHÉ DES BUSWAYS, PAR TYPE, 2018-2033 (MILLIERS DE DOLLARS USD)
TABLEAU 39 SERVICES GÉRÉS AMÉRICAINS SUR LE MARCHÉ DES BUSWAYS, PAR TYPE, 2018-2033 (MILLIERS DE DOLLARS USD)
TABLEAU 40 BÂTIMENTS COMMERCIAUX AMÉRICAINS DANS LE MARCHÉ DE BUSWAY, PAR APPLICATION, 2018-2033 (MILLIERS DE DOLLARS USD)
TABLEAU 41 BÂTIMENTS COMMERCIAUX AMÉRICAINS SUR LE MARCHÉ DE BUSWAY, PAR OFFRE, 2018-2033 (MILLIERS DE DOLLARS USD)
TABLEAU 42 BÂTIMENTS COMMERCIAUX AMÉRICAINS DANS LE MARCHÉ DES BUSWAYS, PAR TYPE DE QUINCAILLERIE, 2018-2033 (MILLIERS DE DOLLARS AMÉRICAINS)
TABLEAU 43 CENTRES DE DONNÉES AMÉRICAINS SUR LE MARCHÉ DE BUSWAY, PAR TYPE, 2018-2033 (MILLIERS DE DOLLARS USD)
TABLEAU 44 BÂTIMENTS COMMERCIAUX AMÉRICAINS DANS LE MARCHÉ DES BUSWAYS, PAR TYPE DE SERVICE, 2018-2033 (MILLIERS DE DOLLARS USD)
TABLEAU 45 SERVICES PROFESSIONNELS AMÉRICAINS SUR LE MARCHÉ DES BUSWAYS, PAR TYPE, 2018-2033 (MILLIERS DE DOLLARS USD)
TABLEAU 46 TABLEAU 42 SERVICES GÉRÉS AMÉRICAINS SUR LE MARCHÉ DES BUSWAYS, PAR TYPE, 2018-2033 (MILLIERS DE DOLLARS USD)
TABLEAU 47 TÉLÉCOMMUNICATIONS ET RADIODIFFUSION AUX ÉTATS-UNIS SUR LE MARCHÉ DES BUSWAYS, PAR APPLICATION, 2018-2033 (MILLIERS DE DOLLARS)
TABLEAU 48 TÉLÉCOMMUNICATIONS ET RADIODIFFUSION AUX ÉTATS-UNIS SUR LE MARCHÉ DE BUSWAY, PAR OFFRE, 2018-2033 (MILLIERS DE DOLLARS)
TABLEAU 49 TÉLÉCOMMUNICATIONS ET RADIODIFFUSION AUX ÉTATS-UNIS SUR LE MARCHÉ DES BUSWAYS, PAR TYPE DE MATÉRIEL, 2018-2033 (MILLIERS DE DOLLARS)
TABLEAU 50 CENTRES DE DONNÉES AMÉRICAINS SUR LE MARCHÉ DE BUSWAY, PAR TYPE, 2018-2033 (MILLIERS DE DOLLARS USD)
TABLEAU 51 TÉLÉCOMMUNICATIONS ET RADIODIFFUSION AUX ÉTATS-UNIS SUR LE MARCHÉ DES BUSWAYS, PAR TYPE DE SERVICE, 2018-2033 (MILLIERS DE DOLLARS)
TABLEAU 52 SERVICES PROFESSIONNELS AMÉRICAINS SUR LE MARCHÉ DES BUSWAYS, PAR TYPE, 2018-2033 (MILLIERS DE DOLLARS USD)
TABLEAU 53 SERVICES GÉRÉS AMÉRICAINS SUR LE MARCHÉ DES BUSWAYS, PAR TYPE, 2018-2033 (MILLIERS DE DOLLARS USD)
TABLEAU 54 ÉNERGIE AMÉRICAINE SUR LE MARCHÉ DES BUSWAYS, PAR APPLICATION, 2018-2033 (MILLIERS DE DOLLARS USD)
TABLEAU 55 ÉNERGIE AMÉRICAINE SUR LE MARCHÉ DES BUSWAYS, PAR OFFRE, 2018-2033 (MILLIERS DE DOLLARS USD)
TABLEAU 56 ÉNERGIE AMÉRICAINE SUR LE MARCHÉ DES BUSWAYS, PAR TYPE DE MATÉRIEL, 2018-2033 (MILLIERS DE DOLLARS USD)
TABLEAU 57 CENTRES DE DONNÉES AMÉRICAINS SUR LE MARCHÉ DE BUSWAY, PAR TYPE, 2018-2033 (MILLIERS DE DOLLARS USD)
TABLEAU 58 ÉNERGIE AMÉRICAINE SUR LE MARCHÉ DES BUSWAYS, PAR TYPE DE SERVICE, 2018-2033 (MILLIERS DE DOLLARS USD)
TABLEAU 59 SERVICES PROFESSIONNELS AMÉRICAINS SUR LE MARCHÉ DES BUSWAYS, PAR TYPE, 2018-2033 (MILLIERS DE DOLLARS USD)
TABLEAU 60 SERVICES GÉRÉS AMÉRICAINS SUR LE MARCHÉ DES BUSWAYS, PAR TYPE, 2018-2033 (MILLIERS DE DOLLARS USD)
TABLEAU 61 SOINS DE SANTÉ AUX ÉTATS-UNIS SUR LE MARCHÉ DE BUSWAY, PAR APPLICATION, 2018-2033 (MILLIERS DE DOLLARS AMÉRICAINS)
TABLEAU 62 SOINS DE SANTÉ AMÉRICAINS SUR LE MARCHÉ DE BUSWAY, PAR OFFRE, 2018-2033 (MILLIERS DE DOLLARS USD)
TABLEAU 63 SOINS DE SANTÉ AUX ÉTATS-UNIS SUR LE MARCHÉ DE BUSWAY, PAR TYPE DE MATÉRIEL, 2018-2033 (MILLIERS DE DOLLARS AMÉRICAINS)
TABLEAU 64 CENTRES DE DONNÉES AMÉRICAINS SUR LE MARCHÉ DE BUSWAY, PAR TYPE, 2018-2033 (MILLIERS DE DOLLARS USD)
TABLEAU 65 SOINS DE SANTÉ AUX ÉTATS-UNIS SUR LE MARCHÉ DE BUSWAY, PAR TYPE DE SERVICE, 2018-2033 (MILLIERS DE DOLLARS AMÉRICAINS)
TABLEAU 66 SERVICES PROFESSIONNELS AMÉRICAINS SUR LE MARCHÉ DES BUSWAYS, PAR TYPE, 2018-2033 (MILLIERS DE DOLLARS USD)
TABLEAU 67 SERVICES GÉRÉS AMÉRICAINS SUR LE MARCHÉ DES BUSWAYS, PAR TYPE, 2018-2033 (MILLIERS DE DOLLARS USD)
TABLEAU 68 TRANSPORTS AMÉRICAINS SUR LE MARCHÉ DES BUSWAYS, PAR APPLICATION, 2018-2033 (MILLIERS DE DOLLARS AMÉRICAINS)
TABLEAU 69 TRANSPORTS AMÉRICAINS SUR LE MARCHÉ DES BUSWAYS, PAR OFFRE, 2018-2033 (MILLIERS DE DOLLARS USD)
TABLEAU 70 TRANSPORTS AMÉRICAINS SUR LE MARCHÉ DES BUSWAYS, PAR TYPE DE MATÉRIEL, 2018-2033 (MILLIERS DE DOLLARS AMÉRICAINS)
TABLEAU 71 CENTRES DE DONNÉES AMÉRICAINS SUR LE MARCHÉ DE BUSWAY, PAR TYPE, 2018-2033 (MILLIERS DE DOLLARS USD)
TABLEAU 72 TRANSPORTS AMÉRICAINS SUR LE MARCHÉ DES BUSWAYS, PAR TYPE DE SERVICE, 2018-2033 (MILLIERS DE DOLLARS AMÉRICAINS)
TABLEAU 73 SERVICES PROFESSIONNELS AMÉRICAINS SUR LE MARCHÉ DES BUSWAYS, PAR TYPE, 2018-2033 (MILLIERS DE DOLLARS USD)
TABLEAU 74 SERVICES GÉRÉS AMÉRICAINS SUR LE MARCHÉ DES BUSWAYS, PAR TYPE, 2018-2033 (MILLIERS DE DOLLARS USD)
TABLEAU 75 LOGEMENTS RÉSIDENTIELS AMÉRICAINS DANS LE MARCHÉ DE BUSWAY, PAR APPLICATION, 2018-2033 (MILLIERS DE DOLLARS USD)
TABLEAU 76 LOGEMENTS RÉSIDENTIELS AMÉRICAINS SUR LE MARCHÉ DE BUSWAY, PAR OFFRE, 2018-2033 (MILLIERS DE DOLLARS USD)
TABLEAU 77 MARCHÉ RÉSIDENTIEL AMÉRICAIN DANS LES BUSWAYS, PAR TYPE DE QUINCAILLERIE, 2018-2033 (MILLIERS DE DOLLARS AMÉRICAINS)
TABLEAU 78 CENTRES DE DONNÉES AMÉRICAINS SUR LE MARCHÉ DE BUSWAY, PAR TYPE, 2018-2033 (MILLIERS DE DOLLARS USD)
TABLEAU 79 RÉSIDENTIEL AMÉRICAIN DANS LE MARCHÉ DES BUSWAYS, PAR TYPE DE SERVICE, 2018-2033 (MILLIERS DE DOLLARS AMÉRICAINS)
TABLEAU 80 SERVICES PROFESSIONNELS AMÉRICAINS SUR LE MARCHÉ DES BUSWAYS, PAR TYPE, 2018-2033 (MILLIERS DE DOLLARS USD)
TABLEAU 81 SERVICES GÉRÉS AMÉRICAINS SUR LE MARCHÉ DES BUSWAYS, PAR TYPE, 2018-2033 (MILLIERS DE DOLLARS USD)
TABLEAU 82 GOUVERNEMENT ET ARMÉE AMÉRICAINS SUR LE MARCHÉ DES BUSWAYS, PAR APPLICATION, 2018-2033 (MILLIERS DE DOLLARS AMÉRICAINS)
TABLEAU 83 GOUVERNEMENT ET ARMÉE AMÉRICAINS SUR LE MARCHÉ DES BUSWAYS, PAR OFFRE, 2018-2033 (MILLIERS DE DOLLARS AMÉRICAINS)
TABLEAU 84 GOUVERNEMENT ET ARMÉE AMÉRICAINS SUR LE MARCHÉ DES BUSWAYS, PAR TYPE DE MATÉRIEL, 2018-2033 (MILLIERS DE DOLLARS AMÉRICAINS)
TABLEAU 85 CENTRES DE DONNÉES AMÉRICAINS SUR LE MARCHÉ DE BUSWAY, PAR TYPE, 2018-2033 (MILLIERS DE DOLLARS USD)
TABLEAU 86 GOUVERNEMENT ET ARMÉE AMÉRICAINS SUR LE MARCHÉ DES BUSWAYS, PAR TYPE DE SERVICE, 2018-2033 (MILLIERS DE DOLLARS AMÉRICAINS)
TABLEAU 87 SERVICES PROFESSIONNELS AMÉRICAINS SUR LE MARCHÉ DES BUSWAYS, PAR TYPE, 2018-2033 (MILLIERS DE DOLLARS USD)
TABLEAU 88 SERVICES GÉRÉS AMÉRICAINS SUR LE MARCHÉ DES BUSWAYS, PAR TYPE, 2018-2033 (MILLIERS DE DOLLARS USD)
TABLEAU 89 ÉTABLISSEMENTS D'ENSEIGNEMENT AMÉRICAINS SUR LE MARCHÉ DE BUSWAY, PAR APPLICATION, 2018-2033 (MILLIERS DE DOLLARS USD)
TABLEAU 90 ÉTABLISSEMENTS D'ENSEIGNEMENT AMÉRICAINS SUR LE MARCHÉ DE BUSWAY, PAR OFFRE, 2018-2033 (MILLIERS DE DOLLARS USD)
TABLEAU 91 ÉTABLISSEMENTS D'ENSEIGNEMENT AMÉRICAINS SUR LE MARCHÉ DES BUSWAYS, PAR TYPE DE MATÉRIEL, 2018-2033 (MILLIERS DE DOLLARS AMÉRICAINS)
TABLEAU 92 CENTRES DE DONNÉES AMÉRICAINS SUR LE MARCHÉ DE BUSWAY, PAR TYPE, 2018-2033 (MILLIERS DE DOLLARS USD)
TABLEAU 93 ÉTABLISSEMENTS D'ENSEIGNEMENT AMÉRICAINS SUR LE MARCHÉ DES BUSWAYS, PAR TYPE DE SERVICE, 2018-2033 (MILLIERS DE DOLLARS USD)
TABLEAU 94 SERVICES PROFESSIONNELS AMÉRICAINS SUR LE MARCHÉ DES BUSWAYS, PAR TYPE, 2018-2033 (MILLIERS DE DOLLARS USD)
TABLEAU 95 SERVICES GÉRÉS AMÉRICAINS SUR LE MARCHÉ DES BUSWAYS, PAR TYPE, 2018-2033 (MILLIERS DE DOLLARS USD)
TABLEAU 96 SITES DE DIVERTISSEMENT ET DE SPORTS AMÉRICAINS DANS LE BUSWAY MARKET, PAR DEMANDE, 2018-2033 (MILLIERS DE DOLLARS)
TABLEAU 97 SITES DE DIVERTISSEMENT ET DE SPORTS AMÉRICAINS SUR LE MARCHÉ DE BUSWAY, PAR OFFRE, 2018-2033 (MILLIERS DE DOLLARS)
TABLEAU 98 SITES DE DIVERTISSEMENT ET DE SPORTS AMÉRICAINS DANS LE MARCHÉ DE BUSWAY, PAR TYPE DE MATÉRIEL, 2018-2033 (MILLIERS DE DOLLARS AMÉRICAINS)
TABLEAU 99 CENTRES DE DONNÉES AMÉRICAINS SUR LE MARCHÉ DE BUSWAY, PAR TYPE, 2018-2033 (MILLIERS DE DOLLARS USD)
TABLEAU 100 AUTRES AMÉRICAINS SUR LE MARCHÉ DES BUSWAYS, PAR TYPE DE SERVICE, 2018-2033 (MILLIERS DE DOLLARS USD)
TABLEAU 101 SERVICES PROFESSIONNELS AMÉRICAINS SUR LE MARCHÉ DES BUSWAYS, PAR TYPE, 2018-2033 (MILLIERS DE DOLLARS USD)
TABLEAU 102 SERVICES GÉRÉS AMÉRICAINS SUR LE MARCHÉ DES BUSWAYS, PAR TYPE, 2018-2033 (MILLIERS DE DOLLARS USD)
TABLEAU 103 AUTRES AMÉRICAINS SUR LE MARCHÉ DE BUSWAY, PAR OFFRE, 2018-2033 (MILLIERS DE DOLLARS USD)
TABLEAU 104 AUTRES AMÉRICAINS SUR LE MARCHÉ DES BUSWAYS, PAR TYPE DE MATÉRIEL, 2018-2033 (MILLIERS DE DOLLARS USD)
TABLEAU 105 CENTRES DE DONNÉES AMÉRICAINS SUR LE MARCHÉ DE BUSWAY, PAR TYPE, 2018-2033 (MILLIERS DE DOLLARS USD)
TABLEAU 106 AUTRES ENTREPRISES AMÉRICAINES SUR LE MARCHÉ DES BUSWAYS, PAR TYPE DE SERVICE, 2018-2033 (MILLIERS DE DOLLARS USD)
TABLEAU 107 SERVICES PROFESSIONNELS AMÉRICAINS SUR LE MARCHÉ DES BUSWAYS, PAR TYPE, 2018-2033 (MILLIERS DE DOLLARS USD)
TABLEAU 108 SERVICES GÉRÉS AMÉRICAINS SUR LE MARCHÉ DES BUSWAYS, PAR TYPE, 2018-2033 (MILLIERS DE DOLLARS USD)
TABLEAU 109 MARCHÉ DES BUSWAYS AUX ÉTATS-UNIS, PAR CANAL DE DISTRIBUTION, 2018-2033 (MILLIERS DE DOLLARS AMÉRICAINS)
TABLEAU 110 MARCHÉ INDIRECT AMÉRICAIN DANS LES BUSWAYS, PAR CANAL DE DISTRIBUTION, 2018-2033 (MILLIERS DE DOLLARS AMÉRICAINS)
TABLEAU 111 DES VENTES DIRECTES AMÉRICAINES SUR LE MARCHÉ BUSWAY, PAR CANAL DE DISTRIBUTION, 2018-2033 (MILLIERS DE DOLLARS USD)
Liste des figures
FIGURE 1 MARCHÉ DES BUSWAYS AUX ÉTATS-UNIS : SEGMENTATION
FIGURE 2 MARCHÉ DES BUSWAYS AMÉRICAINS : TRIANGULATION DES DONNÉES
FIGURE 3 MARCHÉ DES BUSWAYS AMÉRICAINS : ANALYSE DROC
FIGURE 4 MARCHÉ DES BUSWAYS AUX ÉTATS-UNIS : ANALYSE DU MARCHÉ PAR PAYS
FIGURE 5 MARCHÉ DES BUSWAYS AUX ÉTATS-UNIS : ANALYSE DE RECHERCHE SUR LES ENTREPRISES
FIGURE 6 MARCHÉ DES BUSWAYS AMÉRICAINS : DONNÉES DÉMOGRAPHIQUES ISSUES D'ENTRETIENS
FIGURE 7 MARCHÉ DES BUSWAYS AMÉRICAINS : GRILLE DE POSITIONNEMENT DU MARCHÉ DBMR
FIGURE 8 MARCHÉ DES BUSWAYS AUX ÉTATS-UNIS : ANALYSE DES PARTS DE MARCHÉ DES FOURNISSEURS
FIGURE 9 MARCHÉ DES BUSWAYS AUX ÉTATS-UNIS : MODÉLISATION MULTIVARIÉE
FIGURE 10 MARCHÉ DES BUSWAYS AMÉRICAINS : COURBE TEMPORELLE DES TYPES
FIGURE 11 MARCHÉ DES BUSWAYS AUX ÉTATS-UNIS : GRILLE DE COUVERTURE VERTICALE
FIGURE 12 MARCHÉ DES BUSWAYS AUX ÉTATS-UNIS : SEGMENTATION
FIGURE 13 LE MARCHÉ AMÉRICAIN DES BUSWAYS SE COMPOSE EN DEUX SEGMENTS, PAR OFFRE (2025)
FIGURE 14 MARCHÉ DES BUSWAYS AMÉRICAINS : SYNTHÈSE
FIGURE 15 DÉCISIONS STRATÉGIQUES
FIGURE 16 L'URBANISATION RAPIDE ET LES PROJETS D'INFRASTRUCTURE À GRANDE ÉCHELLE DEVRAIENT STIMULER LE MARCHÉ DES BUSWAYS AUX ÉTATS-UNIS AU COURS DE LA PÉRIODE DE PRÉVISION DE 2026 À 2033
FIGURE 17 : LE MATÉRIEL DEVRAIT REPRÉSENTER LA PLUS GRANDE PART DU MARCHÉ AMÉRICAIN DES BUSWAYS EN 2026 ET 2033
FIGURE 18 ANALYSE DROC
FIGURE 19 MARCHÉ DES BUSWAYS AUX ÉTATS-UNIS : PAR OFFRE, 2025
FIGURE 20 MARCHÉ DES BUSWAYS AUX ÉTATS-UNIS : PAR COMPOSANTS, 2025
FIGURE 21 MARCHÉ DES BUSWAYS AUX ÉTATS-UNIS : PAR TYPE, 2025
FIGURE 22 MARCHÉ DES BUSWAYS AUX ÉTATS-UNIS : PAR MISE EN ŒUVRE, 2025
FIGURE 23 MARCHÉ DES BUSWAYS AUX ÉTATS-UNIS : PAR ISOLATION, 2025
FIGURE 24 MARCHÉ DES BUSWAYS AUX ÉTATS-UNIS : PAR MATÉRIAU CONDUCTEUR, 2025
FIGURE 25 MARCHÉ DES BUSWAYS AUX ÉTATS-UNIS : PAR TYPE DE PHASE, 2025
FIGURE 26 MARCHÉ DES BUSWAYS AUX ÉTATS-UNIS : PAR FONCTION, 2025
FIGURE 27 MARCHÉ DES BUSWAYS AUX ÉTATS-UNIS : PAR PUISSANCE, 2025
FIGURE 28 MARCHÉ DES BUSWAYS AUX ÉTATS-UNIS : PAR VERTICAL, 2025
FIGURE 29 MARCHÉ DES BUSWAYS AUX ÉTATS-UNIS : PAR CANAL DE DISTRIBUTION, 2025
FIGURE 30 MARCHÉ DES BUSWAYS AUX ÉTATS-UNIS : PART DE MARCHÉ DES ENTREPRISES 2025 (%)
Méthodologie de recherche
La collecte de données et l'analyse de l'année de base sont effectuées à l'aide de modules de collecte de données avec des échantillons de grande taille. L'étape consiste à obtenir des informations sur le marché ou des données connexes via diverses sources et stratégies. Elle comprend l'examen et la planification à l'avance de toutes les données acquises dans le passé. Elle englobe également l'examen des incohérences d'informations observées dans différentes sources d'informations. Les données de marché sont analysées et estimées à l'aide de modèles statistiques et cohérents de marché. De plus, l'analyse des parts de marché et l'analyse des tendances clés sont les principaux facteurs de succès du rapport de marché. Pour en savoir plus, veuillez demander un appel d'analyste ou déposer votre demande.
La méthodologie de recherche clé utilisée par l'équipe de recherche DBMR est la triangulation des données qui implique l'exploration de données, l'analyse de l'impact des variables de données sur le marché et la validation primaire (expert du secteur). Les modèles de données incluent la grille de positionnement des fournisseurs, l'analyse de la chronologie du marché, l'aperçu et le guide du marché, la grille de positionnement des entreprises, l'analyse des brevets, l'analyse des prix, l'analyse des parts de marché des entreprises, les normes de mesure, l'analyse globale par rapport à l'analyse régionale et des parts des fournisseurs. Pour en savoir plus sur la méthodologie de recherche, envoyez une demande pour parler à nos experts du secteur.
Personnalisation disponible
Data Bridge Market Research est un leader de la recherche formative avancée. Nous sommes fiers de fournir à nos clients existants et nouveaux des données et des analyses qui correspondent à leurs objectifs. Le rapport peut être personnalisé pour inclure une analyse des tendances des prix des marques cibles, une compréhension du marché pour d'autres pays (demandez la liste des pays), des données sur les résultats des essais cliniques, une revue de la littérature, une analyse du marché des produits remis à neuf et de la base de produits. L'analyse du marché des concurrents cibles peut être analysée à partir d'une analyse basée sur la technologie jusqu'à des stratégies de portefeuille de marché. Nous pouvons ajouter autant de concurrents que vous le souhaitez, dans le format et le style de données que vous recherchez. Notre équipe d'analystes peut également vous fournir des données sous forme de fichiers Excel bruts, de tableaux croisés dynamiques (Fact book) ou peut vous aider à créer des présentations à partir des ensembles de données disponibles dans le rapport.

