グローバルグラフデータベース市場規模、シェア、トレンド分析レポート
Market Size in USD Billion
CAGR :
% 
 USD
2.70 Billion
USD
10.28 Billion
2024
2032
USD
2.70 Billion
USD
10.28 Billion
2024
2032
| 2025 –2032 | |
| USD 2.70 Billion | |
| USD 10.28 Billion | |
| % | |
|
グローバルグラフデータベース市場のセグメンテーション、タイプ別(リソース記述フレームワーク(RDF)およびラベル付きプロパティグラフ(LPG))、アプリケーション別(不正検出、防止、および推奨エンジン)、データベース別(リレーショナル(SQL)および非リレーショナル(NoSQL))、導入モデル別(オンプレミスおよびクラウド)、分析タイプ別(パス分析、接続性分析、コミュニティ分析、および中心性分析)、規模別(大企業、中小企業)、コンポーネント別(ソフトウェアおよびサービス)、エンドユーザー別(銀行、金融サービスおよび保険、通信およびIT、ヘルスケアおよびライフサイエンス、運輸および物流、小売および電子商取引、エネルギーおよび公益事業、政府および公共、製造、およびその他) - 2032年までの業界動向および予測
グラフデータベース市場規模
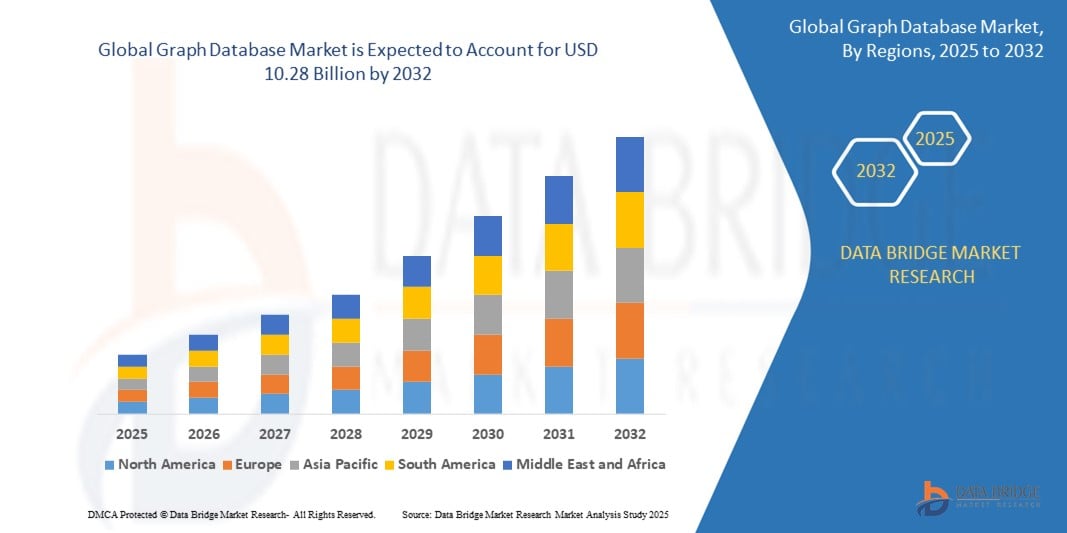
- 世界のグラフデータベース市場規模は2024年に27億米ドルと評価され、予測期間中に18.20%のCAGRで成長し、2032年には102億8000万米ドルに達すると予想されています。
- 市場の成長は、BFSI、通信、電子商取引などの分野でリアルタイムデータ分析、不正検出、推奨エンジン用のグラフデータベースの採用が増加していることに大きく起因しています。
- さらに、企業データの複雑さが増し、隠れた関係性を明らかにするスケーラブルで高性能なソリューションに対する需要が高まっているため、グラフデータベースは現代のデータインフラストラクチャにとって重要なツールとして位置付けられ、市場拡大が大幅に加速しています。
グラフデータベース市場分析
- 関係性に基づいてデータを保存、管理、クエリするように設計されたグラフデータベースは、不正検出、推奨システム、ネットワーク分析などのさまざまなアプリケーションにわたる高度に接続された複雑なデータセットから洞察を導き出すことを目指す企業にとって不可欠になりつつあります。
- グラフデータベースの需要の高まりは、主にリアルタイム分析のニーズの高まり、AIと機械学習の採用の増加、そして業界全体で生成される非構造化データと半構造化データの増加によって推進されています。
- 北米は、高度な分析ツールの早期導入、AIと機械学習への強力な投資、BFSI、ヘルスケア、ITなどの業界におけるリアルタイムデータ処理の需要の高まりにより、2024年にはグラフデータベース市場の42.5%のシェアを獲得して市場を支配しました。
- アジア太平洋地域は、企業のデジタル化の進展、政府支援によるスマートシティの取り組み、中国、インド、日本、韓国などの経済圏における急速なクラウド導入により、予測期間中にグラフデータベース市場で最も急速に成長する地域になると予想されています。
- 2024年には、スケーラブルでコスト効率が高く、メンテナンスフリーの導入オプションへの需要が高まり、クラウドセグメントが市場を席巻しました。クラウドベースのグラフデータベースは、オンデマンドのパフォーマンス、他のクラウドサービスとの簡素化された統合、そしてグローバルなアクセス性を提供し、分散型チームや最新のアプリケーション開発に最適です。
レポートの範囲とグラフデータベース市場セグメンテーション
|
属性 |
グラフデータベースの主要市場インサイト |
|
対象セグメント |
|
|
対象国 |
北米
ヨーロッパ
アジア太平洋
中東およびアフリカ
南アメリカ
|
|
主要な市場プレーヤー |
|
|
市場機会 |
|
|
付加価値データ情報セット |
データブリッジ市場調査チームがまとめた市場レポートには、市場価値、成長率、市場セグメント、地理的範囲、市場プレーヤー、市場シナリオなどの市場洞察に加えて、専門家による詳細な分析、輸入/輸出分析、価格分析、生産消費分析、乳棒分析が含まれています。 |
グラフデータベース市場の動向
「クラウドベースのグラフデータベースの採用拡大」
- 世界のグラフデータベース市場における重要かつ加速的なトレンドは、クラウドベースの導入モデルの採用の増加であり、分散データ環境全体での拡張性、柔軟性、リアルタイムのコラボレーションの向上を可能にしています。
- 例えば、AWSのフルマネージドグラフデータベースサービスであるAmazon Neptuneは、RDFとプロパティグラフの両方のモデルをサポートしており、ナレッジグラフや不正検出に広く利用されています。同様に、MicrosoftのAzure Cosmos DBはGremlin APIをネイティブサポートしており、クラウド上でスケーラブルなグラフデータベースソリューションを実現します。
- クラウドベースのグラフデータベースにより、組織はインフラストラクチャのオーバーヘッドを最小限に抑えながら、膨大な量の接続データを管理できます。これにより、導入が迅速化され、既存のクラウドネイティブサービスとの統合が容易になります。Google CloudとNeo4j AuraDBの統合により、ユーザーはバックエンドシステムを管理することなく、高度な分析エンジンやレコメンデーションエンジンを構築できます。
- これらのプラットフォームは、コスト効率の高いオンデマンド環境で関係中心のデータモデリングを活用することで、アイデンティティアクセス管理、リアルタイムの不正分析、パーソナライズされたコンテンツ配信などのユースケースをサポートします。
- クラウドネイティブのグラフソリューションへの移行は、企業が複雑なデータから洞察を引き出す方法を根本的に変革しています。Neo4jやTigerGraphなどの企業は、BFSI、通信、小売などの業界からの高まる需要に応えるため、クラウドサービスを積極的に拡大しています。
- 企業がデータインフラストラクチャの近代化、洞察までの時間の改善、AIおよび機械学習ワークフローとのシームレスな統合を求めるにつれて、クラウドベースのグラフデータベースの需要が急速に加速しています。
グラフデータベース市場ダイナミクス
ドライバ
「リアルタイムデータ分析の必要性の高まり」
- 業界全体でリアルタイムデータ分析の需要が高まっていることが、グラフデータベースの需要増加の大きな要因となっている。
- 例えば、Neo4jは2024年3月にグラフデータサイエンスプラットフォームのメジャーアップデートを発表し、リアルタイムレコメンデーション機能と不正検出機能を強化しました。これらの機能は、フィンテック企業やeコマースプラットフォームで急速に導入されています。主要企業によるこのような開発は、今後数年間でグラフデータベース市場を牽引すると予想されます。
- 企業が高度に連携したデータの増加に直面する中、グラフデータベースは、従来のデータベースでは効率的に処理できない関係性やパターンを瞬時に分析することを可能にします。これは、不正取引の検出、サプライチェーンの混乱の特定、パーソナライズされたコンテンツエンジンの強化といったユースケースにおいて極めて重要です。
- さらに、銀行、通信、小売などの分野では、即時の洞察に対する需要が高まっており、組織はバッチ処理モデルからグラフ技術を活用したリアルタイム分析ソリューションへと移行しています。
- TigerGraph、Amazon Neptune、Microsoft Azure Cosmos DBなどの企業が提供するクラウドベースのソリューションは、リアルタイムグラフ分析へのアクセスをさらに拡大し、企業がさまざまな運用環境にこれらの機能を迅速かつコスト効率よく導入できるようにします。
抑制/挑戦
「限られた労働力の専門知識」
- グラフデータベース技術に関する人材の専門知識が限られていることは、市場への導入・展開において大きな課題となっています。グラフデータベースは、グラフ理論、CypherやGremlinなどのクエリ言語、そしてスキーマ設計に関する専門知識を必要とするため、多くの組織は、これらのシステムを効果的に実装・管理できる有能な専門家の確保に苦労しています。
- 例えば、Neo4jは広く採用されているにもかかわらず、多くの企業は、そのアーキテクチャとグラフクエリ言語に精通した開発者のオンボーディングにおいて、急峻な学習曲線に直面しています。この専門知識の不足は、導入期間の遅延、実装の不適切な設定、グラフデータベース機能の活用不足につながる可能性があります。
- 市場拡大には、ターゲットを絞ったトレーニングプログラム、認定コース、そしてユーザーフレンドリーな開発ツールを通してこの課題に対処することが不可欠です。TigerGraphやNeo4jといった企業は、熟練したユーザー基盤を構築するための教育イニシアチブやコミュニティサポートプラットフォームを立ち上げていますが、人材不足は依然として高度なグラフベースソリューションの拡張におけるボトルネックとなっています。
- さらに、グラフ技術の急速な革新は、従来のITチームを圧倒し、専門知識のギャップをさらに拡大させる可能性があります。この問題は、専門的なトレーニングに投資するリソースが不足している中小企業で特に顕著です。
- 戦略的パートナーシップ、学術的コラボレーション、簡素化されたツールを通じてこの人材不足を解消することは、組織がリアルタイム分析、不正検出、ナレッジグラフアプリケーションのためのグラフデータベースの可能性を最大限に活用できるようにするために不可欠です。
グラフデータベース市場の範囲
市場は、タイプ、アプリケーション、データベース、展開モデル、分析タイプ、サイズ、コンポーネント、およびエンドユーザーに基づいてセグメント化されています。
• タイプ別
グラフデータベース市場は、種類別に、リソース記述フレームワーク(RDF)とラベル付きプロパティグラフ(LPG)に分類されます。ラベル付きプロパティグラフ(LPG)セグメントは、ノード、エッジ、キーバリュープロパティによる複雑な関係性を柔軟に表現できることから、2024年には最大の市場収益シェアを占めました。LPGの直感的なデータモデリング構造は、ナレッジグラフ、レコメンデーションエンジン、リアルタイム不正検出などのユースケースを高性能でサポートし、トランザクションワークロードと分析ワークロードの両方に適しています。
RDFセグメントは、標準化されたセマンティックウェブフレームワークと、リンクデータおよびオントロジーベースの推論との強力な互換性により、2025年から2032年にかけて最も高いCAGRを達成すると予測されています。RDFは、データ統合とW3C標準への準拠を目的として、政府機関や学術機関、特に異種データソース間での強力な相互運用性が求められるプロジェクトにおいて採用が拡大しています。
• アプリケーション別
アプリケーション別に見ると、グラフデータベース市場は不正検出、不正防止、および推奨エンジンに分類されます。不正検出と不正防止は、銀行やeコマースセクターにおける隠れたパターンの発見やリアルタイムでの異常検知への導入拡大により、2024年には最大の収益シェアを占めました。グラフデータベースは、接続されたデータから得られる洞察を通じて不審な行動を特定することに優れており、ますます巧妙化する不正行為に対抗するための高度なツールを企業に提供します。
レコメンデーションエンジン分野は、小売、ストリーミング、ソーシャルプラットフォームなどの分野における高度にパーソナライズされたユーザーエクスペリエンスへの需要に牽引され、2025年から2032年にかけて最も高い成長率を記録すると予想されています。グラフベースのレコメンデーションは、多次元の関係性を活用して正確なコンテンツや製品の提案を提供し、顧客エンゲージメントと満足度を大幅に向上させます。
• データベース別
データベースの種類に基づいて、グラフデータベース市場はリレーショナル(SQL)と非リレーショナル(NoSQL)に分類されます。非リレーショナル(NoSQL)セグメントは、高いスケーラビリティ、スキーマの柔軟性、そして非構造化データと半構造化データの処理能力により、2024年に最大の市場シェアを獲得しました。NoSQLグラフデータベースは、アジャイルアプリケーション開発とリアルタイム分析をサポートするため、ソーシャルネットワーク、サイバーセキュリティ、ナレッジマネジメントといった動的な環境で広く採用されています。
リレーショナル(SQL)セグメントは、企業が従来のSQL環境にグラフ機能を統合するにつれて、2025年から2032年にかけて最も高いCAGRで成長すると予測されています。このハイブリッドアプローチにより、組織は既存のリレーショナルインフラストラクチャを活用しながら、高度なリレーションシップクエリ機能を活用し、運用上の中断やトレーニングの必要性を最小限に抑えることができます。
• 導入モデル別
グラフデータベース市場は、導入モデルに基づいてオンプレミスとクラウドに分類されます。スケーラブルでコスト効率が高く、メンテナンスフリーの導入オプションへの需要の高まりを背景に、クラウドセグメントは2024年に最大の収益シェアを占めました。クラウドベースのグラフデータベースは、オンデマンドのパフォーマンス、他のクラウドサービスとの容易な統合、そしてグローバルなアクセス性を提供し、分散型チームや最新のアプリケーション開発に最適です。
オンプレミスセグメントは、2025年から2032年にかけて最も急速な成長を遂げると予想されており、特に金融、ヘルスケア、防衛といった規制の厳しい分野の企業で顕著です。これらの組織は、より高度なデータ管理、厳格なプライバシーポリシーへの準拠、そして外部からの脅威に対するセキュリティ確保のために、オンプレミス環境を好んでいます。
• 分析タイプ別
分析の種類に基づいて、グラフデータベース市場はパス分析、接続性分析、コミュニティ分析、中心性分析に分類されます。パス分析は、物流の最適化、不正行為の連鎖の検出、カスタマージャーニーのマッピングにおいて重要な役割を果たすことから、2024年には最大の市場シェアを獲得しました。これにより、企業はトランザクションデータと運用データにおけるシーケンス、依存関係、因果関係を理解することができます。
コミュニティ分析は、マーケティング、ソーシャルネットワーク分析、サイバーセキュリティ分野への応用により、2025年から2032年にかけて最も高いCAGRを達成すると予想されています。コミュニティ分析は、クラスター、インフルエンサーグループ、行動パターンの特定に役立ち、よりターゲットを絞った介入とエコシステムのダイナミクスに関するより深い洞察を可能にします。
• サイズ別
組織規模に基づき、市場は大企業と中小企業(SME)に分類されます。大企業は、部門や地域をまたがる大規模で複雑なデータセットを管理する必要性が高まっていることから、2024年には最大の収益シェアを占めました。これらの組織は、企業ナレッジグラフ、不正分析、サプライチェーン最適化などにグラフデータベースを活用しています。
中小企業セグメントは、デジタルトランスフォーメーションへの取り組みの増加とクラウドベースのグラフソリューションへのアクセス拡大により、2025年から2032年にかけて最も高い成長率で成長すると予想されています。中小企業は、従来のインフラに多額の投資をすることなく、顧客インサイトの向上と意思決定の合理化によるメリットを享受できます。
• コンポーネント別
グラフデータベース市場は、コンポーネント別にソフトウェアとサービスに分類されます。2024年にはソフトウェアセグメントが最大の市場シェアを獲得しました。これは、データのクエリ、可視化、統合のためのグラフエンジンとデータベース管理プラットフォームの導入増加によるものです。継続的な製品イノベーションとオープンソースの利用可能性の拡大も、このセグメントをさらに強化しています。
サービスセグメントは、コンサルティング、トレーニング、統合、サポートサービスの需要増加に支えられ、2025年から2032年にかけて最も高いCAGRで成長すると予測されています。グラフテクノロジーを検討する組織が増えるにつれ、スムーズな導入、パフォーマンスチューニング、そしてビジネス目標との戦略的整合性を確保するために、専門家によるサービスが不可欠となります。
• エンドユーザーによる
エンドユーザーに基づいて、グラフデータベース市場は、銀行・金融サービス ・保険(BFSI)、通信・IT、ヘルスケア・ライフサイエンス、運輸・物流、小売・Eコマース、エネルギー・公益事業、政府・公共機関、製造業、その他に分類されます。BFSIセグメントは、堅牢な不正検出、リスク管理、規制遵守のニーズに牽引され、2024年には最大の市場シェアを獲得しました。グラフデータベースは、BFSI事業者に複雑な取引関係をマッピングし、金融犯罪ネットワークを追跡する機能を提供します。
ヘルスケア・ライフサイエンス分野は、ゲノミクス、創薬、患者データ統合といったアプリケーションの増加により、2025年から2032年にかけて最も高いCAGRを記録すると予想されています。グラフテクノロジーにより、研究者や臨床医は生物学的ネットワークや医療記録をネットワーク化されたコンテキストで分析できるようになり、イノベーションと個別化ケアの促進につながります。
グラフデータベース市場地域分析
- 北米は、高度な分析ツールの早期導入、AIと機械学習への強力な投資、BFSI、ヘルスケア、ITなどの業界におけるリアルタイムデータ処理の需要の高まりにより、2024年には42.5%という最大の収益シェアでグラフデータベース市場を席巻しました。
- この地域の組織は、グラフデータベースを不正検出、推奨エンジン、構造化および非構造化データセット全体の複雑なネットワーク分析に活用しています。
- 市場の拡大は、大手ベンダーの存在、クラウド導入の増加、そしてスケーラブルで高性能なデータ管理ソリューションに対する企業の需要によって支えられています。
米国グラフデータベース市場インサイト
米国のグラフデータベース市場は、企業のデジタル化の進展とグラフベース分析のデータプラットフォームへの統合に牽引され、2024年には北米で最大の収益シェアを獲得しました。同国の先進的なクラウドインフラストラクチャとデータ中心の規制環境は、金融、ヘルスケア、小売業における導入を促進しています。米国企業は、ソリューションプロバイダーとクラウドプラットフォームの堅牢なエコシステムに支えられ、顧客体験の向上、サイバーセキュリティ、リレーションシップインテリジェンスのためにグラフデータベースを導入するケースが増えています。
ヨーロッパグラフデータベース市場インサイト
欧州のグラフデータベース市場は、GDPRなどの厳格なデータガバナンス基準と、データリネージ、透明性、相互運用性への地域における関心の高まりを主な要因として、予測期間を通じて高いCAGRで拡大すると予測されています。通信、銀行金融サービス(BFSI)、公共サービスにおけるAIを活用したインサイトへの需要の高まりが成長を牽引しています。企業は、不正検出の強化、サプライチェーンの可視性向上、デジタルチャネル全体にわたるパーソナライゼーション戦略の推進を目的として、グラフテクノロジーを導入しています。
英国グラフデータベース市場洞察
英国のグラフデータベース市場は、デジタルトランスフォーメーションへの投資増加と、政府・金融セクターにおけるネットワーク分析の重要性の高まりを背景に、予測期間中に堅調な年平均成長率(CAGR)で成長すると予想されています。英国のフィンテック市場の拡大とサイバーセキュリティへの関心の高まりは、グラフベースの不正検出およびカスタマージャーニーマッピングソリューションの需要を促進しています。また、セマンティックナレッジグラフの構築に注力する研究機関や企業における導入も増加しています。
ドイツグラフデータベース市場洞察
ドイツのグラフデータベース市場は、インダストリー4.0、データ自動化、そしてインテリジェントな意思決定への同国の注力に支えられ、予測期間中、着実に拡大すると見込まれています。ドイツ企業は、生産ネットワークの最適化、予知保全、そしてIT運用にグラフデータベースを活用しています。特に自動車、製造業、そして公共部門の分野では、グラフ分析をレガシーシステムやERPプラットフォームに統合する動きが加速しています。
アジア太平洋グラフデータベース市場インサイト
アジア太平洋地域のグラフデータベース市場は、企業のデジタル化の進展、政府主導のスマートシティ構想、そして中国、インド、日本、韓国などの経済圏における急速なクラウド導入を背景に、2025年から2032年にかけて最も高いCAGRで成長すると見込まれています。多くの組織は、不正検出、パーソナライズされたサービス、そして分散環境における複雑なデータ統合を強化するために、グラフデータベースに注目しています。
日本グラフデータベース市場インサイト
日本のグラフデータベース市場は、国内の強力な技術インフラとAIを活用したデータソリューションへの需要の高まりに牽引され、着実に成長しています。企業や政府機関は、セマンティック検索の精度向上、物流の最適化、サイバーセキュリティ脅威のパターン検出などにグラフデータベースを活用しています。また、日本のSociety 5.0の目標に沿ったIoTやスマート製造システムへのグラフ分析の統合も、この市場を支えています。
中国グラフデータベース市場インサイト
中国のグラフデータベース市場は、2024年にアジア太平洋地域最大の収益シェアを獲得しました。これは、政府によるデータイノベーションの推進と、テクノロジー、金融、物流セクターからの旺盛な需要によるものです。中国の急成長を続けるデジタルエコシステムは、グラフデータベースを活用して、レコメンデーションシステム、不正検出、サプライチェーンインテリジェンスを支援しています。国内ベンダーは、豊富な人材プールと好ましい政策枠組みに支えられ、グラフ分野で積極的にイノベーションを進めています。
グラフデータベースの市場シェア
グラフ データベース業界は、主に次のような定評のある企業によってリードされています。
- ヒューレット・パッカード・エンタープライズ・デベロップメントLP(米国)
- IBM(米国)
- マイクロソフト(米国)
- シーメンス(ドイツ)
- ANSYS, Inc.(米国)
- SAP SE(ドイツ)
- オラクル(米国)
- ロバート・ボッシュGmbH(ドイツ)
- アトスSE(フランス)
- ABB(スイス)
- ケルトン(インド)
- AVEVAグループリミテッド(英国)
- DXCテクノロジー社(米国)
- アルテアエンジニアリング社(米国)
- ヘクサウェアテクノロジーズリミテッド(インド)
- タタ・コンサルタンシー・サービシズ・リミテッド(インド)
- インフォシス・リミテッド(インド)
- NTTデータグループ株式会社(日本)
- クラウドソフトウェアグループ社(米国)
- Redis Ltd(米国)
グローバルグラフデータベース市場の最新動向
- 2023年5月、AWSはグラフデータベースのランドスケープを定義し、オープンソース標準を確立する主要プレーヤーであるNeo4jと提携しました。AWS Marketplaceの販売者として、Neo4jはグラフデータベース分野のリーダーとしての地位を確立しています。さらに、同社はAWSデータおよびアナリティクスコンピテンシーを取得し、AWSプラットフォーム上で高度なデータソリューションを提供する専門知識を証明しています。
- 2023年5月、SAPとGoogle Cloudはパートナーシップの強化を発表し、データランドスケープの合理化とビジネスデータの潜在能力の最大化を目的とした包括的なオープンデータサービスの提供を開始しました。この新たな取り組みは、SAPとGoogle Cloudのデータおよび分析技術を統合し、企業データのアクセス性と有用性を向上させます。さらに、企業のAI開発の進歩を促進し、企業のイノベーションとインサイトの向上を促進することを目指しています。
- 2023年4月、Neo4jはシンガポールにおけるグラフ技術の需要の高まりに対応するため、Imperium Solutionsと提携しました。この協業を通じて、Imperium Solutionsは、複雑なエンタープライズレベルの課題解決で知られるグラフデータベースのリーディングプロバイダーであるNeo4jの潜在能力を最大限に引き出すお手伝いをします。この提携は、膨大なデータセット内の関係性やパターンを効率的に特定する能力を強化し、シンガポールの企業にとってより大きな価値を生み出すことを目指しています。
- 2023年2月、IBMは革新的なアーキテクチャを備えたGraphQLサーバーを開発するStepZen Inc.の買収を発表しました。StepZenは、開発者がGraphQL APIを最小限のコーディングで迅速に構築できるように設計されています。StepZenは高い柔軟性を備え、様々なAPIアプローチとシームレスに統合できます。さらに、SaaS(Software as a Service)ソリューションとして提供されるだけでなく、プライベートクラウドやオンプレミスのデータセンターへの導入もサポートしており、多様なビジネスニーズに対応します。
- 2022年12月、LSEGとマイクロソフトは、次世代のデータおよび分析ソリューションの開発とクラウドインフラストラクチャの強化を目的とした10年間の戦略的パートナーシップを締結しました。この協業の一環として、マイクロソフトはLSEGの株式取得を通じて株式投資を行います。このパートナーシップでは、Microsoft Azure、人工知能、Microsoft Teamsを活用し、LSEGのデータインフラストラクチャを設計し、ユーザー向けに革新的な生産性、データ分析、モデリングソリューションを構築します。
SKU-
世界初のマーケットインテリジェンスクラウドに関するレポートにオンラインでアクセスする

- インタラクティブなデータ分析ダッシュボード
- 成長の可能性が高い機会のための企業分析ダッシュボード
- カスタマイズとクエリのためのリサーチアナリストアクセス
- インタラクティブなダッシュボードによる競合分析
- 最新ニュース、更新情報、トレンド分析
- 包括的な競合追跡のためのベンチマーク分析のパワーを活用
目次
1 はじめに
1.1 研究の目的
1.2 市場の定義
1.3 世界のグラフデータベース市場の概要
1.4 通貨と価格
1.5 制限
1.6 対象市場
2 市場セグメンテーション
2.1 重要なポイント
2.2 グローバルグラフデータベース市場への参入
2.2.1 ベンダーポジショニンググリッド
2.2.2 技術ライフライン曲線
2.2.3 マーケットガイド
2.2.4 多変量モデリング
2.2.5 トップツーボトム分析
2.2.6 測定基準
2.2.7 ベンダーシェア分析
2.2.8 主要な一次インタビューからのデータポイント
2.2.9 主要な二次データベースからのデータポイント
2.3 世界のグラフデータベース市場:調査スナップショット
2.4 仮定
3 市場概要
3.1 ドライバー
3.2 拘束
3.3 機会
3.4 課題
4 エグゼクティブサマリー
5つのプレミアムインサイト
5.1 ポーターの5つの力の分析
5.2 規制基準
5.3 業界分析と未来シナリオ
5.4 浸透と成長の見通しマッピング
5.5 新規事業と新興事業の収益機会
5.6 技術分析
5.6.1 主要技術
5.6.2 補完的な技術
5.6.3 隣接技術
図1 テクノロジーマトリックス
会社が提供する製品/サービス
5.7 企業競合分析
5.7.1 戦略的開発
5.7.2 技術実装プロセス
5.7.2.1. 課題
5.7.2.2. 社内実装/外部委託(サードパーティ)実装
5.7.3 顧客基盤
5.7.4 サービスの位置付け
5.7.5 顧客フィードバック/評価(B2BまたはB2C)
5.7.6 アプリケーションの範囲
5.7.7 サービスプラットフォームマトリックス
図2 企業比較分析
パラメータ会社A
市場占有率
成長 (%)
ターゲットオーディエンス
価格体系
市場戦略
顧客からのフィードバック
サービスポジショニング
顧客からのフィードバック/評価
戦略開発
アプリケーションリーチ
6社サービスプラットフォームマトリックス
6.1 使用事例とその分析
7 図4. 使用事例分析
会社が提供する製品/サービス
8 世界のグラフデータベース市場(モデル別)
8.1 概要
8.2 リソース記述フレームワーク(RDF)
8.3 ラベル付きプロパティグラフ(LPG)
8.4 ハイパーグラフ
8.5 その他
9 世界のグラフデータベース市場(オブジェクトセット別)
9.1 概要
9.2 ノード
9.3 エッジ
9.4 その他
10 世界のグラフデータベース市場、提供内容別
10.1 概要
10.2 解決策
10.2.1 デプロイメントタイプ別
10.2.1.1. オンプレミス
10.2.1.2. クラウド
10.3 サービス
10.3.1 専門サービス
10.3.2 マネージドサービス
11 世界のグラフデータベース市場(分析タイプ別)
11.1 概要
11.2 パス解析
11.3 接続性分析
11.4 コミュニティ分析
11.5 中心性分析
12 世界のグラフデータベース市場(アプリケーション別)
12.1 概要
12.2 不正行為の検出
12.3 リアルタイムレコメンデーションエンジン
12.4 マスターデータ管理(MDM)
12.5 ネットワークとIT運用
12.6 アイデンティティおよびアクセス管理(IAM)
13 世界のグラフデータベース市場(組織タイプ別)
13.1 概要
13.2 大企業
13.3 中小企業
14 グローバルグラフデータベース市場(導入形態別)
14.1 概要
14.2 オンプレミス
14.3 クラウド
15 世界のグラフデータベース市場(エンドユーザー別)
15.1 概要
15.2 製造業と自動車産業
15.2.1 提供により
15.2.1.1. 解決策
15.2.1.1.1. デプロイメントタイプ別
15.2.1.1.1.1 オンプレミス
15.2.1.1.1.2 クラウド
15.2.1.1.1.3 サービス
15.2.1.1.1.4 専門サービス
15.2.1.1.1.5 マネージドサービス
15.3 小売業と電子商取引
15.3.1 解決策
15.3.1.1. デプロイメントタイプ別
15.3.1.1.1. オンプレミス
15.3.1.1.2. クラウド
15.3.1.2. サービス
15.3.1.2.1. 専門サービス
15.3.1.2.2. マネージドサービス
15.4 ヘルスケアおよび医薬品
15.4.1 解決策
15.4.1.1. デプロイメントタイプ別
15.4.1.1.1. オンプレミス
15.4.1.1.2. クラウド
15.4.1.2. サービス
15.4.1.2.1. 専門サービス
15.4.1.2.2. マネージドサービス
15.5 銀行、金融サービス、保険
15.5.1 解決策
15.5.1.1. デプロイメントタイプ別
15.5.1.1.1. オンプレミス
15.5.1.1.2. クラウド
15.5.1.2. サービス
15.5.1.2.1. 専門サービス
15.5.1.2.2. マネージドサービス
15.6 エネルギーとユーティリティ
15.6.1 解決策
15.6.1.1. デプロイメントタイプ別
15.6.1.1.1. オンプレミス
15.6.1.1.2. クラウド
15.6.1.2. サービス
15.6.1.2.1. 専門サービス
15.6.1.2.2. マネージドサービス
15.7 政府と公共
15.7.1 解決策
15.7.1.1. デプロイメントタイプ別
15.7.1.1.1. オンプレミス
15.7.1.1.2. クラウド
15.7.1.2. サービス
15.7.1.2.1. 専門サービス
15.7.1.2.2. マネージドサービス
15.8 通信・IT
15.8.1 解決策
15.8.1.1. デプロイメントタイプ別
15.8.1.1.1. オンプレミス
15.8.1.1.2. クラウド
15.8.1.2. サービス
15.8.1.2.1. 専門サービス
15.8.1.2.2. マネージドサービス
15.9 運輸・物流
15.9.1 解決策
15.9.1.1. デプロイメントタイプ別
15.9.1.1.1. オンプレミス
15.9.1.1.2. クラウド
15.9.1.2. サービス
15.9.1.2.1. 専門サービス
15.9.1.2.2. マネージドサービス
15.1 その他
16 世界のグラフデータベース市場(地域別)
16.1 世界のグラフデータベース市場(上記のすべてのセグメンテーションは、この章では国別に表されています)
16.1.1 北米
16.1.1.1. 米国
16.1.1.2. カナダ
16.1.1.3. メキシコ
16.1.2 ヨーロッパ
16.1.2.1. ドイツ
16.1.2.2. フランス
16.1.2.3. 英国
16.1.2.4. イタリア
16.1.2.5. スペイン
16.1.2.6. ロシア
16.1.2.7. トルコ
16.1.2.8. ベルギー
16.1.2.9. オランダ
16.1.2.10. スイス
16.1.2.11. スウェーデン
16.1.2.12. デンマーク
16.1.2.13. ポーランド
16.1.2.14. その他のヨーロッパ諸国
16.1.3 アジア太平洋
16.1.3.1. 日本
16.1.3.2. 中国
16.1.3.3. 韓国
16.1.3.4. インド
16.1.3.5. オーストラリアとニュージーランド
16.1.3.6. シンガポール
16.1.3.7. タイ
16.1.3.8. マレーシア
16.1.3.9. インドネシア
16.1.3.10. フィリピン
16.1.3.11. 台湾
16.1.3.12. ベトナム
16.1.3.13. その他のアジア太平洋地域
16.1.4 南アメリカ
16.1.4.1. ブラジル
16.1.4.2. アルゼンチン
16.1.4.3. 南米のその他の地域
16.1.5 中東およびアフリカ
16.1.5.1. 南アフリカ
16.1.5.2. エジプト
16.1.5.3. サウジアラビア
16.1.5.4. アラブ首長国連邦
16.1.5.5. イスラエル
16.1.5.6. クウェート
16.1.5.7. カタール
16.1.5.8. その他の中東およびアフリカ
16.2 主要国別の主な洞察
17 グローバルグラフデータベース市場、企業概要
17.1 企業シェア分析:グローバル
17.2 企業シェア分析:北米
17.3 企業シェア分析:ヨーロッパ
17.4 企業シェア分析:アジア太平洋地域
17.5 合併と買収
17.6 新製品の開発と承認
17.7 拡張
17.8 規制の変更
17.9 パートナーシップおよびその他の戦略的展開
18 グローバルグラフデータベース市場、SWOT分析
19 グローバルグラフデータベース市場、企業プロフィール
19.1 マイクロソフト株式会社
19.1.1 会社概要
19.1.2 収益分析
19.1.3 製品ポートフォリオ
19.1.4 最近の開発
19.2 IBMコーポレーション
19.2.1 会社のスナップショット
19.2.2 収益分析
19.2.3 製品ポートフォリオ
19.2.4 最近の開発
19.3 株式会社NEO4J
19.3.1 会社のスナップショット
19.3.2 収益分析
19.3.3 製品ポートフォリオ
19.3.4 最近の開発
19.4 オラクル株式会社
19.4.1 会社のスナップショット
19.4.2 収益分析
19.4.3 製品ポートフォリオ
19.4.4 最近の開発
19.5 データスタックス株式会社
19.5.1 会社のスナップショット
19.5.2 収益分析
19.5.3 製品ポートフォリオ
19.5.4 最近の開発
19.6 アランゴグラフDB
19.6.1 会社のスナップショット
19.6.2 収益分析
19.6.3 製品ポートフォリオ
19.6.4 最近の開発
19.7 タイガーグラフ
19.7.1 会社のスナップショット
19.7.2 収益分析
19.7.3 製品ポートフォリオ
19.7.4 最近の開発
19.8 アマゾンウェブサービス株式会社
19.8.1 会社のスナップショット
19.8.2 収益分析
19.8.3 製品ポートフォリオ
19.8.4 最近の開発
19.9 オントテキスト株式会社
19.9.1 会社のスナップショット
19.9.2 収益分析
19.9.3 製品ポートフォリオ
19.9.4 最近の開発
19.1 スタードッグユニオン
19.10.1 会社概要
19.10.2 収益分析
19.10.3 製品ポートフォリオ
19.10.4 最近の開発
19.11 SAP SE
19.11.1 会社概要
19.11.2 収益分析
19.11.3 製品ポートフォリオ
19.11.4 最近の開発
19.12 マークロジック株式会社
19.12.1 会社概要
19.12.2 収益分析
19.12.3 製品ポートフォリオ
19.12.4 最近の開発
19.13 TIBCO SOFTWARE INC.(クラウドソフトウェアグループ)
19.13.1 会社概要
19.13.2 収益分析
19.13.3 製品ポートフォリオ
19.13.4 最近の開発
19.14 フランツ株式会社
19.14.1 会社概要
19.14.2 収益分析
19.14.3 製品ポートフォリオ
19.14.4 最近の開発
19.15 オープンリンクソフトウェア
19.15.1 会社概要
19.15.2 収益分析
19.15.3 製品ポートフォリオ
19.15.4 最近の開発
19.16 ビットナイン株式会社
19.16.1 会社概要
19.16.2 収益分析
19.16.3 製品ポートフォリオ
19.16.4 最近の開発
19.17 フルーリー
19.17.1 会社概要
19.17.2 収益分析
19.17.3 製品ポートフォリオ
19.17.4 最近の開発
19.18 グラフ
19.18.1 会社概要
19.18.2 収益分析
19.18.3 製品ポートフォリオ
19.18.4 最近の開発
19.19 REDISラボ
19.19.1 会社概要
19.19.2 収益分析
19.19.3 製品ポートフォリオ
19.19.4 最近の開発
19.2 アルテアエンジニアリング株式会社
19.20.1 会社概要
19.20.2 収益分析
19.20.3 製品ポートフォリオ
19.20.4 最近の開発
注:紹介されている企業は網羅的なリストではなく、以前のクライアントの要件に従っています。調査では100社以上の企業を紹介しており、リクエストに応じて企業リストを変更または差し替える場合があります。
関連レポート20件
21 アンケート
22 データブリッジマーケットリサーチについて
調査方法
データ収集と基準年分析は、大規模なサンプル サイズのデータ収集モジュールを使用して行われます。この段階では、さまざまなソースと戦略を通じて市場情報または関連データを取得します。過去に取得したすべてのデータを事前に調査および計画することも含まれます。また、さまざまな情報ソース間で見られる情報の不一致の調査も含まれます。市場データは、市場統計モデルと一貫性モデルを使用して分析および推定されます。また、市場シェア分析と主要トレンド分析は、市場レポートの主要な成功要因です。詳細については、アナリストへの電話をリクエストするか、お問い合わせをドロップダウンしてください。
DBMR 調査チームが使用する主要な調査方法は、データ マイニング、データ変数が市場に与える影響の分析、および一次 (業界の専門家) 検証を含むデータ三角測量です。データ モデルには、ベンダー ポジショニング グリッド、市場タイムライン分析、市場概要とガイド、企業ポジショニング グリッド、特許分析、価格分析、企業市場シェア分析、測定基準、グローバルと地域、ベンダー シェア分析が含まれます。調査方法について詳しくは、お問い合わせフォームから当社の業界専門家にご相談ください。
カスタマイズ可能
Data Bridge Market Research は、高度な形成的調査のリーダーです。当社は、既存および新規のお客様に、お客様の目標に合致し、それに適したデータと分析を提供することに誇りを持っています。レポートは、対象ブランドの価格動向分析、追加国の市場理解 (国のリストをお問い合わせください)、臨床試験結果データ、文献レビュー、リファービッシュ市場および製品ベース分析を含めるようにカスタマイズできます。対象競合他社の市場分析は、技術ベースの分析から市場ポートフォリオ戦略まで分析できます。必要な競合他社のデータを、必要な形式とデータ スタイルでいくつでも追加できます。当社のアナリスト チームは、粗い生の Excel ファイル ピボット テーブル (ファクト ブック) でデータを提供したり、レポートで利用可能なデータ セットからプレゼンテーションを作成するお手伝いをしたりすることもできます。

