Europe Water Detection Sensors Market
시장 규모 (USD 10억)
연평균 성장률 :
% 
 USD
571.18 Million
USD
1,065.08 Million
2025
2033
USD
571.18 Million
USD
1,065.08 Million
2025
2033
| 2026 –2033 | |
| USD 571.18 Million | |
| USD 1,065.08 Million | |
| % | |
|
Europe Water Detection Sensors Market Segmentation, By Sensor Type (Chlorine Residual Sensor, pH Sensor, TOC Sensor, ORP Sensor, Conductivity Sensor and Others), Size (Less Than 38 mm and More Than 38 mm), Weight (Less Than 60 gms and More Than 60 gms), Device Range (Less Than 250 ft and More Than 250 ft), Voltage Range (Less Than 15 VDC, 15 VDC To 25 VDC and More Than 25 VDC), Purpose (Constitute In Water (Chemical Concentrations, Solids) and Measure Surrogates), Connectivity (Wireless and Wired), End Use (Industrial, Drinking Water, Ground Water, Aquaculture, Wastewater and Others)- Industry Trends and Forecast to 2033
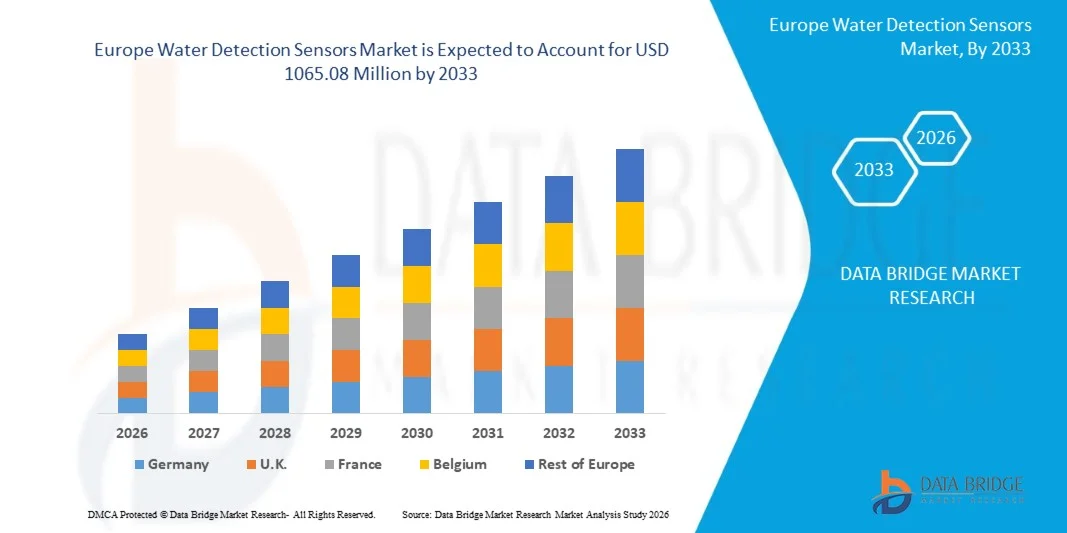
Europe Water Detection Sensors Market Size
- The Europe water detection sensors market size was valued at USD 571.18 million in 2025 and is expected to reach USD 1065.08 million by 2033, at a CAGR of 8.10% during the forecast period
- The market growth is largely fuelled by increasing demand for automated leak detection in industrial, commercial, and residential sectors
- Rising adoption of IoT-enabled smart sensors for water monitoring and management is driving market expansion
Europe Water Detection Sensors Market Analysis
- The market is witnessing rapid technological advancements, including wireless, smart, and multi-parameter sensors for precise water leakage and level detection
- Increasing integration of water detection sensors in smart buildings, industrial plants, and municipal water systems is enhancing operational efficiency and reducing maintenance costs
- Germany dominated the water detection sensors market with the largest revenue share in 2025, driven by stringent industrial safety regulations, rising adoption of smart building technologies, and increasing awareness of water conservation.
- U.K. is expected to witness the highest compound annual growth rate (CAGR) in the Europe water detection sensors market due to increasing government initiatives for water conservation, rising demand for real-time leak detection solutions, and the adoption of IoT-enabled smart water management systems across industrial and commercial sectors
- The Chlorine Residual Sensor segment held the largest market revenue share in 2025, driven by its widespread use in monitoring water quality in industrial and drinking water applications. These sensors provide accurate, real-time measurements of chlorine levels, ensuring water safety, regulatory compliance, and operational efficiency
Report Scope and Europe Water Detection Sensors Market Segmentation
|
Attributes |
Europe Water Detection Sensors Key Market Insights |
|
Segments Covered |
|
|
Countries Covered |
Europe
|
|
Key Market Players |
|
|
Market Opportunities |
• Adoption Of IoT-Enabled Water Detection Sensors |
|
Value Added Data Infosets |
In addition to the insights on market scenarios such as market value, growth rate, segmentation, geographical coverage, and major players, the market reports curated by the Data Bridge Market Research also include in-depth expert analysis, geographically represented company-wise production and capacity, network layouts of distributors and partners, detailed and updated price trend analysis and deficit analysis of supply chain and demand. |
Europe Water Detection Sensors Market Trends
“Rise of Smart and Real-Time Water Detection Systems”
• The growing adoption of smart water detection sensors is transforming the water management landscape by enabling real-time monitoring and leakage detection. These sensors allow immediate identification of water ingress or pipeline leaks, reducing operational losses and preventing property damage. Integration with IoT platforms allows automated alerts and predictive maintenance, further minimizing downtime and costly repairs. Advanced analytics provide actionable insights for water usage optimization and resource conservation
• Increasing demand for rapid and precise detection in industrial, commercial, and residential settings is accelerating the adoption of IoT-enabled sensors and automated alert systems. These solutions are particularly effective in critical infrastructure where timely detection prevents costly downtime and water-related damage. Smart sensors also support remote monitoring through mobile and cloud-based applications, enabling operators to manage multiple sites efficiently. The data collected can be used for compliance reporting and predictive maintenance planning
• The affordability, ease of deployment, and scalability of modern water detection sensors are making them attractive for widespread usage. Operators benefit from continuous monitoring without heavy manual inspection, enhancing preventive maintenance and operational efficiency. Modular sensor designs allow flexible installation in new and existing infrastructure, reducing retrofitting costs. These solutions support both large-scale industrial setups and smaller commercial or residential applications, broadening market reach
• For instance, in 2023, several commercial facilities integrated smart water sensors into their building management systems, enabling early leak detection, reducing water wastage, and lowering maintenance costs. The automated notifications allowed maintenance teams to respond immediately, preventing extensive damage. Implementation of these sensors also helped reduce insurance premiums and enhanced overall sustainability credentials of the facilities
• While smart detection systems are improving water management and reducing losses, their effectiveness depends on continued innovation, integration with building systems, and ease of maintenance. Manufacturers must focus on robust, scalable, and cost-effective solutions to fully capitalize on growing market demand. Increasing interoperability with other building automation systems and AI-powered analytics will further strengthen operational efficiency and reduce false alarms
Europe Water Detection Sensors Market Dynamics
Driver
“Increasing Water Conservation Efforts and Focus on Infrastructure Safety”
• Rising concerns over water scarcity and the need for efficient water management are driving adoption of advanced water detection sensors. These systems help detect leaks, prevent water loss, and support sustainability initiatives. They also play a critical role in minimizing environmental impact and promoting responsible resource management in commercial and industrial sectors. Widespread awareness campaigns about water conservation are further encouraging adoption
• Growing investments in smart building infrastructure and automated monitoring systems are enhancing demand for connected water sensors that integrate with building management platforms. The integration enables real-time dashboards, remote alerts, and predictive maintenance, ensuring operational continuity. Organizations are increasingly leveraging cloud-based analytics to optimize water usage and reduce operational costs while meeting regulatory requirements
• Industrial and commercial operators are increasingly prioritizing water damage prevention to avoid costly repairs, downtime, and regulatory penalties, accelerating the deployment of smart detection technologies. The ability to monitor critical points continuously and predict potential failures helps minimize operational risks. Water sensors are now being adopted as part of broader facility management strategies to ensure sustainability, safety, and regulatory compliance
• For instance, in 2023, multiple manufacturing facilities implemented IoT-enabled water detection sensors, reducing water-related operational disruptions and improving resource efficiency. These implementations also allowed predictive maintenance scheduling, preventing costly emergency repairs. In addition, companies reported improved operational KPIs, such as reduced water loss, enhanced asset lifespan, and lower operational downtime
• While rising awareness and technological adoption are driving market growth, sensor reliability, integration capability, and system scalability remain critical for sustained expansion. Continuous improvement in sensor accuracy, wireless connectivity, and AI-based data analysis is essential for maximizing return on investment. Strong after-sales support and user-friendly interfaces are also vital to maintaining high adoption rates
Restraint/Challenge
“High Costs and Maintenance Requirements of Advanced Water Detection Systems”
• The high initial investment for advanced water detection sensors, especially IoT-enabled or real-time monitoring systems, limits adoption among smaller facilities and residential users. Implementation costs, including installation, software licensing, and sensor calibration, can be prohibitive. Smaller operators may delay adoption until costs decrease or integrated solutions become more affordable
• Maintenance and calibration requirements for sophisticated sensors can increase operational complexity and costs, reducing overall accessibility. Sensors require periodic testing, firmware updates, and sometimes replacement of parts to maintain accuracy. The need for skilled personnel to manage these processes adds further operational overhead, impacting adoption in resource-constrained environments
• Integration challenges with existing building or industrial management systems may delay deployment and reduce operational efficiency. Compatibility issues with legacy systems or third-party platforms can necessitate additional investment in middleware or custom integration. Ensuring seamless interoperability while maintaining system security remains a challenge for many operators
• For instance, in 2023, several small commercial operators postponed sensor installation due to high equipment and integration costs, highlighting affordability as a key barrier. In some cases, delayed implementation resulted in higher water-related damages, illustrating the trade-off between cost and risk mitigation. Businesses emphasized the need for modular, easy-to-install solutions to overcome these challenges
• While technological innovation continues to advance sensor capabilities, addressing cost-effectiveness, maintenance simplicity, and seamless system integration is essential for unlocking the market’s full potential. Manufacturers focusing on plug-and-play solutions, subscription-based pricing models, and AI-powered predictive maintenance are likely to see faster adoption and higher market penetration
Europe Water Detection Sensors Market Scope
The market is segmented on the basis of sensor type, size, weight, device range, voltage range, purpose, connectivity, and end use.
• By Sensor Type
On the basis of sensor type, the Europe water detection sensors market is segmented into Chlorine Residual Sensor, pH Sensor, TOC Sensor, ORP Sensor, Conductivity Sensor, and Others. The Chlorine Residual Sensor segment held the largest market revenue share in 2025, driven by its widespread use in monitoring water quality in industrial and drinking water applications. These sensors provide accurate, real-time measurements of chlorine levels, ensuring water safety, regulatory compliance, and operational efficiency.
The pH Sensor segment is expected to witness the fastest growth rate from 2026 to 2033, driven by its critical role in maintaining chemical balance and preventing corrosion in water systems. pH sensors are increasingly integrated with IoT-enabled monitoring systems, allowing real-time alerts and remote management. Their compact size and ease of installation make them suitable for a variety of industrial and municipal water applications, supporting sustainable water management practices.
• By Size
On the basis of size, the Europe water detection sensors market is segmented into Less Than 38 mm and More Than 38 mm. The Less Than 38 mm segment held the largest market revenue share in 2025, owing to the demand for compact, space-saving sensors that can be easily installed in tight pipelines and confined water systems. Smaller sensors are increasingly preferred for modular installations and portable detection devices.
The More Than 38 mm segment is expected to witness the fastest growth from 2026 to 2033 due to its suitability for high-flow industrial water systems and large-scale treatment plants, where durability and robust performance are required. Larger sensors offer enhanced measurement stability and longer operational lifespan, making them ideal for continuous monitoring applications.
• By Weight
On the basis of weight, the Europe water detection sensors market is segmented into Less Than 60 gms and More Than 60 gms. The Less Than 60 gms segment held the largest revenue share in 2025, driven by the growing adoption of lightweight, portable water sensors for easy handling and installation. These sensors are particularly suitable for field inspections, mobile water quality testing, and remote monitoring.
The More Than 60 gms segment is expected to register the fastest growth rate from 2026 to 2033, fueled by demand for heavy-duty, industrial-grade sensors that provide higher durability and resistance to harsh operational conditions. These sensors are widely used in wastewater treatment and large-scale aquaculture systems where robustness is critical.
• By Device Range
On the basis of device range, the Europe water detection sensors market is segmented into Less Than 250 ft and More Than 250 ft. The Less Than 250 ft segment held the largest revenue share in 2025, driven by its suitability for localized water monitoring in residential, industrial, and municipal settings. Short-range sensors allow precise monitoring of small-scale systems and reduce latency in data collection.
The More Than 250 ft segment is expected to witness the fastest growth rate from 2026 to 2033 due to its application in large distribution networks and industrial plants. Long-range sensors support centralized monitoring and integration with SCADA systems, enabling real-time alerts and preventive maintenance across extended water networks.
• By Voltage Range
On the basis of voltage range, the Europe water detection sensors market is segmented into Less Than 15 VDC, 15 VDC To 25 VDC, and More Than 25 VDC. The Less Than 15 VDC segment held the largest market revenue share in 2025, driven by the low power requirements and compatibility with battery-operated and portable water detection devices. Energy-efficient sensors are increasingly preferred in sustainable water monitoring systems.
The 15 VDC To 25 VDC segment is expected to witness the fastest growth rate from 2026 to 2033 due to its balance between power efficiency and sensor performance. These sensors are widely deployed in industrial applications where stable voltage operation is critical for accurate measurements.
• By Purpose
On the basis of purpose, the Europe water detection sensors market is segmented into Constitute In Water (Chemical Concentrations, Solids) and Measure Surrogates. The Constitute In Water segment held the largest revenue share in 2025, fueled by growing regulatory compliance requirements and the need for precise monitoring of water contaminants. These sensors enable real-time detection of chemical levels, solids, and pollutants.
The Measure Surrogates segment is expected to witness the fastest growth rate from 2026 to 2033, driven by demand for indirect monitoring solutions that estimate water quality parameters using surrogate indicators. Surrogate measurement allows cost-effective, rapid assessment of water systems, reducing the need for frequent laboratory testing.
• By Connectivity
On the basis of connectivity, the Europe water detection sensors market is segmented into Wireless and Wired. The Wired segment held the largest market revenue share in 2025, due to its reliability, stable data transmission, and suitability for integration into established water monitoring networks. Wired sensors are widely used in industrial plants, treatment facilities, and large municipal systems.
The Wireless segment is expected to witness the fastest growth rate from 2026 to 2033, driven by rising adoption of IoT-enabled water monitoring systems. Wireless connectivity enables remote monitoring, reduced installation costs, and flexibility for retrofitting in existing pipelines and distributed water networks.
• By End Use
On the basis of end use, the Europe water detection sensors market is segmented into Industrial, Drinking Water, Ground Water, Aquaculture, Wastewater, and Others. The Industrial segment held the largest revenue share in 2025, owing to the critical need for leak detection and quality monitoring in manufacturing plants, food & beverage, and chemical industries. Industrial applications require continuous, accurate monitoring to prevent operational losses and ensure compliance with environmental regulations.
The Drinking Water segment is expected to witness the fastest growth rate from 2026 to 2033 due to increasing focus on public health, safety, and regulatory mandates for safe drinking water. Sensors in drinking water systems provide real-time monitoring of chemical and microbial parameters, ensuring quality standards and reducing contamination risks.
Europe Water Detection Sensors Market Regional Analysis
• Germany dominated the water detection sensors market with the largest revenue share in 2025, driven by stringent industrial safety regulations, rising adoption of smart building technologies, and increasing awareness of water conservation.
• Operators highly value real-time monitoring, early leak detection, and seamless integration with building management and industrial automation systems.
• This widespread adoption is further supported by technological innovation, sustainability initiatives, and rising investment in predictive maintenance solutions, establishing water detection sensors as critical for industrial and commercial applications.
U.K. Water Detection Sensors Market Insight
The U.K. water detection sensors market is expected to witness the fastest growth rate from 2026 to 2033, fueled by rising demand for smart infrastructure, proactive leak detection, and efficient water management. Facilities are increasingly deploying IoT-enabled sensors for early detection, operational efficiency, and compliance with safety regulations. The adoption is further supported by government initiatives for sustainable water use and the integration of sensors with real-time monitoring platforms.
Europe Water Detection Sensors Market Share
The Europe water detection sensors industry is primarily led by well-established companies, including:
- Endress+Hauser (Switzerland)
- Hach Lange GmbH (Germany)
- Vega Grieshaber KG (Germany)
- Siemens AG (Germany)
- ABB Ltd. (Switzerland)
- Schneider Electric SE (France)
- Krohne Group (Germany)
- Xylem Inc. (Germany)
- S::can Messtechnik GmbH (Austria)
- Itron, Inc. (France)
SKU-
세계 최초의 시장 정보 클라우드 보고서에 온라인으로 접속하세요

- 대화형 데이터 분석 대시보드
- 높은 성장 잠재력 기회를 위한 회사 분석 대시보드
- 사용자 정의 및 질의를 위한 리서치 분석가 액세스
- 대화형 대시보드를 통한 경쟁자 분석
- 최신 뉴스, 업데이트 및 추세 분석
- 포괄적인 경쟁자 추적을 위한 벤치마크 분석의 힘 활용
연구 방법론
데이터 수집 및 기준 연도 분석은 대규모 샘플 크기의 데이터 수집 모듈을 사용하여 수행됩니다. 이 단계에는 다양한 소스와 전략을 통해 시장 정보 또는 관련 데이터를 얻는 것이 포함됩니다. 여기에는 과거에 수집한 모든 데이터를 미리 검토하고 계획하는 것이 포함됩니다. 또한 다양한 정보 소스에서 발견되는 정보 불일치를 검토하는 것도 포함됩니다. 시장 데이터는 시장 통계 및 일관된 모델을 사용하여 분석하고 추정합니다. 또한 시장 점유율 분석 및 주요 추세 분석은 시장 보고서의 주요 성공 요인입니다. 자세한 내용은 분석가에게 전화를 요청하거나 문의 사항을 드롭하세요.
DBMR 연구팀에서 사용하는 주요 연구 방법론은 데이터 마이닝, 시장에 대한 데이터 변수의 영향 분석 및 주요(산업 전문가) 검증을 포함하는 데이터 삼각 측량입니다. 데이터 모델에는 공급업체 포지셔닝 그리드, 시장 타임라인 분석, 시장 개요 및 가이드, 회사 포지셔닝 그리드, 특허 분석, 가격 분석, 회사 시장 점유율 분석, 측정 기준, 글로벌 대 지역 및 공급업체 점유율 분석이 포함됩니다. 연구 방법론에 대해 자세히 알아보려면 문의를 통해 업계 전문가에게 문의하세요.
사용자 정의 가능
Data Bridge Market Research는 고급 형성 연구 분야의 선두 주자입니다. 저희는 기존 및 신규 고객에게 목표에 맞는 데이터와 분석을 제공하는 데 자부심을 느낍니다. 보고서는 추가 국가에 대한 시장 이해(국가 목록 요청), 임상 시험 결과 데이터, 문헌 검토, 재생 시장 및 제품 기반 분석을 포함하도록 사용자 정의할 수 있습니다. 기술 기반 분석에서 시장 포트폴리오 전략에 이르기까지 타겟 경쟁업체의 시장 분석을 분석할 수 있습니다. 귀하가 원하는 형식과 데이터 스타일로 필요한 만큼 많은 경쟁자를 추가할 수 있습니다. 저희 분석가 팀은 또한 원시 엑셀 파일 피벗 테이블(팩트북)로 데이터를 제공하거나 보고서에서 사용 가능한 데이터 세트에서 프레젠테이션을 만드는 데 도움을 줄 수 있습니다.

