Asia Pacific Lightweight Metals Market
Tamanho do mercado em biliões de dólares
CAGR :
% 
 USD
58.84 Billion
USD
682.61 Billion
2024
2052
USD
58.84 Billion
USD
682.61 Billion
2024
2052
| 2025 –2052 | |
| USD 58.84 Billion | |
| USD 682.61 Billion | |
| % | |
|
Segmentação do mercado de metais leves da Ásia-Pacífico, por tipo (alumínio e liga de alumínio, titânio e ligas de titânio, magnésio e liga de magnésio, berílio e liga de berílio, aço e ligas de aço e outros), aplicação (automotivo e transporte, aeroespacial e defesa, agricultura, eletrônicos e bens de consumo, marítimo e outros) - Tendências e previsões do setor até 2052
Tamanho do mercado de metais leves da Ásia-Pacífico
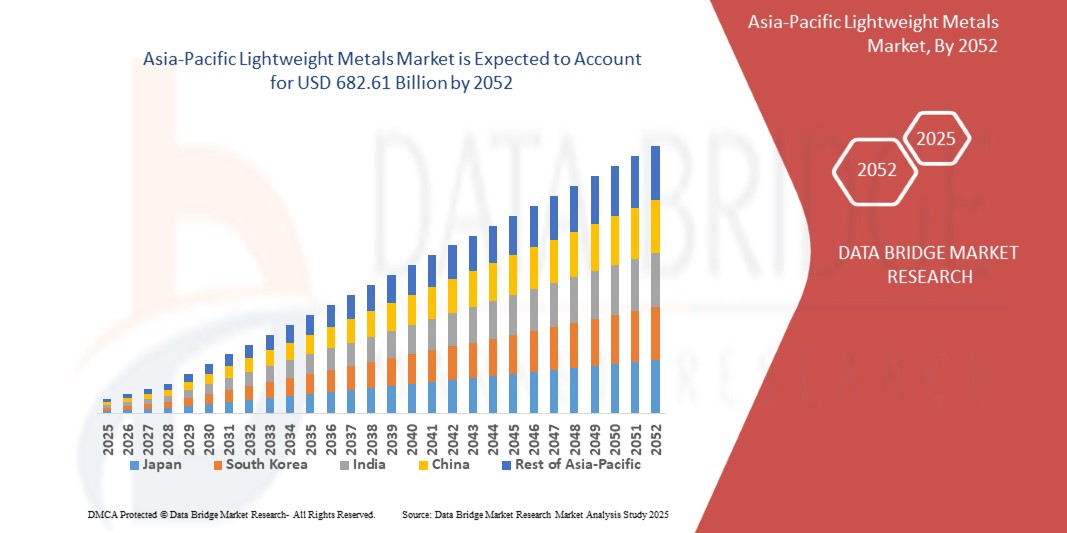
- O tamanho do mercado de metais leves da Ásia-Pacífico foi avaliado em US$ 58,84 bilhões em 2024 e deve atingir US$ 682,61 bilhões até 2052 , com um CAGR de 9,2% durante o período previsto.
- O crescimento do mercado é amplamente impulsionado pela crescente demanda nos setores automotivo e aeroespacial
- Além disso, a adoção de metais leves em bens de consumo duráveis e eletrodomésticos está aumentando. Esses fatores convergentes estão acelerando a adoção de soluções em metais leves, impulsionando significativamente o crescimento do setor.
Análise do Mercado de Metais Leves da Ásia-Pacífico
- Metais leves estão ganhando destaque devido ao seu papel essencial em indústrias como automotiva, aeroespacial, construção e eletrônicos de consumo, onde a redução do peso dos componentes é crucial para melhorar a eficiência de combustível, o desempenho e a sustentabilidade.
- A crescente ênfase em eficiência de combustível, regulamentações de emissões de carbono e a transição da região Ásia-Pacífico para veículos elétricos (VEs) estão impulsionando significativamente a demanda por metais leves, como alumínio, magnésio e titânio. Além disso, os avanços em metalurgia e tecnologias de processamento de metais estão permitindo a produção de materiais mais fortes, leves e resistentes à corrosão.
- A China domina o mercado de metais leves da Ásia-Pacífico, detendo a maior participação na receita de 45,81% em 2025, atribuída às robustas indústrias aeroespacial e automotiva, à crescente adoção de veículos elétricos, à forte infraestrutura de fabricação e aos investimentos contínuos em tecnologias avançadas de materiais.
- A projeção é que a China seja a região de crescimento mais rápido no mercado durante o período previsto, impulsionada por regulamentações ambientais rigorosas que promovem redução de peso, aumento da produção de veículos elétricos e híbridos e um forte foco em sustentabilidade e práticas de fabricação ecológicas.
- Espera-se que o segmento de alumínio e ligas de alumínio domine o mercado de metais leves da Ásia-Pacífico, com uma participação de mercado de 54,06% em 2025, devido à sua versatilidade, reciclabilidade e amplo uso em vários setores, incluindo automotivo, embalagens, aeroespacial e construção, apoiado ainda pela crescente demanda da Ásia-Pacífico por soluções sustentáveis e com eficiência energética.
Escopo do relatório e segmentação do mercado de metais leves da Ásia-Pacífico
|
Atributos |
Principais insights do mercado de metais leves |
|
Segmentos abrangidos |
|
|
Países abrangidos |
Ásia-Pacífico
|
|
Principais participantes do mercado |
|
|
Oportunidades de mercado |
|
|
Conjuntos de informações de dados de valor agregado |
Além dos insights sobre cenários de mercado, como valor de mercado, taxa de crescimento, segmentação, cobertura geográfica e principais participantes, os relatórios de mercado selecionados pela Data Bridge Market Research também incluem análise de importação e exportação, visão geral da capacidade de produção, análise de consumo de produção, análise de tendência de preço, cenário de mudança climática, análise da cadeia de suprimentos, análise da cadeia de valor, visão geral de matéria-prima/consumíveis, critérios de seleção de fornecedores, análise PESTLE, análise de Porter e estrutura regulatória. |
Tendências do mercado de metais leves da Ásia-Pacífico
Aumento da demanda nos setores automotivo e aeroespacial
- Uma grande força motriz por trás do mercado de metais leves da Ásia-Pacífico é o impulso crescente para eficiência de combustível, redução de emissões e otimização de desempenho, particularmente nas indústrias automotiva e aeroespacial, impulsionado por preocupações ambientais e mandatos regulatórios em todas as regiões
- Por exemplo, em maio de 2021, os pesquisadores Jovan Tan e Seeram Ramakrishna publicaram uma revisão abrangente destacando o apelo do magnésio em termos de engenharia, citando sua leveza, alta relação resistência-peso e excelente usinabilidade. Essas características o tornam ideal para aplicações automotivas e aeroespaciais focadas em eficiência energética e redução de emissões.
- No setor automotivo, a transição para veículos elétricos (VEs) aumentou significativamente a demanda por metais leves. As montadoras agora estão incorporando painéis de carroceria de alumínio, peças estruturais de magnésio e ligas metálicas em componentes essenciais como chassis, armações e sistemas de suspensão para compensar o peso da bateria e aumentar a autonomia do veículo.
- Enquanto isso, a indústria aeroespacial continua a adotar ligas avançadas de alumínio-lítio e componentes de titânio para reduzir o peso de decolagem, melhorar a economia de combustível e prolongar a vida útil das aeronaves. Com o aumento das viagens aéreas globais e da produção de veículos elétricos, espera-se que os metais leves permaneçam em alta demanda.
- De acordo com um comunicado à imprensa da Industry Outlook Manufacturing, o alumínio e o magnésio estão sendo rapidamente adotados no design de veículos, proporcionando uma melhoria de 6% a 8% na economia de combustível para cada 10% de redução no peso do veículo. Sua acessibilidade e desempenho estrutural os tornam especialmente adequados para veículos elétricos em comparação com o aço tradicional.
- A crescente demanda dos setores automotivo e aeroespacial, aliada aos avanços na manufatura aditiva e na inovação em ligas metálicas, está acelerando a adoção de metais leves em todo o mundo. À medida que as indústrias priorizam a mobilidade sustentável e as aeronaves de última geração, o papel do alumínio, magnésio e titânio continua a se expandir em aplicações tradicionais e emergentes.
Dinâmica do Mercado de Metais Leves da Ásia-Pacífico
Motorista
Adoção crescente de bens de consumo duráveis e eletrodomésticos
- A crescente demanda por metais leves é significativamente impulsionada pela crescente preferência do consumidor por aparelhos leves, duráveis e com baixo consumo de energia, que estejam alinhados às metas de sustentabilidade e às expectativas de desempenho no setor de bens de consumo duráveis.
- Por exemplo, uma publicação no blog da Associação Internacional de Magnésio enfatizou a crescente demanda por dispositivos compactos e transportáveis, com as ligas de magnésio substituindo cada vez mais os plásticos. O magnésio oferece leveza comparável, resistência significativamente maior, transferência de calor superior e proteção contra interferências eletromagnéticas e de radiofrequência, tornando-o ideal para aparelhos modernos.
- Metais leves como alumínio e magnésio são amplamente utilizados em geladeiras, máquinas de lavar, condicionadores de ar e eletrodomésticos de cozinha devido à sua resistência à corrosão, melhor gerenciamento térmico e flexibilidade de design. Esses benefícios facilitam o transporte e a instalação, reduzindo os custos gerais de envio e as emissões de carbono.
- Em uma publicação no blog da Magnum Austrália, o magnésio e outras ligas leves foram citados como alternativas superiores aos plásticos, graças à sua resistência, dissipação de calor e blindagem eletromagnética. A aplicação de magnésio pela Sony, em novembro de 2023, na estrutura interna da lente FE 300mm F2.8 GM OSS reforça ainda mais o papel crescente do metal em eletrônicos de consumo avançados.
- Além disso, Bleno destacou a crescente popularidade do alumínio em armários de cozinha modernos, onde é apreciado por sua aparência elegante, resistência e resistência à corrosão. Esses atributos o tornam um material ideal para projetos de cozinhas contemporâneas que exigem uma combinação de estética e funcionalidade.
- Além de aparelhos, as ligas de titânio também estão sendo cada vez mais adotadas em equipamentos biomédicos, conforme observado em um artigo publicado em dezembro de 2023 pela Biblioteca Nacional de Medicina. A excelente biocompatibilidade, resistência e resistência à corrosão do material impulsionaram seu uso em implantes ortopédicos, dispositivos odontológicos e aplicações cardiovasculares, com tecnologias de produção frequentemente sobrepondo-se às do mercado de bens de consumo duráveis de alto padrão.
- A crescente adoção de alumínio e magnésio em eletrodomésticos é ainda apoiada por iniciativas regulatórias e padrões voluntários como o ENERGY STAR, que pressionam os fabricantes a atingir padrões de eficiência mais elevados. À medida que a P&D em desenvolvimento de ligas e a inovação em design prosseguem, os metais leves estão se tornando essenciais para a criação de eletrodomésticos que atendem às demandas dos consumidores e aos padrões ambientais, reforçando seu papel no crescimento sustentado do mercado de metais leves da Ásia-Pacífico.
Oportunidade
Avanços na Reciclagem e Produção de Metais Verdes
- O foco crescente na sustentabilidade e na economia circular está impulsionando a demanda por metais leves produzidos por meio de métodos de baixa emissão e sistemas de reciclagem de circuito fechado.
- Tecnologias avançadas — como a classificação de ligas orientada por IA, a fundição alimentada por energia solar e a recuperação de escória — estão permitindo a produção de alumínio e magnésio reciclados de alta pureza para uso nos setores automotivo, aeroespacial e de construção.
- Governos e corporações estão apoiando iniciativas de metais verdes por meio de incentivos políticos, compras focadas em ESG e investimentos em infraestrutura de baixo carbono.
- Em 2024, a Emirates Global Aluminium (EGA) tornou-se a primeira a produzir alumínio comercialmente usando energia solar (CelestiAL), reduzindo significativamente as emissões associadas aos processos tradicionais de fundição
- Em fevereiro de 2025, uma pesquisa publicada em Resources, Conservation & Recycling introduziu um sistema baseado em CNN com recursos SIFT e HOG para classificar sucata de liga de alumínio com mais de 90% de precisão, melhorando a eficiência da reciclagem
- O projeto RAD4AL, apoiado pela UE, desenvolveu a primeira linha de revestimento de bobinas de alumínio de cura por radiação da Europa, eliminando fornos a gás natural e solventes VOC, melhorando drasticamente a eficiência energética e reduzindo as emissões.
Restrição/Desafio
Altos custos de produção e processamento
- Os altos custos de produção e processamento associados à fabricação de metais leves, incluindo alumínio, titânio e magnésio, representam uma barreira significativa à expansão do mercado regional. Esses metais exigem métodos de extração e refino que consomem muita energia, como fundição em alta temperatura, eletrólise e destilação a vácuo, todos os quais demandam infraestrutura avançada e investimentos de capital substanciais.
- Por exemplo, em dezembro de 2023, um estudo intitulado "Titânio: Alto Desempenho, Alto Custo — Barreiras e Desafios para o Uso Amplo", realizado por pesquisadores do CNR-STEMS, na Itália, destacou o processo Kroll como um dos principais fatores que contribuem para o alto custo de produção do titânio. O estudo identificou as inúmeras etapas de extração, a reatividade do titânio com oxigênio e nitrogênio e a baixa usinabilidade devido à baixa condutividade térmica como os principais fatores de custo.
- Além disso, um estudo do MDPI de fevereiro de 2023 explorou as limitações do processo Kroll, enfatizando que a produção de apenas 1 kg de titânio requer aproximadamente 257,78 megajoules de energia. Apesar de ser o padrão da indústria, a ineficiência e as demandas energéticas do processo Kroll prejudicam severamente a escalabilidade e a acessibilidade da produção de titânio.
- A complexidade da produção de metais leves, especialmente em setores como aeroespacial e automotivo, também exige rigoroso controle de qualidade e usinagem de precisão, aumentando os custos de mão de obra e o tempo de processo. Esses fatores impedem a entrada de fabricantes menores e de economias emergentes no mercado e limitam a ampla adoção desses metais em aplicações com custo-benefício.
- Embora a P&D contínua em tecnologias de reciclagem, otimização de ligas e eficiência de fabricação seja promissora, as atuais restrições de energia e custos continuam a reduzir a competitividade, desencorajar investimentos e restringir a penetração no mercado, especialmente em regiões com fornecimento de energia instável ou caro.
- Até que alternativas economicamente viáveis e escaláveis a processos como Hall-Heroult para alumínio e Kroll para titânio se tornem comercialmente viáveis, a alta estrutura de custos continuará sendo uma restrição central no mercado de metais leves da Ásia-Pacífico. Superar esses desafios será essencial para desbloquear uma adoção mais ampla em diversos setores de uso final.
Escopo do mercado de metais leves da Ásia-Pacífico
O mercado é segmentado com base no tipo e na aplicação.
- Por tipo
Com base no tipo, o mercado é segmentado em alumínio e ligas de alumínio, titânio e ligas de titânio, magnésio e ligas de magnésio, berílio e ligas de berílio, aço e ligas de aço, entre outros. Em 2025, o segmento de alumínio e ligas de alumínio dominará o mercado, com uma participação de mercado de 54,06%, impulsionada por sua ampla utilização nos setores automotivo, aeroespacial, de embalagens e construção civil. Os principais fatores incluem a leveza do alumínio, a resistência à corrosão, a alta reciclabilidade e a adaptabilidade para aplicações sustentáveis e com eficiência energética.
Espera-se que o segmento de alumínio e ligas de alumínio testemunhe a taxa de crescimento mais rápida de 9,4% entre 2025 e 2052, impulsionado por sua crescente adoção nos setores aeroespacial, de implantes médicos e de defesa devido à alta relação resistência-peso, biocompatibilidade e resistência superior a ambientes extremos.
- Por aplicação
Com base na aplicação, o mercado é segmentado em automotivo e transporte, aeroespacial e defesa, agricultura, eletrônicos e bens de consumo, marítimo e outros. Espera-se que o segmento automotivo e de transporte detenha a maior participação de mercado, com 39,41% da receita em 2025, impulsionado pela ampla adoção de metais leves para aumentar a eficiência de combustível, reduzir as emissões e atender aos rigorosos padrões regulatórios. A crescente mudança para veículos elétricos (VEs) e o aumento do uso de materiais como alumínio e magnésio em estruturas de carroceria e componentes do trem de força impulsionaram ainda mais o crescimento do segmento.
Espera-se que o segmento automotivo e de transporte testemunhe o CAGR mais rápido de 9,6% entre 2025 e 2052, impulsionado pela crescente demanda por aeronaves de última geração, maiores esforços de modernização militar e uso de ligas de titânio e alumínio-lítio para reduzir o peso das aeronaves, melhorar o desempenho e melhorar a eficiência de combustível.
Análise regional do mercado de metais leves da Ásia-Pacífico
- A Ásia-Pacífico é o segundo maior mercado para metais leves, detendo uma participação substancial na receita em 2025 e está projetada para crescer a uma CAGR máxima de 9,2% de 2025 a 2052. O crescimento da região é impulsionado por regulamentações rigorosas de emissões, crescente adoção da mobilidade elétrica e maiores investimentos em tecnologias leves nos setores automotivo, aeroespacial e de bens de consumo.
- A região da Ásia-Pacífico se beneficia de políticas sólidas, como o Acordo Verde e o pacote Fit for 55, que incentivam a redução de peso dos veículos e a eficiência energética. Além disso, colaborações entre fabricantes de equipamentos originais (OEMs) e inovadores em ciência de materiais, bem como programas de P&D apoiados pelo governo, estão impulsionando avanços tecnológicos em aplicações de alumínio, titânio e magnésio.
- Países como China, Japão, Índia, Coreia do Sul, Austrália, Tailândia, Indonésia, Taiwan, Malásia, Vietnã, Filipinas e Cingapura lideram a região com adoção em larga escala de materiais leves em setores-chave e infraestruturas de fabricação robustas.
Visão do mercado de metais leves da China e da Ásia-Pacífico
A China foi responsável pela maior fatia de receita de mercado de 45,81% na Ásia-Pacífico em 2025, devido à sua liderança na fabricação automotiva, forte presença de fornecedores aeroespaciais de primeiro nível e investimentos contínuos em P&D de materiais avançados.
Visão geral do mercado de metais leves da Ásia-Pacífico no Japão
A projeção é de que o Japão apresente um CAGR notável entre 2025 e 2032, impulsionado por avanços nos setores aeroespacial e de defesa, além de forte inovação nacional em tecnologias de materiais leves. Iniciativas governamentais que promovem a aviação verde, a manufatura sustentável e práticas de economia circular estão acelerando a demanda por ligas e compósitos de alto desempenho em setores-chave.
Visão do mercado de metais leves da Índia e Ásia-Pacífico
A Índia está emergindo como um importante contribuinte para o mercado de metais leves da região Ásia-Pacífico, apoiada por programas de eletrificação automotiva, centros de inovação em materiais sustentáveis e parcerias público-privadas. Com financiamento significativo para veículos de energia limpa e modernização da defesa,
Participação no mercado de metais leves da Ásia-Pacífico
A indústria de metais leves é liderada principalmente por empresas bem estabelecidas, incluindo:
- China Hongqiao Group Limited (China)
- Hindalco Industries Ltd. (Índia)
- thyssenkrupp Steel Europe (Alemanha)
- AMETEK Inc. (EUA)
- Vedanta Limited (Índia)
- Rio Tinto (Reino Unido/Austrália)
- Norsk Hydro ASA (Noruega)
- Tata Steel (Índia)
- Corporação VSMPO-AVISMA (Rússia)
- Emirates Global Aluminium PJSC (Emirados Árabes Unidos)
- POSCO (Coreia do Sul)
- RusAL (Rússia)
- ICL (Israel)
- Toho Titanium Co., Ltd (Japão)
- Western Superconducting Technologies Co., Ltd (China)
Últimos desenvolvimentos no mercado de metais leves da Ásia-Pacífico
- Em janeiro de 2025, a filial de Alumina Second em Hongqiao implementou protocolos avançados de testes para aprimorar significativamente a qualidade e a eficiência de seus processos de produção. A iniciativa se concentra em controles de qualidade mais rigorosos, análise de dados mais rápida e calibração aprimorada de equipamentos. Como resultado, a filial alcançou maior consistência nos padrões dos produtos e minimizou os defeitos. Essa mudança reflete o compromisso de Hongqiao com alto desempenho, segurança operacional e satisfação do cliente. Treinamento contínuo e instalações laboratoriais modernizadas também contribuem significativamente para essa melhoria.
- Em junho de 2025, a Hindalco adquiriu a AluChem Companies, Inc., com sede nos Estados Unidos, por US$ 125 milhões por meio de sua subsidiária, Aditya Holdings LLC. A AluChem, produtora de alumina de alta pureza, agrega valor estratégico à expansão global da Hindalco no segmento de alumina de alta tecnologia. Essa aquisição fortalece o foco da Hindalco em produtos de valor agregado, impulsionado pelo forte crescimento e lucratividade de seu negócio atual de alumina especial.
- Em outubro de 2024, a thyssenkrupp Steel aprimorou seu Bluemint Steel, produzindo aço com baixo teor de CO₂ a partir de sucata em altos-fornos. Isso ajuda tanto a empresa quanto seus clientes a reduzir a pegada de carbono. Aços de alto desempenho e ultra-alta resistência também estão sendo desenvolvidos, permitindo veículos mais leves e seguros, com melhor eficiência de combustível e desempenho.
- Em julho de 2025, o presidente do Grupo Tata, N. Chandrasekaran, marcou o lançamento da pedra fundamental do novo Forno a Arco Elétrico (FEA) da Tata Steel UK em Port Talbot. Este projeto de aço verde de US$ 2,25 milhões, apoiado por £ 500 milhões do Governo do Reino Unido, visa reduzir as emissões de carbono em 90% e garantir 5.000 empregos. O FEA será um dos maiores do mundo, produzindo 3 milhões de toneladas de aço de baixo carbono anualmente. A iniciativa marca um passo importante na estratégia de descarbonização e transformação industrial da Tata no Reino Unido.
- Em abril de 2024, a Vedanta Aluminium sediou o conclave Auto-Edge para promover o uso do alumínio na indústria automotiva. O evento reuniu as principais empresas automotivas para discutir o futuro da mobilidade e o papel dos metais leves. A Vedanta apresentou sua diversificada gama de produtos, incluindo ligas de alumínio para a fabricação de veículos.
SKU-
Obtenha acesso online ao relatório sobre a primeira nuvem de inteligência de mercado do mundo

- Painel interativo de análise de dados
- Painel de análise da empresa para oportunidades de elevado potencial de crescimento
- Acesso de analista de pesquisa para personalização e customização. consultas
- Análise da concorrência com painel interativo
- Últimas notícias, atualizações e atualizações Análise de tendências
- Aproveite o poder da análise de benchmark para um rastreio abrangente da concorrência
Índice
1 INTRODUÇÃO
1.1 OBJETIVOS DO ESTUDO
1.2 DEFINIÇÃO DE MERCADO
1.3 VISÃO GERAL
1.4 LIMITAÇÕES
1,5 MERCADOS COBERTOS
2 SEGMENTAÇÃO DE MERCADO
2.1 MERCADOS COBERTOS
2.2 ÂMBITO GEOGRÁFICO
2,3 ANOS CONSIDERADOS PARA O ESTUDO
2.4 MOEDA E PREÇOS
2.5 MODELO DE VALIDAÇÃO DE DADOS TRIPÉ DBMR
2.6 MODELAGEM MULTIVARIADA
2.7 ENTREVISTAS PRINCIPAIS COM PRINCIPAIS LÍDERES DE OPINIÃO
2.8 GRADE DE POSIÇÃO DE MERCADO DBMR
2.9 ANÁLISE DE PARTICIPAÇÃO DE FORNECEDORES DBMR
2.1 GRADE DE COBERTURA DE APLICAÇÃO DE MERCADO
2.11 FONTES SECUNDÁRIAS
3 RESUMO EXECUTIVO
4 INSIGHTS PREMIUM
4.1 AS CINCO FORÇAS DE PORTER
4.1.1 AMEAÇA DE NOVOS ENTRADANTES
4.1.2 PODER DE BARGANHA DOS FORNECEDORES
4.1.3 PODER DE BARGANHA DOS COMPRADORES
4.1.4 AMEAÇA DE SUBSTITUTOS
4.1.5 RIVALIDADE DA INDÚSTRIA
4.2 ANÁLISE DE PRODUÇÃO E CONSUMO
4.3 ANÁLISE DA CADEIA DE VALOR: MERCADO DE METAIS LEVES DA ÁSIA-PACÍFICO
4.3.1 AQUISIÇÃO:
4.3.2 FABRICAÇÃO:
4.3.3 MARKETING E DISTRIBUIÇÃO:
4.4 CRITÉRIOS DE SELEÇÃO DE FORNECEDORES
4.4.1 QUALIDADE E CONSISTÊNCIA DO FORNECIMENTO
4.4.2 CONFIABILIDADE E PONTUALIDADE
4.4.3 COMPETITIVIDADE DE CUSTOS
4.4.4 CAPACIDADE TÉCNICA E INOVAÇÃO
4.4.5 CONFORMIDADE REGULAMENTAR E SUSTENTABILIDADE
4.4.6 ESTABILIDADE FINANCEIRA
4.4.7 ATENDIMENTO E SUPORTE AO CLIENTE
4.5 PERSPECTIVA DA MARCA
4.5.1 ANÁLISE COMPETITIVA DE MARCAS DO MERCADO DE METAIS LEVES DA ÁSIA-PACÍFICO
4.5.2 VISÃO GERAL DO PRODUTO VS MARCA
4.5.3 VISÃO GERAL DO PRODUTO
4.5.4 VISÃO GERAL DA MARCA
4.5.5 CONCLUSÃO
4.6 CENÁRIO DE MUDANÇAS CLIMÁTICAS
4.6.1 PREOCUPAÇÕES AMBIENTAIS
4.6.2 RESPOSTA DA INDÚSTRIA
4.6.3 PAPEL DO GOVERNO
4.6.4 RECOMENDAÇÕES DO ANALISTA
4.7 DETALHAMENTO DA ANÁLISE DE CUSTOS
4.7.1 MATÉRIAS-PRIMAS
4.7.2 CONSUMO DE ENERGIA
4.7.3 CUSTOS DE MÃO DE OBRA E OPERACIONAIS
4.7.4 PESQUISA E DESENVOLVIMENTO
4.8 ANÁLISE DO ECOSSISTEMA DA INDÚSTRIA
4.8.1 EMPRESAS DE DESTAQUE
4.8.2 PEQUENAS E MÉDIAS EMPRESAS
4.8.3 USUÁRIOS FINAIS
4.8.4 PESQUISA E DESENVOLVIMENTO
4.9 ANÁLISE DA CADEIA DE SUPRIMENTOS
4.9.1 VISÃO GERAL
4.9.2 CENÁRIO DE CUSTOS LOGÍSTICOS
4.9.3 IMPORTÂNCIA DOS PRESTADORES DE SERVIÇOS LOGÍSTICOS
4.1 CENÁRIO DE MUDANÇAS CLIMÁTICAS
4.10.1 PREOCUPAÇÕES AMBIENTAIS
4.10.2 RESPOSTA DA INDÚSTRIA
4.10.3 PAPEL DO GOVERNO
4.10.4 RECOMENDAÇÕES DO ANALISTA
4.11 COMPORTAMENTO DE COMPRA DO CONSUMIDOR
4.12 CENÁRIO DE MARGENS DE LUCRO
4.12.1 FAIXA DE MARGEM POR TIPO DE PRODUTO
4.12.2 FATORES-CHAVE QUE INFLUENCIAM AS MARGENS
4.12.3 MARGENS DO MERCADO DOMÉSTICO VS. EXPORTAÇÃO
4.13 ANÁLISE DE FORNECIMENTO DE MATÉRIA-PRIMA NO MERCADO DE METAIS LEVES DA ÁSIA-PACÍFICO
4.13.1 ALUMÍNIO
4.13.2 MAGNÉSIO
4.13.3 TITÂNIO
4.13.4 BERÍLIO
4.13.5 COMPÓSITOS DE MATRIZ DE CARBONO E METÁLICA (ADITIVOS)
4.13.6 CONCLUSÃO
4.14 AVANÇOS TECNOLÓGICOS
4.14.1 VISÃO GERAL
4.14.2 DESENVOLVIMENTO AVANÇADO DE LIGAS
4.14.3 INOVAÇÕES EM PROCESSOS METALÚRGICOS
4.14.4 ENGENHARIA DE SUPERFÍCIES E REVESTIMENTOS
4.14.5 TECNOLOGIAS DE RECICLAGEM E FABRICAÇÃO CIRCULAR
4.14.6 FERRAMENTAS DE SIMULAÇÃO E PROJETO LEVES E INTEGRADAS
4.15 TARIFAS E SEU IMPACTO NO MERCADO
4.15.1 TARIFAS ATUAIS NOS 5 PRINCIPAIS MERCADOS DO PAÍS
4.15.2 PERSPECTIVAS: PRODUÇÃO LOCAL VS DEPENDÊNCIA DE IMPORTAÇÕES
4.15.3 DINÂMICA DOS CRITÉRIOS DE SELEÇÃO DE FORNECEDORES
4.15.4 IMPACTO NA CADEIA DE SUPRIMENTOS
4.15.4.1 AQUISIÇÃO DE MATÉRIA-PRIMA
4.15.4.2 FABRICAÇÃO E PRODUÇÃO
4.15.4.3 LOGÍSTICA E DISTRIBUIÇÃO
4.15.4.4 PREÇO DE APRESENTAÇÃO E POSICIONAMENTO DE MERCADO
4.15.5 PARTICIPANTES DA INDÚSTRIA: MOVIMENTOS PROATIVOS
4.15.5.1 OTIMIZAÇÃO DA CADEIA DE SUPRIMENTOS
4.15.5.2 ESTABELECIMENTOS DE JOINT VENTURE
4.15.6 IMPACTO NOS PREÇOS
4.15.7 INCLINAÇÃO REGULAMENTAR
4.15.7.1 SITUAÇÃO GEOPOLÍTICA
4.15.7.2 PARCERIAS COMERCIAIS ENTRE PAÍSES
4.15.7.2.1 ACORDOS DE LIVRE COMÉRCIO
4.15.7.2.2 ESTABELECIMENTOS DE ALIANÇA
4.15.7.2.3 ACREDITAÇÃO DE STATUS (INCLUINDO MFN)
4.15.7.3 CURSO CORRETIVO DOMÉSTICO
4.15.7.3.1 REGIMES DE INCENTIVO PARA AUMENTAR A PRODUÇÃO
4.15.7.3.2 CRIAÇÃO DE ZONAS ECONÔMICAS ESPECIAIS / PARQUES INDUSTRIAIS
5 COBERTURA REGULAMENTAR
6 VISÃO GERAL DO MERCADO
6.1 MOTORISTAS
6.1.1 CRESCENTE DEMANDA NOS SETORES AUTOMOTIVO E AEROESPACIAL
6.1.2 ADOÇÃO CRESCENTE DE BENS E ELETRODOMÉSTICOS DE CONSUMO DURÁVEIS
6.1.3 CRESCENTE DEMANDA POR VEÍCULOS COM EFICIÊNCIA DE COMBUSTÍVEL EM TODO O MUNDO
6.1.4 INICIATIVAS REGULAMENTARES QUE APOIAM O DESIGN LEVE
6.2 RESTRIÇÕES
6.2.1 ALTOS CUSTOS DE PRODUÇÃO E PROCESSAMENTO
6.2.2 SENSIBILIDADE À CORROSÃO E LIMITAÇÕES DA LIGA
6.3 OPORTUNIDADES
6.3.1 AUMENTO DA PENETRAÇÃO DE VEÍCULOS ELÉTRICOS EM TODO O MUNDO
6.3.2 AVANÇOS NA RECICLAGEM E NA PRODUÇÃO DE METAL VERDE
6.3.3 A INDÚSTRIA MARÍTIMA ESTÁ MUDANDO PARA PROJETOS OTIMIZADOS EM FUNCIONAMENTO DO PESO
6.4 DESAFIOS
6.4.1 DISPONIBILIDADE DE MATÉRIA-PRIMA E DEPENDÊNCIA GEOPOLÍTICA
6.4.2 PROBLEMAS DE COMPATIBILIDADE COM EQUIPAMENTOS DE FABRICAÇÃO TRADICIONAIS
7 MERCADO DE METAIS LEVES DA ÁSIA-PACÍFICO, POR TIPO
7.1 VISÃO GERAL
7.2 ALUMÍNIO E LIGAS DE ALUMÍNIO
7.3 TITÂNIO E LIGAS DE TITÂNIO
7.4 MAGNÉSIO E LIGA DE MAGNÉSIO
7.5 AÇO E LIGAS DE AÇO
7.6 BERÍLIO E LIGA DE BERÍLIO
7.7 OUTROS
8 MERCADO DE METAIS LEVES DA ÁSIA-PACÍFICO, POR APLICAÇÃO
8.1 VISÃO GERAL
8.2 AUTOMOTIVO E TRANSPORTE
8.3 AEROESPACIAL E DEFESA
8.4 ELETRÔNICOS E BENS DE CONSUMO
8.5 MARINHO
8.6 AGRICULTURA
8.7 OUTROS
9 MERCADO DE METAIS LEVES DA ÁSIA-PACÍFICO, POR REGIÃO
9.1 ÁSIA-PACÍFICO
9.1.1 CHINA
9.1.2 JAPÃO
9.1.3 ÍNDIA
9.1.4 COREIA DO SUL
9.1.5 AUSTRÁLIA
9.1.6 TAILÂNDIA
9.1.7 INDONÉSIA
9.1.8 TAIWAN
9.1.9 MALÁSIA
9.1.10 VIETNÃ
9.1.11 FILIPINAS
9.1.12 SINGAPURA
9.1.13 RESTANTE DA ÁSIA-PACÍFICO
10 MERCADO DE METAIS LEVES DA ÁSIA-PACÍFICO: CENÁRIO DA EMPRESA
10.1 ANÁLISE DE AÇÕES DA EMPRESA: ÁSIA-PACÍFICO
11 ANÁLISE SWOT
12 PERFIS DE EMPRESAS
12.1 CHINA HONGQIAO GROUP LIMITADA
12.1.1 RESUMO DA EMPRESA
12.1.2 DADOS FINANCEIROS RECENTES
12.1.3 ANÁLISE DAS AÇÕES DA EMPRESA
12.1.4 PORTFÓLIO DE PRODUTOS
12.1.5 DESENVOLVIMENTO RECENTE
12.2 HINDALCO INDUSTRIES LTD.
12.2.1 RESUMO DA EMPRESA
12.2.2 ANÁLISE DE RECEITA
12.2.3 ANÁLISE DAS AÇÕES DA EMPRESA
12.2.4 PORTFÓLIO DE PRODUTOS
12.2.5 DESENVOLVIMENTO RECENTE
12.3 THYSSENKRUPP AÇO EUROPA
12.3.1 RESUMO DA EMPRESA
12.3.2 ANÁLISE DAS AÇÕES DA EMPRESA
12.3.3 PORTFÓLIO DE PRODUTOS
12.3.4 DESENVOLVIMENTO RECENTE
12.4 AMETEK INC.
12.4.1 RESUMO DA EMPRESA
12.4.2 DADOS FINANCEIROS RECENTES
12.4.3 ANÁLISE DAS AÇÕES DA EMPRESA
12.4.4 PORTFÓLIO DE PRODUTOS
12.4.5 DESENVOLVIMENTO RECENTE
12.5 VEDANTA LIMITADA
12.5.1 RESUMO DA EMPRESA
12.5.2 ANÁLISE DE RECEITA
12.5.3 ANÁLISE DAS AÇÕES DA EMPRESA
12.5.4 PORTFÓLIO DE PRODUTOS
12.5.5 DESENVOLVIMENTO RECENTE
12.6 ALCOA CORPORATION
12.6.1 RESUMO DA EMPRESA
12.6.2 ANÁLISE DE RECEITA
12.6.3 PORTFÓLIO DE PRODUTOS
12.6.4 DESENVOLVIMENTO/NOTÍCIAS RECENTES
12.7 ARCELORMITTAL
12.7.1 RESUMO DA EMPRESA
12.7.2 ANÁLISE DE RECEITA
12.7.3 PORTFÓLIO DE PRODUTOS
12.7.4 DESENVOLVIMENTO RECENTE
12.8 AMAG ÁUSTRIA METALL AG
12.8.1 RESUMO DA EMPRESA
12.8.2 ANÁLISE DE RECEITA
12.8.3 PORTFÓLIO DE PRODUTOS
12.8.4 DESENVOLVIMENTO RECENTE
12.9 AMETEK PRODUTOS METÁLICOS ESPECIAIS (AMETEK INC.)
12.9.1 RESUMO DA EMPRESA
12.9.2 PORTFÓLIO DE PRODUTOS
12.9.3 DESENVOLVIMENTOS RECENTES
12.1 ATI, INC.
12.10.1 RESUMO DA EMPRESA
12.10.2 ANÁLISE DE RECEITA
12.10.3 PORTFÓLIO DE PRODUTOS
12.10.4 DESENVOLVIMENTO RECENTE
12.11 ATLAS STEELS
12.11.1 RESUMO DA EMPRESA
12.11.2 PORTFÓLIO DE PRODUTOS
12.11.3 DESENVOLVIMENTOS/NOTÍCIAS RECENTES
12.12 BAVARIA STAHL UND METAL IMPORT/EXPORT GMBH
12.12.1 RESUMO DA EMPRESA
12.12.2 PORTFÓLIO DE PRODUTOS
12.12.3 DESENVOLVIMENTOS/NOTÍCIAS RECENTES
12.13 COSTELLIUM
12.13.1 RESUMO DA EMPRESA
12.13.2 ANÁLISE DE RECEITA
12.13.3 PORTFÓLIO DE PRODUTOS
12.13.4 DESENVOLVIMENTO RECENTE
12.14 CLINTON ALUMÍNIO
12.14.1 RESUMO DA EMPRESA
12.14.2 PORTFÓLIO DE PRODUTOS
12.14.3 DESENVOLVIMENTO RECENTE
12.15 CORPORAÇÃO VSMPO-AVISMA
12.15.1 RESUMO DA EMPRESA
12.15.2 PORTFÓLIO DE PRODUTOS
12.15.3 DESENVOLVIMENTO RECENTE
12.16 DWA ALUMINIUM COMPOSITES EUA, INC
12.16.1 RESUMO DA EMPRESA
12.16.2 PORTFÓLIO DE PRODUTOS
12.16.3 DESENVOLVIMENTO RECENTE
12.17 EMIRATES ÁSIA-PACÍFICO ALUMÍNIO PJSC
12.17.1 RESUMO DA EMPRESA
12.17.2 PORTFÓLIO DE PRODUTOS
12.17.3 DESENVOLVIMENTO RECENTE
12.18 ICL
12.18.1 RESUMO DA EMPRESA
12.18.2 ANÁLISE DE RECEITA
12.18.3 PORTFÓLIO DE PRODUTOS
12.18.4 DESENVOLVIMENTOS/NOTÍCIAS RECENTES
12.19 KAISER ALUMÍNIO
12.19.1 RESUMO DA EMPRESA
12.19.2 ANÁLISE DE RECEITA
12.19.3 PORTFÓLIO DE PRODUTOS
12.19.4 DESENVOLVIMENTO RECENTE
12.2 LUXFER HOLDINGS PLC
12.20.1 RESUMO DA EMPRESA
12.20.2 ANÁLISE DE RECEITA
12.20.3 PORTFÓLIO DE PRODUTOS
12.20.4 DESENVOLVIMENTOS RECENTES
12.21 METALÚRGICAS
12.21.1 RESUMO DA EMPRESA
12.21.2 PORTFÓLIO DE PRODUTOS
12.21.3 DESENVOLVIMENTOS/NOTÍCIAS RECENTES
12.22 CORPORAÇÃO MATERION
12.22.1 RESUMO DA EMPRESA
12.22.2 ANÁLISE DE RECEITA
12.22.3 PORTFÓLIO DE PRODUTOS
12.22.4 DESENVOLVIMENTOS/NOTÍCIAS RECENTES
12.23 MSKS IP INC.
12.23.1 RESUMO DA EMPRESA
12.23.2 PORTFÓLIO DE PRODUTOS
12.23.3 DESENVOLVIMENTO RECENTE
12.24 CORPORAÇÃO NUCOR
12.24.1 RESUMO DA EMPRESA
12.24.2 ANÁLISE DE RECEITA
12.24.3 PORTFÓLIO DE PRODUTOS
12.24.4 DESENVOLVIMENTOS RECENTES
12,25 NORSK HYDRO ASA
12.25.1 RESUMO DA EMPRESA
12.25.2 PORTFÓLIO DE PRODUTOS
12.25.3 DESENVOLVIMENTO/NOTÍCIAS RECENTES
12.26 PRECISION CASTPARTS CORP.
12.26.1 RESUMO DA EMPRESA
12.26.2 PORTFÓLIO DE PRODUTOS
12.26.3 DESENVOLVIMENTO RECENTE
12.27 POSCO
12.27.1 RESUMO DA EMPRESA
12.27.2 ANÁLISE DE RECEITA
12.27.3 PORTFÓLIO DE PRODUTOS
12.27.4 DESENVOLVIMENTOS/NOTÍCIAS RECENTES
12.28 RUSAL
12.28.1 RESUMO DA EMPRESA
12.28.2 ANÁLISE DE RECEITA
12.28.3 PORTFÓLIO DE PRODUTOS
12.28.4 DESENVOLVIMENTO RECENTE
12.29 RIO TINTO
12.29.1 RESUMO DA EMPRESA
12.29.2 ANÁLISE DE RECEITA
12.29.3 PORTFÓLIO DE PRODUTOS
12.29.4 DESENVOLVIMENTO RECENTE
12.3 RELIANCE, INC.
12.30.1 RESUMO DA EMPRESA
12.30.2 ANÁLISE DE RECEITA
12.30.3 PORTFÓLIO DE PRODUTOS
12.30.4 DESENVOLVIMENTO RECENTE
12.31 RYERSON HOLDING CORPORATION
12.31.1 RESUMO DA EMPRESA
12.31.2 ANÁLISE DE RECEITA
12.31.3 PORTFÓLIO DE PRODUTOS
12.31.4 DESENVOLVIMENTOS RECENTES
12.32 SCOPE METALS GROUP LTD.
12.32.1 RESUMO DA EMPRESA
12.32.2 ANÁLISE DE RECEITA
12.32.3 PORTFÓLIO DE PRODUTOS
12.32.4 DESENVOLVIMENTO RECENTE
12.33 SSAB
12.33.1 RESUMO DA EMPRESA
12.33.2 ANÁLISE DE RECEITA
12.33.3 PORTFÓLIO DE PRODUTOS
12.33.4 DESENVOLVIMENTO RECENTE
12.34 SMITHS CENTROS METÁLICOS LIMITADOS
12.34.1 RESUMO DA EMPRESA
12.34.2 PORTFÓLIO DE PRODUTOS
12.34.3 DESENVOLVIMENTO RECENTE
12.35 TW METALS, LLC.
12.35.1 RESUMO DA EMPRESA
12.35.2 PORTFÓLIO DE PRODUTOS
12.35.3 DESENVOLVIMENTO RECENTE
12,36 AÇO TATA
12.36.1 RESUMO DA EMPRESA
12.36.2 INFORMAÇÕES FINANCEIRAS RECENTES
12.36.3 PORTFÓLIO DE PRODUTOS
12.36.4 DESENVOLVIMENTO RECENTE
12.37 THYSSENKRUPP MATERIALS NA, INC.
12.37.1 RESUMO DA EMPRESA
12.37.2 PORTFÓLIO DE PRODUTOS
12.37.3 DESENVOLVIMENTO RECENTE
12.38 TOHO TITANIUM CO., LTD.
12.38.1 RESUMO DA EMPRESA
12.38.2 ANÁLISE DE RECEITA
12.38.3 PORTFÓLIO DE PRODUTOS
12.38.4 DESENVOLVIMENTO RECENTE
12.39 US MAGNÉSIO LLC
12.39.1 RESUMO DA EMPRESA
12.39.2 PORTFÓLIO DE PRODUTOS
12.39.3 DESENVOLVIMENTO RECENTE
12.4 VULCAN INC.
12.40.1 RESUMO DA EMPRESA
12.40.2 PORTFÓLIO DE PRODUTOS
12.40.3 DESENVOLVIMENTO RECENTE
13 QUESTIONÁRIO
14 RELATÓRIOS RELACIONADOS
Lista de Tabela
TABELA 1 COMPORTAMENTO DE COMPRA DO CONSUMIDOR
TABELA 2 COBERTURA REGULAMENTAR
TABELA 3 VENDAS E PARTICIPAÇÃO DE MERCADO DE VEÍCULOS ELÉTRICOS (VE) NA ÁSIA-PACÍFICO (2023–2024)
TABELA 4 COMPARAÇÃO DE PESO ENTRE CHAPA DE SOLDA DE AÇO E ALUMÍNIO (POR 100 PEÇAS)
TABELA 5 COMPARAÇÃO DE PESO ENTRE PLACA DE COBERTURA DE AÇO E ALUMÍNIO (POR 100 PEÇAS)
TABELA 6 MERCADO DE METAIS LEVES DA ÁSIA-PACÍFICO, POR TIPO, 2018-2052 (MIL USD)
TABELA 7 ALUMÍNIO E LIGAS DE ALUMÍNIO DA ÁSIA-PACÍFICO NO MERCADO DE METAIS LEVES, POR REGIÃO, 2018-2052 (MIL USD)
TABELA 8 ALUMÍNIO E LIGAS DE ALUMÍNIO NA ÁSIA-PACÍFICO NO MERCADO DE METAIS LEVES, POR GRAU, 2018-2052 (MIL USD)
TABELA 9 ALUMÍNIO E LIGAS DE ALUMÍNIO DA ÁSIA-PACÍFICO NO MERCADO DE METAIS LEVES, POR APLICAÇÃO, 2018-2052 (MIL USD
TABELA 10 TITÂNIO E LIGAS DE TITÂNIO NA ÁSIA-PACÍFICO NO MERCADO DE METAIS LEVES, POR REGIÃO, 2018-2052 (MIL USD)
TABELA 11 TITÂNIO E LIGAS DE TITÂNIO DA ÁSIA-PACÍFICO NO MERCADO DE METAIS LEVES, POR GRAU, 2018-2052 (MIL USD)
TABELA 12 TITÂNIO E LIGAS DE TITÂNIO NA ÁSIA-PACÍFICO NO MERCADO DE METAIS LEVES, POR APLICAÇÃO, 2018-2052 (MIL USD)
TABELA 13 MAGNÉSIO E LIGAS DE MAGNÉSIO NO MERCADO DE METAIS LEVES DA ÁSIA-PACÍFICO, POR REGIÃO, 2018-2052 (MIL USD)
TABELA 14 MAGNÉSIO E LIGAS DE MAGNÉSIO NO MERCADO DE METAIS LEVES DA ÁSIA-PACÍFICO, POR GRAU, 2018-2052 (MIL USD)
TABELA 15 MAGNÉSIO E LIGAS DE MAGNÉSIO NO MERCADO DE METAIS LEVES DA ÁSIA-PACÍFICO, POR APLICAÇÃO, 2018-2052 (MIL USD)
TABELA 16 AÇO E LIGAS DE AÇO DA ÁSIA-PACÍFICO NO MERCADO DE METAIS LEVES, POR REGIÃO, 2018-2052 (MIL USD)
TABELA 17 AÇO E LIGAS DE AÇO DA ÁSIA-PACÍFICO NO MERCADO DE METAIS LEVES, POR GRAU, 2018-2052 (MIL USD)
TABELA 18 AÇO E LIGAS DE AÇO DA ÁSIA-PACÍFICO NO MERCADO DE METAIS LEVES, POR APLICAÇÃO, 2018-2052 (MIL USD)
TABELA 19 BERÍLIO E LIGAS DE BERÍLIO NO MERCADO DE METAIS LEVES DA ÁSIA-PACÍFICO, POR REGIÃO, 2018-2052 (MIL USD)
TABELA 20 BERÍLIO E LIGAS DE BERÍLIO NA ÁSIA-PACÍFICO NO MERCADO DE METAIS LEVES, POR GRAU, 2018-2052 (MIL USD)
TABELA 21 BERÍLIO E LIGAS DE BERÍLIO NO MERCADO DE METAIS LEVES DA ÁSIA-PACÍFICO, POR APLICAÇÃO, 2018-2052 (MIL USD)
TABELA 22 OUTROS MERCADOS DE METAIS LEVES NA ÁSIA-PACÍFICO, POR REGIÃO, 2018-2052 (MIL USD)
TABELA 23 MERCADO DE METAIS LEVES DA ÁSIA-PACÍFICO, POR APLICAÇÃO, 2018-2052 (MIL USD)
TABELA 24 MERCADO DE METAIS LEVES NA ÁSIA-PACÍFICO AUTOMOTIVO E TRANSPORTE, POR REGIÃO, 2018-2052 (MIL USD)
TABELA 25 MERCADO DE METAIS LEVES NA ÁSIA-PACÍFICO AUTOMOTIVO E TRANSPORTE, POR TIPO, 2018-2052 (MIL USD)
TABELA 26 VEÍCULOS DE PASSAGEIROS DA ÁSIA-PACÍFICO NO MERCADO DE METAIS LEVES, POR TIPO, 2018-2052 (MIL USD)
TABELA 27 MERCADO DE VEÍCULOS ELÉTRICOS DA ÁSIA-PACÍFICO EM METAIS LEVES, POR TIPO, 2018-2052 (MIL USD)
TABELA 28 VEÍCULOS COMERCIAIS LEVES (LCV) DA ÁSIA-PACÍFICO NO MERCADO DE METAIS LEVES, POR TIPO, 2018-2052 (MIL USD)
TABELA 29 VEÍCULOS COMERCIAIS PESADOS (HCV) DA ÁSIA-PACÍFICO NO MERCADO DE METAIS LEVES, POR TIPO, 2018-2052 (MIL USD)
TABELA 30 MERCADO DE METAIS LEVES DA ÁSIA-PACÍFICO, DE DUAS E TRÊS RODAS, POR TIPO, 2018-2052 (MIL USD)
TABELA 31 ÁSIA-PACÍFICO AEROESPACIAL E DEFESA NO MERCADO DE METAIS LEVES, POR REGIÃO, 2018-2052 (MIL USD)
TABELA 32 MERCADO DE METAIS LEVES DA ÁSIA-PACÍFICO AEROESPACIAL E DEFESA, POR APLICAÇÃO, 2018-2052 (MIL USD)
TABELA 33 ELETRÔNICOS E BENS DE CONSUMO DA ÁSIA-PACÍFICO NO MERCADO DE METAIS LEVES, POR REGIÃO, 2018-2052 (MIL USD)
TABELA 34 MERCADO DE METAIS LEVES DA ÁSIA-PACÍFICO AEROESPACIAL E DEFESA, POR APLICAÇÃO, 2018-2052 (MIL USD)
TABELA 35 MERCADO DE ELETRÔNICOS DE CONSUMO DA ÁSIA-PACÍFICO NO MERCADO DE METAIS LEVES, POR PRODUTO, 2018-2052 (MIL USD)
TABELA 36 DISPOSITIVOS PORTÁTEIS DA ÁSIA-PACÍFICO NO MERCADO DE METAIS LEVES, POR PRODUTO, 2018-2052 (MIL USD)
TABELA 37 MERCADO DE EQUIPAMENTOS AUDIOVISUAIS DA ÁSIA-PACÍFICO PARA METAIS LEVES, POR PRODUTO, 2018-2052 (MIL USD)
TABELA 38 ELETRODOMÉSTICOS NO MERCADO DE METAIS LEVES DA ÁSIA-PACÍFICO, POR PRODUTO, 2018-2052 (MIL USD)
TABELA 39 MERCADO DE METAIS LEVES DA ÁSIA-PACÍFICO MARÍTIMO, POR REGIÃO, 2018-2052 (MIL USD)
TABELA 40 MERCADO DE METAIS LEVES DA ÁSIA-PACÍFICO MARÍTIMO, POR APLICAÇÃO, 2018-2052 (MIL USD)
TABELA 41 AGRICULTURA DA ÁSIA-PACÍFICO NO MERCADO DE METAIS LEVES, POR REGIÃO, 2018-2052 (MIL USD)
TABELA 42 AGRICULTURA DA ÁSIA-PACÍFICO NO MERCADO DE METAIS LEVES, POR APLICAÇÃO, 2018-2052 (MIL USD)
TABELA 43 OUTROS MERCADOS DE METAIS LEVES NA ÁSIA-PACÍFICO, POR REGIÃO, 2018-2052 (MIL USD)
TABELA 44 MERCADO DE METAIS LEVES DA ÁSIA-PACÍFICO, POR PAÍS, 2018-2052 (MIL USD)
TABELA 45 MERCADO DE METAIS LEVES DA ÁSIA-PACÍFICO, POR PAÍS, 2018-2052 (TONELADAS)
TABELA 46 MERCADO DE METAIS LEVES DA ÁSIA-PACÍFICO, POR TIPO, 2018-2052 (MIL USD)
TABELA 47 MERCADO DE METAIS LEVES DA ÁSIA-PACÍFICO, POR TIPO, 2018-2052 (TONELADAS)
TABELA 48 ALUMÍNIO E LIGAS DE ALUMÍNIO NO MERCADO DE METAIS LEVES DA ÁSIA-PACÍFICO, POR GRAU, 2018-2052 (MIL USD)
TABELA 49 ALUMÍNIO E LIGAS DE ALUMÍNIO NO MERCADO DE METAIS LEVES DA ÁSIA-PACÍFICO, POR APLICAÇÃO, 2018-2052 (MIL USD)
TABELA 50 TITÂNIO E LIGAS DE TITÂNIO DA ÁSIA-PACÍFICO NO MERCADO DE METAIS LEVES, POR GRAU, 2018-2052 (MIL USD)
TABELA 51 TITÂNIO E LIGAS DE TITÂNIO NA ÁSIA-PACÍFICO NO MERCADO DE METAIS LEVES, POR APLICAÇÃO, 2018-2052 (MIL USD)
TABELA 52 MAGNÉSIO E LIGAS DE MAGNÉSIO NO MERCADO DE METAIS LEVES DA ÁSIA-PACÍFICO, POR GRAU, 2018-2052 (MIL USD)
TABELA 53 MAGNÉSIO E LIGAS DE MAGNÉSIO NO MERCADO DE METAIS LEVES DA ÁSIA-PACÍFICO, POR APLICAÇÃO, 2018-2052 (MIL USD)
TABELA 54 AÇO E LIGAS DE AÇO DA ÁSIA-PACÍFICO NO MERCADO DE METAIS LEVES, POR GRAU, 2018-2052 (MIL USD)
TABELA 55 AÇO E LIGAS DE AÇO DA ÁSIA-PACÍFICO NO MERCADO DE METAIS LEVES, POR APLICAÇÃO, 2018-2052 (MIL USD)
TABELA 56 BERÍLIO E LIGAS DE BERÍLIO NO MERCADO DE METAIS LEVES DA ÁSIA-PACÍFICO, POR GRAU, 2018-2052 (MIL USD)
TABELA 57 BERÍLIO E LIGAS DE BERÍLIO NO MERCADO DE METAIS LEVES DA ÁSIA-PACÍFICO, POR APLICAÇÃO, 2018-2052 (MIL USD)
TABELA 58 MERCADO DE METAIS LEVES DA ÁSIA-PACÍFICO, POR APLICAÇÃO, 2018-2052 (MIL USD)
TABELA 59 MERCADO DE METAIS LEVES NA ÁSIA-PACÍFICO AUTOMOTIVO E TRANSPORTE, POR TIPO, 2018-2052 (MIL USD)
TABELA 60 VEÍCULOS DE PASSAGEIROS DA ÁSIA-PACÍFICO NO MERCADO DE METAIS LEVES, POR TIPO, 2018-2052 (MIL USD)
TABELA 61 MERCADO DE VEÍCULOS ELÉTRICOS DA ÁSIA-PACÍFICO EM METAIS LEVES, POR TIPO, 2018-2052 (MIL USD)
TABELA 62 VEÍCULOS COMERCIAIS LEVES (LCV) DA ÁSIA-PACÍFICO NO MERCADO DE METAIS LEVES, POR TIPO, 2018-2052 (MIL USD)
TABELA 63 VEÍCULOS COMERCIAIS PESADOS (HCV) DA ÁSIA-PACÍFICO NO MERCADO DE METAIS LEVES, POR TIPO, 2018-2052 (MIL USD)
TABELA 64 MERCADO DE METAIS LEVES DA ÁSIA-PACÍFICO, DE DUAS E TRÊS RODAS, POR TIPO, 2018-2052 (MIL USD)
TABELA 65 MERCADO DE METAIS LEVES DA ÁSIA-PACÍFICO AEROESPACIAL E DEFESA, POR APLICAÇÃO, 2018-2052 (MIL USD)
TABELA 66 MERCADO DE METAIS LEVES E ELETRÔNICOS DE CONSUMO DA ÁSIA-PACÍFICO, POR APLICAÇÃO, 2018-2052 (MIL USD)
TABELA 67 MERCADO DE ELETRÔNICOS DE CONSUMO DA ÁSIA-PACÍFICO NO MERCADO DE METAIS LEVES, POR PRODUTO, 2018-2052 (MIL USD)
TABELA 68 DISPOSITIVOS PORTÁTEIS NO MERCADO DE METAIS LEVES DA ÁSIA-PACÍFICO, POR PRODUTO, 2018-2052 (MIL USD)
TABELA 69 MERCADO DE EQUIPAMENTOS AUDIOVISUAIS DA ÁSIA-PACÍFICO PARA METAIS LEVES, POR PRODUTO, 2018-2052 (MIL USD)
TABELA 70 ELETRODOMÉSTICOS NO MERCADO DE METAIS LEVES DA ÁSIA-PACÍFICO, POR PRODUTO, 2018-2052 (MIL USD)
TABELA 71 MERCADO DE METAIS LEVES DA ÁSIA-PACÍFICO MARÍTIMO, POR APLICAÇÃO, 2018-2052 (MIL USD)
TABELA 72 AGRICULTURA DA ÁSIA-PACÍFICO NO MERCADO DE METAIS LEVES, POR APLICAÇÃO, 2018-2052 (MIL USD)
TABELA 73 MERCADO DE METAIS LEVES DA CHINA, POR TIPO, 2018-2052 (MIL USD)
TABELA 74 MERCADO DE METAIS LEVES DA CHINA, POR TIPO, 2018-2052 (TONELADAS)
TABELA 75 ALUMÍNIO E LIGAS DE ALUMÍNIO NO MERCADO DE METAIS LEVES DA CHINA, POR GRAU, 2018-2052 (MIL USD)
TABELA 76 MERCADO DE ALUMÍNIO E LIGAS DE ALUMÍNIO DA CHINA NO MERCADO DE METAIS LEVES, POR APLICAÇÃO, 2018-2052 (MIL USD)
TABELA 77 TITÂNIO E LIGAS DE TITÂNIO DA CHINA NO MERCADO DE METAIS LEVES, POR GRAU, 2018-2052 (MIL USD)
TABELA 78 TITÂNIO E LIGAS DE TITÂNIO NO MERCADO DE METAIS LEVES DA CHINA, POR APLICAÇÃO, 2018-2052 (MIL USD)
TABELA 79 MERCADO DE METAIS LEVES DE MAGNÉSIO E LIGAS DE MAGNÉSIO DA CHINA, POR GRAU, 2018-2052 (MIL USD)
TABELA 80 MERCADO DE MAGNÉSIO E LIGAS DE MAGNÉSIO DA CHINA NO MERCADO DE METAIS LEVES, POR APLICAÇÃO, 2018-2052 (MIL USD)
TABELA 81 AÇO E LIGAS DE AÇO DA CHINA NO MERCADO DE METAIS LEVES, POR GRAU, 2018-2052 (MIL USD)
TABELA 82 MERCADO DE AÇO E LIGAS DE AÇO DA CHINA NO MERCADO DE METAIS LEVES, POR APLICAÇÃO, 2018-2052 (MIL USD)
TABELA 83 BERÍLIO E LIGAS DE BERÍLIO NO MERCADO DE METAIS LEVES DA CHINA, POR GRAU, 2018-2052 (MIL USD)
TABELA 84 MERCADO DE BERÍLIO E LIGAS DE BERÍLIO DA CHINA NO MERCADO DE METAIS LEVES, POR APLICAÇÃO, 2018-2052 (MIL USD)
TABELA 85 MERCADO DE METAIS LEVES DA CHINA, POR APLICAÇÃO, 2018-2052 (MIL USD)
TABELA 86 MERCADO DE METAIS LEVES DA CHINA AUTOMOTIVO E TRANSPORTE, POR TIPO, 2018-2052 (MIL USD)
TABELA 87 MERCADO DE VEÍCULOS DE PASSAGEIROS DA CHINA NO MERCADO DE METAIS LEVES, POR TIPO, 2018-2052 (MIL USD)
TABELA 88 MERCADO DE VEÍCULOS ELÉTRICOS DA CHINA EM METAIS LEVES, POR TIPO, 2018-2052 (MIL USD)
TABELA 89 VEÍCULOS COMERCIAIS LEVES (LCV) DA CHINA NO MERCADO DE METAIS LEVES, POR TIPO, 2018-2052 (MIL USD)
TABELA 90 VEÍCULOS COMERCIAIS PESADOS (HCV) DA CHINA NO MERCADO DE METAIS LEVES, POR TIPO, 2018-2052 (MIL USD)
TABELA 91 - MERCADO DE METAIS LEVES DA CHINA, DE DUAS E TRÊS RODAS, POR TIPO, 2018-2052 (MIL USD)
TABELA 92 MERCADO DE METAIS LEVES DA CHINA AEROESPACIAL E DEFESA, POR APLICAÇÃO, 2018-2052 (MIL USD)
TABELA 93 MERCADO DE METAIS LEVES E ELETRÔNICOS DA CHINA, POR APLICAÇÃO, 2018-2052 (MIL USD)
TABELA 94 MERCADO DE ELETRÔNICOS DE CONSUMO DA CHINA NO MERCADO DE METAIS LEVES, POR PRODUTO, 2018-2052 (MIL USD)
TABELA 95 DISPOSITIVOS PORTÁTEIS DA CHINA NO MERCADO DE METAIS LEVES, POR PRODUTO, 2018-2052 (MIL USD)
TABELA 96 MERCADO DE EQUIPAMENTOS AUDIOVISUAIS DA CHINA PARA METAIS LEVES, POR PRODUTO, 2018-2052 (MIL USD)
TABELA 97 MERCADO DE ELETRODOMÉSTICOS DA CHINA NO MERCADO DE METAIS LEVES, POR PRODUTO, 2018-2052 (MIL USD)
TABELA 98 MERCADO DE METAIS LEVES DA CHINA MARINE, POR APLICAÇÃO, 2018-2052 (MIL USD)
TABELA 99 AGRICULTURA CHINESA NO MERCADO DE METAIS LEVES, POR APLICAÇÃO, 2018-2052 (MIL USD)
TABELA 100 MERCADO DE METAIS LEVES DO JAPÃO, POR TIPO, 2018-2052 (MIL USD)
TABELA 101 MERCADO DE METAIS LEVES DO JAPÃO, POR TIPO, 2018-2052 (TONELADAS)
TABELA 102 ALUMÍNIO E LIGAS DE ALUMÍNIO NO MERCADO DE METAIS LEVES DO JAPÃO, POR GRAU, 2018-2052 (MIL USD)
TABELA 103 ALUMÍNIO E LIGAS DE ALUMÍNIO NO MERCADO DE METAIS LEVES DO JAPÃO, POR APLICAÇÃO, 2018-2052 (MIL USD)
TABELA 104 TITÂNIO E LIGAS DE TITÂNIO NO MERCADO DE METAIS LEVES DO JAPÃO, POR GRAU, 2018-2052 (MIL USD)
TABELA 105 TITÂNIO E LIGAS DE TITÂNIO NO MERCADO DE METAIS LEVES DO JAPÃO, POR APLICAÇÃO, 2018-2052 (MIL USD)
TABELA 106 MAGNÉSIO E LIGAS DE MAGNÉSIO NO MERCADO DE METAIS LEVES DO JAPÃO, POR GRAU, 2018-2052 (MIL USD)
TABELA 107 MERCADO DE MAGNÉSIO E LIGAS DE MAGNÉSIO NO JAPÃO PARA METAIS LEVES, POR APLICAÇÃO, 2018-2052 (MIL USD)
TABELA 108 AÇO E LIGAS DE AÇO DO JAPÃO NO MERCADO DE METAIS LEVES, POR GRAU, 2018-2052 (MIL USD)
TABELA 109 MERCADO DE AÇO E LIGAS DE AÇO DO JAPÃO NO MERCADO DE METAIS LEVES, POR APLICAÇÃO, 2018-2052 (MIL USD)
TABELA 110 BERÍLIO E LIGAS DE BERÍLIO NO MERCADO DE METAIS LEVES DO JAPÃO, POR GRAU, 2018-2052 (MIL USD)
TABELA 111 BERÍLIO E LIGAS DE BERÍLIO NO MERCADO DE METAIS LEVES DO JAPÃO, POR APLICAÇÃO, 2018-2052 (MIL USD)
TABELA 112 MERCADO DE METAIS LEVES DO JAPÃO, POR APLICAÇÃO, 2018-2052 (MIL USD)
TABELA 113 MERCADO DE METAIS LEVES NO SETOR AUTOMOTIVO E DE TRANSPORTE DO JAPÃO, POR TIPO, 2018-2052 (MIL USD)
TABELA 114 VEÍCULOS DE PASSAGEIROS NO MERCADO DE METAIS LEVES DO JAPÃO, POR TIPO, 2018-2052 (MIL USD)
TABELA 115 MERCADO DE METAIS LEVES PARA VEÍCULOS ELÉTRICOS NO JAPÃO, POR TIPO, 2018-2052 (MIL USD)
TABELA 116 VEÍCULOS COMERCIAIS LEVES (LCV) NO MERCADO DE METAIS LEVES DO JAPÃO, POR TIPO, 2018-2052 (MIL USD)
TABELA 117 VEÍCULOS COMERCIAIS PESADOS (HCV) DO JAPÃO NO MERCADO DE METAIS LEVES, POR TIPO, 2018-2052 (MIL USD)
TABELA 118 JAPÃO VEÍCULOS DE DUAS E TRÊS RODAS NO MERCADO DE METAIS LEVES, POR TIPO, 2018-2052 (MIL USD)
TABELA 119 MERCADO DE METAIS LEVES DO JAPÃO AEROESPACIAL E DEFESA, POR APLICAÇÃO, 2018-2052 (MIL USD)
TABELA 120 MERCADO DE ELETRÔNICOS E BENS DE CONSUMO NO JAPÃO NO MERCADO DE METAIS LEVES, POR APLICAÇÃO, 2018-2052 (MIL USD)
TABELA 121 MERCADO DE ELETRÔNICOS DE CONSUMO NO JAPÃO NO MERCADO DE METAIS LEVES, POR PRODUTO, 2018-2052 (MIL USD)
TABELA 122 DISPOSITIVOS PORTÁTEIS NO MERCADO DE METAIS LEVES DO JAPÃO, POR PRODUTO, 2018-2052 (MIL USD)
TABELA 123 MERCADO DE EQUIPAMENTOS AUDIOVISUAIS NO JAPÃO PARA METAIS LEVES, POR PRODUTO, 2018-2052 (MIL USD)
TABELA 124 MERCADO DE ELETRODOMÉSTICOS LEVES NO JAPÃO, POR PRODUTO, 2018-2052 (MIL USD)
TABELA 125 MERCADO DE METAIS LEVES DA JAPAN MARINE, POR APLICAÇÃO, 2018-2052 (MIL USD)
TABELA 126 AGRICULTURA DO JAPÃO NO MERCADO DE METAIS LEVES, POR APLICAÇÃO, 2018-2052 (MIL USD)
TABELA 127 MERCADO DE METAIS LEVES DA ÍNDIA, POR TIPO, 2018-2052 (MIL USD)
TABELA 128 MERCADO DE METAIS LEVES DA ÍNDIA, POR TIPO, 2018-2052 (TONELADAS)
TABELA 129 ALUMÍNIO E LIGAS DE ALUMÍNIO NO MERCADO DE METAIS LEVES DA ÍNDIA, POR GRAU, 2018-2052 (MIL USD)
TABELA 130 MERCADO DE ALUMÍNIO E LIGAS DE ALUMÍNIO DA ÍNDIA NO MERCADO DE METAIS LEVES, POR APLICAÇÃO, 2018-2052 (MIL USD)
TABELA 131 TITÂNIO E LIGAS DE TITÂNIO DA ÍNDIA NO MERCADO DE METAIS LEVES, POR GRAU, 2018-2052 (MIL USD)
TABELA 132 TITÂNIO E LIGAS DE TITÂNIO NO MERCADO DE METAIS LEVES DA ÍNDIA, POR APLICAÇÃO, 2018-2052 (MIL USD)
TABELA 133 MERCADO DE METAIS LEVES E MAGNÉSIO DA ÍNDIA, POR GRAU, 2018-2052 (MIL USD)
TABELA 134 MERCADO DE METAIS LEVES E MAGNÉSIO DA ÍNDIA, POR APLICAÇÃO, 2018-2052 (MIL USD)
TABELA 135 AÇO E LIGAS DE AÇO NO MERCADO DE METAIS LEVES DA ÍNDIA, POR GRAU, 2018-2052 (MIL USD)
TABELA 136 MERCADO DE AÇO E LIGAS DE AÇO DA ÍNDIA NO MERCADO DE METAIS LEVES, POR APLICAÇÃO, 2018-2052 (MIL USD)
TABELA 137 BERÍLIO E LIGAS DE BERÍLIO NO MERCADO DE METAIS LEVES DA ÍNDIA, POR GRAU, 2018-2052 (MIL USD)
TABELA 138 BERÍLIO E LIGAS DE BERÍLIO NO MERCADO DE METAIS LEVES DA ÍNDIA, POR APLICAÇÃO, 2018-2052 (MIL USD)
TABELA 139 MERCADO DE METAIS LEVES DA ÍNDIA, POR APLICAÇÃO, 2018-2052 (MIL USD)
TABELA 140 MERCADO DE METAIS LEVES DA ÍNDIA, SETOR AUTOMOTIVO E DE TRANSPORTE, POR TIPO, 2018-2052 (MIL USD)
TABELA 141 MERCADO DE VEÍCULOS DE PASSAGEIROS DA ÍNDIA EM METAIS LEVES, POR TIPO, 2018-2052 (MIL USD)
TABELA 142 MERCADO DE VEÍCULOS ELÉTRICOS EM METAIS LEVES DA ÍNDIA, POR TIPO, 2018-2052 (MIL USD)
TABELA 143 VEÍCULOS COMERCIAIS LEVES (LCV) DA ÍNDIA NO MERCADO DE METAIS LEVES, POR TIPO, 2018-2052 (MIL USD)
TABELA 144 VEÍCULOS COMERCIAIS PESADOS (HCV) DA ÍNDIA NO MERCADO DE METAIS LEVES, POR TIPO, 2018-2052 (MIL USD)
TABELA 145 INDIA DUAS E TRÊS RODAS NO MERCADO DE METAIS LEVES, POR TIPO, 2018-2052 (MIL USD)
TABELA 146 MERCADO DE METAIS LEVES DA ÍNDIA AEROESPACIAL E DEFESA, POR APLICAÇÃO, 2018-2052 (MIL USD)
TABELA 147 MERCADO DE METAIS LEVES E ELETRÔNICOS DE CONSUMO DA ÍNDIA, POR APLICAÇÃO, 2018-2052 (MIL USD)
TABELA 148 MERCADO DE ELETRÔNICOS DE CONSUMO DA ÍNDIA NO MERCADO DE METAIS LEVES, POR PRODUTO, 2018-2052 (MIL USD)
TABELA 149 DISPOSITIVOS PORTÁTEIS NO MERCADO DE METAIS LEVES DA ÍNDIA, POR PRODUTO, 2018-2052 (MIL USD)
TABELA 150 MERCADO DE EQUIPAMENTOS AUDIOVISUAIS DA ÍNDIA PARA METAIS LEVES, POR PRODUTO, 2018-2052 (MIL USD)
TABELA 151 MERCADO DE ELETRODOMÉSTICOS DA ÍNDIA NO MERCADO DE METAIS LEVES, POR PRODUTO, 2018-2052 (MIL USD)
TABELA 152 INDIA MARINE NO MERCADO DE METAIS LEVES, POR APLICAÇÃO, 2018-2052 (MIL USD)
TABELA 153 AGRICULTURA DA ÍNDIA NO MERCADO DE METAIS LEVES, POR APLICAÇÃO, 2018-2052 (MIL USD)
TABELA 154 MERCADO DE METAIS LEVES DA COREIA DO SUL, POR TIPO, 2018-2052 (MIL USD)
TABELA 155 MERCADO DE METAIS LEVES DA COREIA DO SUL, POR TIPO, 2018-2052 (TONELADAS)
TABELA 156 ALUMÍNIO E LIGAS DE ALUMÍNIO NO MERCADO DE METAIS LEVES DA COREIA DO SUL, POR GRAU, 2018-2052 (MIL USD)
TABELA 157 ALUMÍNIO E LIGAS DE ALUMÍNIO NO MERCADO DE METAIS LEVES DA COREIA DO SUL, POR APLICAÇÃO, 2018-2052 (MIL USD)
TABELA 158 TITÂNIO E LIGAS DE TITÂNIO DA COREIA DO SUL NO MERCADO DE METAIS LEVES, POR GRAU, 2018-2052 (MIL USD)
TABELA 159 TITÂNIO E LIGAS DE TITÂNIO NO MERCADO DE METAIS LEVES DA COREIA DO SUL, POR APLICAÇÃO, 2018-2052 (MIL USD)
TABELA 160 COREIA DO SUL - MAGNÉSIO E LIGAS DE MAGNÉSIO NO MERCADO DE METAIS LEVES, POR GRAU, 2018-2052 (MIL USD)
TABELA 161 MERCADO DE MAGNÉSIO E LIGAS DE MAGNÉSIO DA COREIA DO SUL NO MERCADO DE METAIS LEVES, POR APLICAÇÃO, 2018-2052 (MIL USD)
TABELA 162 AÇO E LIGAS DE AÇO DA COREIA DO SUL NO MERCADO DE METAIS LEVES, POR GRAU, 2018-2052 (MIL USD)
TABELA 163 AÇO E LIGAS DE AÇO NO MERCADO DE METAIS LEVES DA COREIA DO SUL, POR APLICAÇÃO, 2018-2052 (MIL USD)
TABELA 164 BERÍLIO E LIGAS DE BERÍLIO DA COREIA DO SUL NO MERCADO DE METAIS LEVES, POR GRAU, 2018-2052 (MIL USD)
TABELA 165 BERÍLIO E LIGAS DE BERÍLIO NO MERCADO DE METAIS LEVES DA COREIA DO SUL, POR APLICAÇÃO, 2018-2052 (MIL USD)
TABELA 166 MERCADO DE METAIS LEVES DA COREIA DO SUL, POR APLICAÇÃO, 2018-2052 (MIL USD)
TABELA 167 COREIA DO SUL - MERCADO DE METAIS LEVES, AUTOMOTIVO E TRANSPORTE, POR TIPO, 2018-2052 (MIL USD)
TABELA 168 VEÍCULOS DE PASSAGEIROS NO MERCADO DE METAIS LEVES DA COREIA DO SUL, POR TIPO, 2018-2052 (MIL USD)
TABELA 169 MERCADO DE VEÍCULOS ELÉTRICOS DA COREIA DO SUL EM METAIS LEVES, POR TIPO, 2018-2052 (MIL USD)
TABELA 170 VEÍCULOS COMERCIAIS LEVES (LCV) DA COREIA DO SUL NO MERCADO DE METAIS LEVES, POR TIPO, 2018-2052 (MIL USD)
TABELA 171 VEÍCULOS COMERCIAIS PESADOS (HCV) DA COREIA DO SUL NO MERCADO DE METAIS LEVES, POR TIPO, 2018-2052 (MIL USD)
TABELA 172 COREIA DO SUL: VEÍCULOS DE DUAS E TRÊS RODAS NO MERCADO DE METAIS LEVES, POR TIPO, 2018-2052 (MIL USD)
TABELA 173 COREIA DO SUL - MERCADO DE METAIS LEVES, AEROESPACIAL E DEFESA, POR APLICAÇÃO, 2018-2052 (MIL USD)
TABELA 174 MERCADO DE ELETRÔNICOS E BENS DE CONSUMO DA COREIA DO SUL NO MERCADO DE METAIS LEVES, POR APLICAÇÃO, 2018-2052 (MIL USD)
TABELA 175 MERCADO DE ELETRÔNICOS DE CONSUMO DA COREIA DO SUL NO MERCADO DE METAIS LEVES, POR PRODUTO, 2018-2052 (MIL USD)
TABELA 176 DISPOSITIVOS PORTÁTEIS NO MERCADO DE METAIS LEVES DA COREIA DO SUL, POR PRODUTO, 2018-2052 (MIL USD)
TABELA 177 MERCADO DE EQUIPAMENTOS AUDIOVISUAIS DA COREIA DO SUL PARA METAIS LEVES, POR PRODUTO, 2018-2052 (MIL USD)
TABELA 178 ELETRODOMÉSTICOS NO MERCADO DE METAIS LEVES DA COREIA DO SUL, POR PRODUTO, 2018-2052 (MIL USD)
TABELA 179 MERCADO DE METAIS LEVES DA COREIA DO SUL, POR APLICAÇÃO, 2018-2052 (MIL USD)
TABELA 180 AGRICULTURA DA COREIA DO SUL NO MERCADO DE METAIS LEVES, POR APLICAÇÃO, 2018-2052 (MIL USD)
TABELA 181 MERCADO DE METAIS LEVES DA AUSTRÁLIA, POR TIPO, 2018-2052 (MIL USD)
TABELA 182 MERCADO DE METAIS LEVES DA AUSTRÁLIA, POR TIPO, 2018-2052 (TONELADAS)
TABELA 183 ALUMÍNIO E LIGAS DE ALUMÍNIO DA AUSTRÁLIA NO MERCADO DE METAIS LEVES, POR GRAU, 2018-2052 (MIL USD)
TABELA 184 ALUMÍNIO E LIGAS DE ALUMÍNIO NO MERCADO DE METAIS LEVES DA AUSTRÁLIA, POR APLICAÇÃO, 2018-2052 (MIL USD)
TABELA 185 TITÂNIO E LIGAS DE TITÂNIO NA AUSTRÁLIA NO MERCADO DE METAIS LEVES, POR GRAU, 2018-2052 (MIL USD)
TABELA 186 TITÂNIO E LIGAS DE TITÂNIO NA AUSTRÁLIA NO MERCADO DE METAIS LEVES, POR APLICAÇÃO, 2018-2052 (MIL USD)
TABELA 187 MAGNÉSIO E LIGAS DE MAGNÉSIO NO MERCADO DE METAIS LEVES DA AUSTRÁLIA, POR GRAU, 2018-2052 (MIL USD)
TABELA 188 MERCADO DE MAGNÉSIO E LIGAS DE MAGNÉSIO NA AUSTRÁLIA, POR APLICAÇÃO, 2018-2052 (MIL USD)
TABELA 189 AÇO E LIGAS DE AÇO DA AUSTRÁLIA NO MERCADO DE METAIS LEVES, POR GRAU, 2018-2052 (MIL USD)
TABELA 190 MERCADO DE AÇO E LIGAS DE AÇO DA AUSTRÁLIA NO MERCADO DE METAIS LEVES, POR APLICAÇÃO, 2018-2052 (MIL USD)
TABELA 191 BERÍLIO E LIGAS DE BERÍLIO NO MERCADO DE METAIS LEVES DA AUSTRÁLIA, POR GRAU, 2018-2052 (MIL USD)
TABELA 192 BERÍLIO E LIGAS DE BERÍLIO NO MERCADO DE METAIS LEVES DA AUSTRÁLIA, POR APLICAÇÃO, 2018-2052 (MIL USD)
TABELA 193 MERCADO DE METAIS LEVES DA AUSTRÁLIA, POR APLICAÇÃO, 2018-2052 (MIL USD)
TABELA 194 MERCADO DE METAIS LEVES DA AUSTRÁLIA AUTOMOTIVO E TRANSPORTE, POR TIPO, 2018-2052 (MIL USD)
TABELA 195 MERCADO DE VEÍCULOS DE PASSAGEIROS DA AUSTRÁLIA NO MERCADO DE METAIS LEVES, POR TIPO, 2018-2052 (MIL USD)
TABELA 196 MERCADO DE VEÍCULOS ELÉTRICOS NA AUSTRÁLIA EM METAIS LEVES, POR TIPO, 2018-2052 (MIL USD)
TABELA 197 VEÍCULOS COMERCIAIS LEVES (LCV) DA AUSTRÁLIA NO MERCADO DE METAIS LEVES, POR TIPO, 2018-2052 (MIL USD)
TABELA 198 VEÍCULOS COMERCIAIS PESADOS (HCV) DA AUSTRÁLIA NO MERCADO DE METAIS LEVES, POR TIPO, 2018-2052 (MIL USD)
TABELA 199 AUSTRÁLIA VEÍCULOS DE DUAS E TRÊS RODAS NO MERCADO DE METAIS LEVES, POR TIPO, 2018-2052 (MIL USD)
TABELA 200 MERCADO DE METAIS LEVES DA AUSTRÁLIA AEROESPACIAL E DEFESA, POR APLICAÇÃO, 2018-2052 (MIL USD)
TABELA 201 MERCADO DE ELETRÔNICOS E BENS DE CONSUMO DA AUSTRÁLIA NO MERCADO DE METAIS LEVES, POR APLICAÇÃO, 2018-2052 (MIL USD)
TABELA 202 MERCADO DE ELETRÔNICOS DE CONSUMO DA AUSTRÁLIA NO MERCADO DE METAIS LEVES, POR PRODUTO, 2018-2052 (MIL USD)
TABELA 203 DISPOSITIVOS PORTÁTEIS NO MERCADO DE METAIS LEVES DA AUSTRÁLIA, POR PRODUTO, 2018-2052 (MIL USD)
TABELA 204 MERCADO DE EQUIPAMENTOS AUDIOVISUAIS DA AUSTRÁLIA PARA METAIS LEVES, POR PRODUTO, 2018-2052 (MIL USD)
TABELA 205 MERCADO DE ELETRODOMÉSTICOS LEVES DA AUSTRÁLIA, POR PRODUTO, 2018-2052 (MIL USD)
TABELA 206 MERCADO DE METAIS LEVES DA AUSTRÁLIA MARINHA, POR APLICAÇÃO, 2018-2052 (MIL USD)
TABELA 207 AGRICULTURA DA AUSTRÁLIA NO MERCADO DE METAIS LEVES, POR APLICAÇÃO, 2018-2052 (MIL USD)
TABELA 208 MERCADO DE METAIS LEVES DA TAILÂNDIA, POR TIPO, 2018-2052 (MIL USD)
TABELA 209 MERCADO DE METAIS LEVES DA TAILÂNDIA, POR TIPO, 2018-2052 (TONELADAS)
TABELA 210 ALUMÍNIO E LIGAS DE ALUMÍNIO DA TAILÂNDIA NO MERCADO DE METAIS LEVES, POR GRAU, 2018-2052 (MIL USD)
TABELA 211 ALUMÍNIO E LIGAS DE ALUMÍNIO DA TAILÂNDIA NO MERCADO DE METAIS LEVES, POR APLICAÇÃO, 2018-2052 (MIL USD)
TABELA 212 TITÂNIO E LIGAS DE TITÂNIO DA TAILÂNDIA NO MERCADO DE METAIS LEVES, POR GRAU, 2018-2052 (MIL USD)
TABELA 213 TITÂNIO E LIGAS DE TITÂNIO NO MERCADO DE METAIS LEVES DA TAILÂNDIA, POR APLICAÇÃO, 2018-2052 (MIL USD)
TABELA 214 MAGNÉSIO E LIGAS DE MAGNÉSIO NO MERCADO DE METAIS LEVES DA TAILÂNDIA, POR GRAU, 2018-2052 (MIL USD)
TABELA 215 MERCADO DE MAGNÉSIO E LIGAS DE MAGNÉSIO DA TAILÂNDIA NO MERCADO DE METAIS LEVES, POR APLICAÇÃO, 2018-2052 (MIL USD)
TABELA 216 AÇO E LIGAS DE AÇO DA TAILÂNDIA NO MERCADO DE METAIS LEVES, POR GRAU, 2018-2052 (MIL USD)
TABELA 217 AÇO E LIGAS DE AÇO DA TAILÂNDIA NO MERCADO DE METAIS LEVES, POR APLICAÇÃO, 2018-2052 (MIL USD)
TABELA 218 BERÍLIO E LIGAS DE BERÍLIO DA TAILÂNDIA NO MERCADO DE METAIS LEVES, POR GRAU, 2018-2052 (MIL USD)
TABELA 219 BERÍLIO E LIGAS DE BERÍLIO DA TAILÂNDIA NO MERCADO DE METAIS LEVES, POR APLICAÇÃO, 2018-2052 (MIL USD)
TABELA 220 MERCADO DE METAIS LEVES DA TAILÂNDIA, POR APLICAÇÃO, 2018-2052 (MIL USD)
TABELA 221 MERCADO DE METAIS LEVES DA TAILÂNDIA AUTOMOTIVO E TRANSPORTE, POR TIPO, 2018-2052 (MIL USD)
TABELA 222 MERCADO DE VEÍCULOS DE PASSAGEIROS DA TAILÂNDIA NO MERCADO DE METAIS LEVES, POR TIPO, 2018-2052 (MIL USD)
TABELA 223 MERCADO DE VEÍCULOS ELÉTRICOS DA TAILÂNDIA EM METAIS LEVES, POR TIPO, 2018-2052 (MIL USD)
TABELA 224 VEÍCULOS COMERCIAIS LEVES (LCV) DA TAILÂNDIA NO MERCADO DE METAIS LEVES, POR TIPO, 2018-2052 (MIL USD)
TABELA 225 VEÍCULOS COMERCIAIS PESADOS (HCV) DA TAILÂNDIA NO MERCADO DE METAIS LEVES, POR TIPO, 2018-2052 (MIL USD)
TABELA 226 TAILÂNDIA VEÍCULOS DE DUAS E TRÊS RODAS NO MERCADO DE METAIS LEVES, POR TIPO, 2018-2052 (MIL USD)
TABELA 227 MERCADO DE METAIS LEVES DA TAILÂNDIA AEROESPACIAL E DEFESA, POR APLICAÇÃO, 2018-2052 (MIL USD)
TABELA 228 MERCADO DE ELETRÔNICOS E BENS DE CONSUMO DA TAILÂNDIA NO MERCADO DE METAIS LEVES, POR APLICAÇÃO, 2018-2052 (MIL USD)
TABELA 229 MERCADO DE ELETRÔNICOS DE CONSUMO DA TAILÂNDIA NO MERCADO DE METAIS LEVES, POR PRODUTO, 2018-2052 (MIL USD)
TABELA 230 DISPOSITIVOS PORTÁTEIS NO MERCADO DE METAIS LEVES DA TAILÂNDIA, POR PRODUTO, 2018-2052 (MIL USD)
TABELA 231 MERCADO DE EQUIPAMENTOS AUDIOVISUAIS DA TAILÂNDIA PARA METAIS LEVES, POR PRODUTO, 2018-2052 (MIL USD)
TABELA 232 MERCADO DE ELETRODOMÉSTICOS DA TAILÂNDIA NO MERCADO DE METAIS LEVES, POR PRODUTO, 2018-2052 (MIL USD)
TABELA 233 MERCADO DE METAIS LEVES DA TAILÂNDIA MARINHA, POR APLICAÇÃO, 2018-2052 (MIL USD)
TABELA 234 AGRICULTURA DA TAILÂNDIA NO MERCADO DE METAIS LEVES, POR APLICAÇÃO, 2018-2052 (MIL USD)
TABELA 235 MERCADO DE METAIS LEVES DA INDONÉSIA, POR TIPO, 2018-2052 (MIL USD)
TABELA 236 MERCADO DE METAIS LEVES DA INDONÉSIA, POR TIPO, 2018-2052 (TONELADAS)
TABELA 237 ALUMÍNIO E LIGAS DE ALUMÍNIO DA INDONÉSIA NO MERCADO DE METAIS LEVES, POR GRAU, 2018-2052 (MIL USD)
TABELA 238 ALUMÍNIO E LIGAS DE ALUMÍNIO NO MERCADO DE METAIS LEVES DA INDONÉSIA, POR APLICAÇÃO, 2018-2052 (MIL USD)
TABELA 239 TITÂNIO E LIGAS DE TITÂNIO DA INDONÉSIA NO MERCADO DE METAIS LEVES, POR GRAU, 2018-2052 (MIL USD)
TABELA 240 TITÂNIO E LIGAS DE TITÂNIO NO MERCADO DE METAIS LEVES DA INDONÉSIA, POR APLICAÇÃO, 2018-2052 (MIL USD)
TABELA 241 MAGNÉSIO E LIGAS DE MAGNÉSIO NO MERCADO DE METAIS LEVES DA INDONÉSIA, POR GRAU, 2018-2052 (MIL USD)
TABELA 242 MERCADO DE MAGNÉSIO E LIGAS DE MAGNÉSIO NA INDONÉSIA, POR APLICAÇÃO, 2018-2052 (MIL USD)
TABELA 243 AÇO E LIGAS DE AÇO DA INDONÉSIA NO MERCADO DE METAIS LEVES, POR GRAU, 2018-2052 (MIL USD)
TABELA 244 MERCADO DE AÇO E LIGAS DE AÇO DA INDONÉSIA NO MERCADO DE METAIS LEVES, POR APLICAÇÃO, 2018-2052 (MIL USD)
TABELA 245 BERÍLIO E LIGAS DE BERÍLIO DA INDONÉSIA NO MERCADO DE METAIS LEVES, POR GRAU, 2018-2052 (MIL USD)
TABELA 246 BERÍLIO E LIGAS DE BERÍLIO NO MERCADO DE METAIS LEVES DA INDONÉSIA, POR APLICAÇÃO, 2018-2052 (MIL USD)
TABELA 247 MERCADO DE METAIS LEVES DA INDONÉSIA, POR APLICAÇÃO, 2018-2052 (MIL USD)
TABELA 248 MERCADO DE METAIS LEVES DA INDONÉSIA, SETOR AUTOMOTIVO E DE TRANSPORTE, POR TIPO, 2018-2052 (MIL USD)
TABELA 249 MERCADO DE VEÍCULOS DE PASSAGEIROS DA INDONÉSIA NO MERCADO DE METAIS LEVES, POR TIPO, 2018-2052 (MIL USD)
TABELA 250 MERCADO DE VEÍCULOS ELÉTRICOS DA INDONÉSIA EM METAIS LEVES, POR TIPO, 2018-2052 (MIL USD)
TABELA 251 VEÍCULOS COMERCIAIS LEVES (LCV) DA INDONÉSIA NO MERCADO DE METAIS LEVES, POR TIPO, 2018-2052 (MIL USD)
TABELA 252 VEÍCULOS COMERCIAIS PESADOS (HCV) DA INDONÉSIA NO MERCADO DE METAIS LEVES, POR TIPO, 2018-2052 (MIL USD)
TABELA 253 INDONÉSIA DUAS E TRÊS RODAS NO MERCADO DE METAIS LEVES, POR TIPO, 2018-2052 (MIL USD)
TABELA 254 MERCADO DE METAIS LEVES DA INDONÉSIA AEROESPACIAL E DEFESA, POR APLICAÇÃO, 2018-2052 (MIL USD)
TABELA 255 MERCADO DE ELETRÔNICOS E BENS DE CONSUMO DA INDONÉSIA NO MERCADO DE METAIS LEVES, POR APLICAÇÃO, 2018-2052 (MIL USD)
TABELA 256 MERCADO DE ELETRÔNICOS DE CONSUMO DA INDONÉSIA NO MERCADO DE METAIS LEVES, POR PRODUTO, 2018-2052 (MIL USD)
TABELA 257 DISPOSITIVOS PORTÁTEIS NO MERCADO DE METAIS LEVES DA INDONÉSIA, POR PRODUTO, 2018-2052 (MIL USD)
TABELA 258 MERCADO DE EQUIPAMENTOS AUDIOVISUAIS DA INDONÉSIA PARA METAIS LEVES, POR PRODUTO, 2018-2052 (MIL USD)
TABELA 259 MERCADO DE ELETRODOMÉSTICOS DA INDONÉSIA NO MERCADO DE METAIS LEVES, POR PRODUTO, 2018-2052 (MIL USD)
TABELA 260 MERCADO DE METAIS LEVES DA INDONÉSIA MARINHA, POR APLICAÇÃO, 2018-2052 (MIL USD)
TABELA 261 AGRICULTURA DA INDONÉSIA NO MERCADO DE METAIS LEVES, POR APLICAÇÃO, 2018-2052 (MIL USD)
TABELA 262 MERCADO DE METAIS LEVES DE TAIWAN, POR TIPO, 2018-2052 (MIL USD)
TABELA 263 MERCADO DE METAIS LEVES DE TAIWAN, POR TIPO, 2018-2052 (TONELADAS)
TABELA 264 ALUMÍNIO E LIGAS DE ALUMÍNIO DE TAIWAN NO MERCADO DE METAIS LEVES, POR GRAU, 2018-2052 (MIL USD)
TABELA 265 ALUMÍNIO E LIGAS DE ALUMÍNIO DE TAIWAN NO MERCADO DE METAIS LEVES, POR APLICAÇÃO, 2018-2052 (MIL USD)
TABELA 266 TITÂNIO E LIGAS DE TITÂNIO DE TAIWAN NO MERCADO DE METAIS LEVES, POR GRAU, 2018-2052 (MIL USD)
TABELA 267 TITÂNIO E LIGAS DE TITÂNIO DE TAIWAN NO MERCADO DE METAIS LEVES, POR APLICAÇÃO, 2018-2052 (MIL USD)
TABELA 268 MAGNÉSIO E LIGAS DE MAGNÉSIO EM TAIWAN NO MERCADO DE METAIS LEVES, POR GRAU, 2018-2052 (MIL USD)
TABELA 269 MAGNÉSIO E LIGAS DE MAGNÉSIO NO MERCADO DE METAIS LEVES DE TAIWAN, POR APLICAÇÃO, 2018-2052 (MIL USD)
TABELA 270 AÇO E LIGAS DE AÇO DE TAIWAN NO MERCADO DE METAIS LEVES, POR GRAU, 2018-2052 (MIL USD)
TABELA 271 AÇO E LIGAS DE AÇO DE TAIWAN NO MERCADO DE METAIS LEVES, POR APLICAÇÃO, 2018-2052 (MIL USD)
TABELA 272 BERÍLIO E LIGA DE BERÍLIO DE TAIWAN NO MERCADO DE METAIS LEVES, POR GRAU, 2018-2052 (MIL USD)
TABELA 273 BERÍLIO E LIGAS DE BERÍLIO DE TAIWAN NO MERCADO DE METAIS LEVES, POR APLICAÇÃO, 2018-2052 (MIL USD)
TABELA 274 MERCADO DE METAIS LEVES DE TAIWAN, POR APLICAÇÃO, 2018-2052 (MIL USD)
TABELA 275 TAIWAN AUTOMOTIVO E TRANSPORTE NO MERCADO DE METAIS LEVES, POR TIPO, 2018-2052 (MIL USD)
TABELA 276 VEÍCULOS DE PASSAGEIROS DE TAIWAN NO MERCADO DE METAIS LEVES, POR TIPO, 2018-2052 (MIL USD)
TABELA 277 MERCADO DE METAIS LEVES PARA VEÍCULOS ELÉTRICOS DE TAIWAN, POR TIPO, 2018-2052 (MIL USD)
TABELA 278 VEÍCULOS COMERCIAIS LEVES (LCV) DE TAIWAN NO MERCADO DE METAIS LEVES, POR TIPO, 2018-2052 (MIL USD)
TABELA 279 VEÍCULOS COMERCIAIS PESADOS (HCV) DE TAIWAN NO MERCADO DE METAIS LEVES, POR TIPO, 2018-2052 (MIL USD)
TABELA 280 VEÍCULOS DE DUAS E TRÊS RODAS DE TAIWAN NO MERCADO DE METAIS LEVES, POR TIPO, 2018-2052 (MIL USD)
TABELA 281 MERCADO DE METAIS LEVES DA AEROESPACIAL E DEFESA DE TAIWAN, POR APLICAÇÃO, 2018-2052 (MIL USD)
TABELA 282 ELETRÔNICOS E BENS DE CONSUMO DE TAIWAN NO MERCADO DE METAIS LEVES, POR APLICAÇÃO, 2018-2052 (MIL USD)
TABELA 283 MERCADO DE ELETRÔNICOS DE CONSUMO DE TAIWAN NO MERCADO DE METAIS LEVES, POR PRODUTO, 2018-2052 (MIL USD)
TABELA 284 DISPOSITIVOS PORTÁTEIS DE TAIWAN NO MERCADO DE METAIS LEVES, POR PRODUTO, 2018-2052 (MIL USD)
TABELA 285 MERCADO DE EQUIPAMENTOS AUDIOVISUAIS DE TAIWAN PARA METAIS LEVES, POR PRODUTO, 2018-2052 (MIL USD)
TABELA 286 ELETRODOMÉSTICOS NO MERCADO DE METAIS LEVES DE TAIWAN, POR PRODUTO, 2018-2052 (MIL USD)
TABELA 287 TAIWAN MARINE NO MERCADO DE METAIS LEVES, POR APLICAÇÃO, 2018-2052 (MIL USD)
TABELA 288 AGRICULTURA DE TAIWAN NO MERCADO DE METAIS LEVES, POR APLICAÇÃO, 2018-2052 (MIL USD)
TABELA 289 MERCADO DE METAIS LEVES DA MALÁSIA, POR TIPO, 2018-2052 (MIL USD)
TABELA 290 MERCADO DE METAIS LEVES DA MALÁSIA, POR TIPO, 2018-2052 (TONELADAS)
TABELA 291 ALUMÍNIO E LIGAS DE ALUMÍNIO DA MALÁSIA NO MERCADO DE METAIS LEVES, POR GRAU, 2018-2052 (MIL USD)
TABELA 292 ALUMÍNIO E LIGAS DE ALUMÍNIO DA MALÁSIA NO MERCADO DE METAIS LEVES, POR APLICAÇÃO, 2018-2052 (MIL USD)
TABELA 293 TITÂNIO E LIGAS DE TITÂNIO DA MALÁSIA NO MERCADO DE METAIS LEVES, POR GRAU, 2018-2052 (MIL USD)
TABELA 294 TITÂNIO E LIGAS DE TITÂNIO DA MALÁSIA NO MERCADO DE METAIS LEVES, POR APLICAÇÃO, 2018-2052 (MIL USD)
TABELA 295 MAGNÉSIO E LIGAS DE MAGNÉSIO NO MERCADO DE METAIS LEVES DA MALÁSIA, POR GRAU, 2018-2052 (MIL USD)
TABELA 296 MAGNÉSIO E LIGAS DE MAGNÉSIO NO MERCADO DE METAIS LEVES DA MALÁSIA, POR APLICAÇÃO, 2018-2052 (MIL USD)
TABELA 297 AÇO E LIGAS DE AÇO DA MALÁSIA NO MERCADO DE METAIS LEVES, POR GRAU, 2018-2052 (MIL USD)
TABELA 298 AÇO E LIGAS DE AÇO DA MALÁSIA NO MERCADO DE METAIS LEVES, POR APLICAÇÃO, 2018-2052 (MIL USD)
TABELA 299 BERÍLIO E LIGAS DE BERÍLIO DA MALÁSIA NO MERCADO DE METAIS LEVES, POR GRAU, 2018-2052 (MIL USD)
TABELA 300 BERÍLIO E LIGAS DE BERÍLIO DA MALÁSIA NO MERCADO DE METAIS LEVES, POR APLICAÇÃO, 2018-2052 (MIL USD)
TABELA 301 MERCADO DE METAIS LEVES DA MALÁSIA, POR APLICAÇÃO, 2018-2052 (MIL USD)
TABELA 302 MERCADO DE METAIS LEVES DA MALÁSIA AUTOMOTIVO E TRANSPORTE, POR TIPO, 2018-2052 (MIL USD)
TABELA 303 MERCADO DE VEÍCULOS DE PASSAGEIROS DA MALÁSIA NO MERCADO DE METAIS LEVES, POR TIPO, 2018-2052 (MIL USD)
TABELA 304 MERCADO DE METAIS LEVES PARA VEÍCULOS ELÉTRICOS DA MALÁSIA, POR TIPO, 2018-2052 (MIL USD)
TABELA 305 VEÍCULOS COMERCIAIS LEVES (LCV) DA MALÁSIA NO MERCADO DE METAIS LEVES, POR TIPO, 2018-2052 (MIL USD)
TABELA 306 VEÍCULOS COMERCIAIS PESADOS (HCV) DA MALÁSIA NO MERCADO DE METAIS LEVES, POR TIPO, 2018-2052 (MIL USD)
TABELA 307 MALÁSIA VEÍCULOS DE DUAS E TRÊS RODAS NO MERCADO DE METAIS LEVES, POR TIPO, 2018-2052 (MIL USD)
TABELA 308 MERCADO DE METAIS LEVES DA MALÁSIA AEROESPACIAL E DEFESA, POR APLICAÇÃO, 2018-2052 (MIL USD)
TABELA 309 MERCADO DE ELETRÔNICOS E BENS DE CONSUMO DA MALÁSIA NO MERCADO DE METAIS LEVES, POR APLICAÇÃO, 2018-2052 (MIL USD)
TABELA 310 MERCADO DE ELETRÔNICOS DE CONSUMO DA MALÁSIA NO MERCADO DE METAIS LEVES, POR PRODUTO, 2018-2052 (MIL USD)
TABELA 311 DISPOSITIVOS PORTÁTEIS DA MALÁSIA NO MERCADO DE METAIS LEVES, POR PRODUTO, 2018-2052 (MIL USD)
TABELA 312 MERCADO DE EQUIPAMENTOS AUDIOVISUAIS DA MALÁSIA PARA METAIS LEVES, POR PRODUTO, 2018-2052 (MIL USD)
TABELA 313 MERCADO DE ELETRODOMÉSTICOS DA MALÁSIA NO MERCADO DE METAIS LEVES, POR PRODUTO, 2018-2052 (MIL USD)
TABELA 314 MALÁSIA MARINHA NO MERCADO DE METAIS LEVES, POR APLICAÇÃO, 2018-2052 (MIL USD)
TABELA 315 AGRICULTURA DA MALÁSIA NO MERCADO DE METAIS LEVES, POR APLICAÇÃO, 2018-2052 (MIL USD)
TABELA 316 MERCADO DE METAIS LEVES DO VIETNÃ, POR TIPO, 2018-2052 (MIL USD)
TABELA 317 MERCADO DE METAIS LEVES DO VIETNÃ, POR TIPO, 2018-2052 (TONELADAS)
TABELA 318 ALUMÍNIO E LIGAS DE ALUMÍNIO DO VIETNÃ NO MERCADO DE METAIS LEVES, POR GRAU, 2018-2052 (MIL USD)
TABELA 319 MERCADO DE ALUMÍNIO E LIGAS DE ALUMÍNIO DO VIETNÃ NO MERCADO DE METAIS LEVES, POR APLICAÇÃO, 2018-2052 (MIL USD)
TABELA 320 TITÂNIO E LIGAS DE TITÂNIO DO VIETNÃ NO MERCADO DE METAIS LEVES, POR GRAU, 2018-2052 (MIL USD)
TABELA 321 TITÂNIO E LIGAS DE TITÂNIO DO VIETNÃ NO MERCADO DE METAIS LEVES, POR APLICAÇÃO, 2018-2052 (MIL USD)
TABELA 322 MERCADO DE METAIS LEVES DE MAGNÉSIO E LIGAS DE MAGNÉSIO NO VIETNÃ, POR GRAU, 2018-2052 (MIL USD)
TABELA 323 MERCADO DE MAGNÉSIO E LIGAS DE MAGNÉSIO NO VIETNÃ, POR APLICAÇÃO, 2018-2052 (MIL USD)
TABELA 324 AÇO E LIGAS DE AÇO DO VIETNÃ NO MERCADO DE METAIS LEVES, POR GRAU, 2018-2052 (MIL USD)
TABELA 325 AÇO E LIGAS DE AÇO DO VIETNÃ NO MERCADO DE METAIS LEVES, POR APLICAÇÃO, 2018-2052 (MIL USD)
TABELA 326 BERÍLIO E LIGAS DE BERÍLIO DO VIETNÃ NO MERCADO DE METAIS LEVES, POR GRAU, 2018-2052 (MIL USD)
TABELA 327 BERÍLIO E LIGAS DE BERÍLIO DO VIETNÃ NO MERCADO DE METAIS LEVES, POR APLICAÇÃO, 2018-2052 (MIL USD)
TABELA 328 MERCADO DE METAIS LEVES DO VIETNÃ, POR APLICAÇÃO, 2018-2052 (MIL USD)
TABELA 329 MERCADO DE METAIS LEVES NO SETOR AUTOMOTIVO E DE TRANSPORTE DO VIETNÃ, POR TIPO, 2018-2052 (MIL USD)
TABELA 330 VEÍCULOS DE PASSAGEIROS NO VIETNÃ NO MERCADO DE METAIS LEVES, POR TIPO, 2018-2052 (MIL USD)
TABELA 331 MERCADO DE VEÍCULOS ELÉTRICOS NO VIETNÃ NO MERCADO DE METAIS LEVES, POR TIPO, 2018-2052 (MIL USD)
TABELA 332 VEÍCULOS COMERCIAIS LEVES (LCV) DO VIETNÃ NO MERCADO DE METAIS LEVES, POR TIPO, 2018-2052 (MIL USD)
TABELA 333 VEÍCULOS COMERCIAIS PESADOS (HCV) DO VIETNÃ NO MERCADO DE METAIS LEVES, POR TIPO, 2018-2052 (MIL USD)
TABELA 334 VIETNÃ DUAS E TRÊS RODAS NO MERCADO DE METAIS LEVES, POR TIPO, 2018-2052 (MIL USD)
TABELA 335 MERCADO DE METAIS LEVES NO SETOR AEROESPACIAL E DEFESA DO VIETNÃ, POR APLICAÇÃO, 2018-2052 (MIL USD)
TABELA 336 MERCADO DE ELETRÔNICOS E BENS DE CONSUMO DO VIETNÃ NO MERCADO DE METAIS LEVES, POR APLICAÇÃO, 2018-2052 (MIL USD)
TABELA 337 MERCADO DE ELETRÔNICOS DE CONSUMO NO VIETNÃ EM METAIS LEVES, POR PRODUTO, 2018-2052 (MIL USD)
TABELA 338 DISPOSITIVOS PORTÁTEIS NO MERCADO DE METAIS LEVES DO VIETNÃ, POR PRODUTO, 2018-2052 (MIL USD)
TABELA 339 MERCADO DE EQUIPAMENTOS AUDIOVISUAIS DO VIETNÃ PARA METAIS LEVES, POR PRODUTO, 2018-2052 (MIL USD)
TABELA 340 MERCADO DE ELETRODOMÉSTICOS NO VIETNÃ NO MERCADO DE METAIS LEVES, POR PRODUTO, 2018-2052 (MIL USD)
TABELA 341 VIETNAM MARINE NO MERCADO DE METAIS LEVES, POR APLICAÇÃO, 2018-2052 (MIL USD)
TABELA 342 AGRICULTURA DO VIETNÃ NO MERCADO DE METAIS LEVES, POR APLICAÇÃO, 2018-2052 (MIL USD)
TABELA 343 MERCADO DE METAIS LEVES DAS FILIPINAS, POR TIPO, 2018-2052 (MIL USD)
TABELA 344 MERCADO DE METAIS LEVES DAS FILIPINAS, POR TIPO, 2018-2052 (TONELADAS)
TABELA 345 MERCADO DE ALUMÍNIO E LIGAS DE ALUMÍNIO DAS FILIPINAS NO MERCADO DE METAIS LEVES, POR GRAU, 2018-2052 (MIL USD)
TABELA 346 MERCADO DE ALUMÍNIO E LIGAS DE ALUMÍNIO NAS FILIPINAS, POR APLICAÇÃO, 2018-2052 (MIL USD)
TABELA 347 FILIPINAS TITÂNIO E LIGAS DE TITÂNIO NO MERCADO DE METAIS LEVES, POR GRAU, 2018-2052 (MIL USD)
TABELA 348 TITÂNIO E LIGAS DE TITÂNIO NAS FILIPINAS NO MERCADO DE METAIS LEVES, POR APLICAÇÃO, 2018-2052 (MIL USD)
TABELA 349 MERCADO DE METAIS LEVES E MAGNÉSIO NAS FILIPINAS, POR GRAU, 2018-2052 (MIL USD)
TABELA 350 MERCADO DE METAIS LEVES E MAGNÉSIO NAS FILIPINAS, POR APLICAÇÃO, 2018-2052 (MIL USD)
TABELA 351 MERCADO DE AÇO E LIGAS DE AÇO NAS FILIPINAS, POR GRAU, 2018-2052 (MIL USD)
TABELA 352 MERCADO DE AÇO E LIGAS DE AÇO NAS FILIPINAS, POR APLICAÇÃO, 2018-2052 (MIL USD)
TABELA 353 BERÍLIO E LIGAS DE BERÍLIO NAS FILIPINAS NO MERCADO DE METAIS LEVES, POR GRAU, 2018-2052 (MIL USD)
TABELA 354 MERCADO DE BERÍLIO E LIGAS DE BERÍLIO NAS FILIPINAS, POR APLICAÇÃO, 2018-2052 (MIL USD)
TABELA 355 MERCADO DE METAIS LEVES DAS FILIPINAS, POR APLICAÇÃO, 2018-2052 (MIL USD)
TABELA 356 FILIPINAS AUTOMOTIVO E TRANSPORTE NO MERCADO DE METAIS LEVES, POR TIPO, 2018-2052 (MIL USD)
TABELA 357 MERCADO DE VEÍCULOS DE PASSAGEIROS NAS FILIPINAS NO MERCADO DE METAIS LEVES, POR TIPO, 2018-2052 (MIL USD)
TABELA 358 MERCADO DE VEÍCULOS ELÉTRICOS NAS FILIPINAS EM METAIS LEVES, POR TIPO, 2018-2052 (MIL USD)
TABELA 359 FILIPINAS VEÍCULOS COMERCIAIS LEVES (LCV) NO MERCADO DE METAIS LEVES, POR TIPO, 2018-2052 (MIL USD)
TABELA 360 FILIPINAS VEÍCULOS COMERCIAIS PESADOS (HCV) NO MERCADO DE METAIS LEVES, POR TIPO, 2018-2052 (MIL USD)
TABELA 361 FILIPINAS VEÍCULOS DE DUAS E TRÊS RODAS NO MERCADO DE METAIS LEVES, POR TIPO, 2018-2052 (MIL USD)
TABELA 362 FILIPINAS AEROESPACIAL E DEFESA NO MERCADO DE METAIS LEVES, POR APLICAÇÃO, 2018-2052 (MIL USD)
TABELA 363 MERCADO DE METAIS LEVES ELETRÔNICOS E BENS DE CONSUMO NAS FILIPINAS, POR APLICAÇÃO, 2018-2052 (MIL USD)
TABELA 364 MERCADO DE ELETRÔNICOS DE CONSUMO NAS FILIPINAS NO MERCADO DE METAIS LEVES, POR PRODUTO, 2018-2052 (MIL USD)
TABELA 365 DISPOSITIVOS PORTÁTEIS NAS FILIPINAS NO MERCADO DE METAIS LEVES, POR PRODUTO, 2018-2052 (MIL USD)
TABELA 366 MERCADO DE EQUIPAMENTOS AUDIOVISUAIS NAS FILIPINAS PARA METAIS LEVES, POR PRODUTO, 2018-2052 (MIL USD)
TABELA 367 FILIPINAS ELETRODOMÉSTICOS NO MERCADO DE METAIS LEVES, POR PRODUTO, 2018-2052 (MIL USD)
TABELA 368 MERCADO DE METAIS LEVES DAS FILIPINAS, POR APLICAÇÃO, 2018-2052 (MIL USD)
TABELA 369 AGRICULTURA DAS FILIPINAS NO MERCADO DE METAIS LEVES, POR APLICAÇÃO, 2018-2052 (MIL USD)
TABELA 370 MERCADO DE METAIS LEVES DE SINGAPURA, POR TIPO, 2018-2052 (MIL USD)
TABELA 371 MERCADO DE METAIS LEVES DE SINGAPURA, POR TIPO, 2018-2052 (TONELADAS)
TABELA 372 ALUMÍNIO E LIGAS DE ALUMÍNIO DE SINGAPURA NO MERCADO DE METAIS LEVES, POR GRAU, 2018-2052 (MIL USD)
TABELA 373 ALUMÍNIO E LIGAS DE ALUMÍNIO DE SINGAPURA NO MERCADO DE METAIS LEVES, POR APLICAÇÃO, 2018-2052 (MIL USD)
TABELA 374 TITÂNIO E LIGAS DE TITÂNIO DE SINGAPURA NO MERCADO DE METAIS LEVES, POR GRAU, 2018-2052 (MIL USD)
TABELA 375 TITÂNIO E LIGAS DE TITÂNIO DE SINGAPURA NO MERCADO DE METAIS LEVES, POR APLICAÇÃO, 2018-2052 (MIL USD)
TABELA 376 MAGNÉSIO E LIGAS DE MAGNÉSIO NO MERCADO DE METAIS LEVES DE SINGAPURA, POR GRAU, 2018-2052 (MIL USD)
TABELA 377 MERCADO DE METAIS LEVES DE MAGNÉSIO E LIGAS DE MAGNÉSIO EM SINGAPURA, POR APLICAÇÃO, 2018-2052 (MIL USD)
TABELA 378 AÇO E LIGAS DE AÇO DE SINGAPURA NO MERCADO DE METAIS LEVES, POR GRAU, 2018-2052 (MIL USD)
TABELA 379 AÇO E LIGAS DE AÇO DE SINGAPURA NO MERCADO DE METAIS LEVES, POR APLICAÇÃO, 2018-2052 (MIL USD)
TABELA 380 BERÍLIO E LIGAS DE BERÍLIO DE SINGAPURA NO MERCADO DE METAIS LEVES, POR GRAU, 2018-2052 (MIL USD)
TABELA 381 BERÍLIO E LIGAS DE BERÍLIO DE SINGAPURA NO MERCADO DE METAIS LEVES, POR APLICAÇÃO, 2018-2052 (MIL USD)
TABELA 382 MERCADO DE METAIS LEVES DE SINGAPURA, POR APLICAÇÃO, 2018-2052 (MIL USD)
TABELA 383 SINGAPURA AUTOMOTIVO E TRANSPORTE NO MERCADO DE METAIS LEVES, POR TIPO, 2018-2052 (MIL USD)
TABELA 384 MERCADO DE VEÍCULOS DE PASSAGEIROS DE SINGAPURA NO MERCADO DE METAIS LEVES, POR TIPO, 2018-2052 (MIL USD)
TABELA 385 MERCADO DE METAIS LEVES DE VEÍCULOS ELÉTRICOS DE SINGAPURA, POR TIPO, 2018-2052 (MIL USD)
TABELA 386 VEÍCULOS COMERCIAIS LEVES (LCV) DE SINGAPURA NO MERCADO DE METAIS LEVES, POR TIPO, 2018-2052 (MIL USD)
TABELA 387 VEÍCULOS COMERCIAIS PESADOS (HCV) DE SINGAPURA NO MERCADO DE METAIS LEVES, POR TIPO, 2018-2052 (MIL USD)
TABELA 388 CINGAPURA VEÍCULOS DE DUAS E TRÊS RODAS NO MERCADO DE METAIS LEVES, POR TIPO, 2018-2052 (MIL USD)
TABELA 389 SINGAPURA AEROESPACIAL E DEFESA NO MERCADO DE METAIS LEVES, POR APLICAÇÃO, 2018-2052 (MIL USD)
TABELA 390 MERCADO DE ELETRÔNICOS E BENS DE CONSUMO DE SINGAPURA NO MERCADO DE METAIS LEVES, POR APLICAÇÃO, 2018-2052 (MIL USD)
TABELA 391 MERCADO DE ELETRÔNICOS DE CONSUMO DE SINGAPURA NO MERCADO DE METAIS LEVES, POR PRODUTO, 2018-2052 (MIL USD)
TABELA 392 DISPOSITIVOS PORTÁTEIS DE SINGAPURA NO MERCADO DE METAIS LEVES, POR PRODUTO, 2018-2052 (MIL USD)
TABELA 393 MERCADO DE EQUIPAMENTOS AUDIOVISUAIS DE SINGAPURA PARA METAIS LEVES, POR PRODUTO, 2018-2052 (MIL USD)
TABELA 394 MERCADO DE ELETRODOMÉSTICOS DE SINGAPURA NO MERCADO DE METAIS LEVES, POR PRODUTO, 2018-2052 (MIL USD)
TABELA 395 SINGAPORE MARINE NO MERCADO DE METAIS LEVES, POR APLICAÇÃO, 2018-2052 (MIL USD)
TABELA 396 AGRICULTURA DE SINGAPURA NO MERCADO DE METAIS LEVES, POR APLICAÇÃO, 2018-2052 (MIL USD)
TABELA 397 RESTANTE DO MERCADO DE METAIS LEVES DA ÁSIA-PACÍFICO, POR TIPO, 2018-2052 (MIL USD)
TABELA 398 MERCADO DE METAIS LEVES DA ÁSIA-PACÍFICO, POR TIPO, 2018-2052 (TONELADAS)
Lista de Figura
FIGURA 1 MERCADO DE METAIS LEVES DA ÁSIA-PACÍFICO
FIGURA 2 MERCADO DE METAIS LEVES DA ÁSIA-PACÍFICO: TRIANGULAÇÃO DE DADOS
FIGURA 3 MERCADO DE METAIS LEVES DA ÁSIA-PACÍFICO: ANÁLISE DROC
FIGURA 4 MERCADO DE METAIS LEVES DA ÁSIA-PACÍFICO: ANÁLISE DE MERCADO DA ÁSIA-PACÍFICO VS MERCADO REGIONAL
FIGURA 5 MERCADO DE METAIS LEVES DA ÁSIA-PACÍFICO: ANÁLISE DE PESQUISA DA EMPRESA
FIGURA 6 MERCADO DE METAIS LEVES DA ÁSIA-PACÍFICO: MODELAGEM MULTIVARIADA
FIGURA 7 MERCADO DE METAIS LEVES DA ÁSIA-PACÍFICO: DEMOGRAFIA DA ENTREVISTA
FIGURA 8 MERCADO DE METAIS LEVES DA ÁSIA-PACÍFICO: GRADE DE POSIÇÃO DE MERCADO DBMR
FIGURA 9 MERCADO DE METAIS LEVES DA ÁSIA-PACÍFICO: ANÁLISE DA PARTICIPAÇÃO DE FORNECEDORES
FIGURA 10 GRADE DE COBERTURA
FIGURA 11 MERCADO DE METAIS LEVES DA ÁSIA-PACÍFICO: SEGMENTAÇÃO
FIGURA 12 RESUMO EXECUTIVO
FIGURA 13 SEIS SEGMENTOS COMPREENDEM O MERCADO DE METAIS LEVES DA ÁSIA-PACÍFICO, POR TIPO
FIGURA 14 DECISÕES ESTRATÉGICAS
FIGURA 15 A CRESCENTE DEMANDA NOS SETORES AUTOMOTIVO E AEROESPACIAL DEVE IMPULSIONAR O MERCADO DE METAIS LEVES DA ÁSIA-PACÍFICO NO PERÍODO PREVISTO DE 2025 A 2052
FIGURA 16 O ALUMÍNIO E AS LIGAS DE ALUMÍNIO DEVEM SER REPRESENTANTES DA MAIOR PARTICIPAÇÃO DO MERCADO DE METAIS LEVES DA ÁSIA-PACÍFICO EM 2025 E 2052
FIGURA 17 AS CINCO FORÇAS DE PORTER
FIGURA 18 ANÁLISE DE PRODUÇÃO E CONSUMO: MERCADO DE METAIS LEVES DA ÁSIA-PACÍFICO
FIGURA 19 ANÁLISE DA CADEIA DE VALOR DO MERCADO DE METAIS LEVES DA ÁSIA-PACÍFICO
FIGURA 20 CRITÉRIOS DE SELEÇÃO DE FORNECEDORES
FIGURA 21 ANÁLISE DROC
FIGURA 22 MERCADO DE METAIS LEVES DA ÁSIA-PACÍFICO: POR TIPO, 2024
FIGURA 23 MERCADO DE METAIS LEVES DA ÁSIA-PACÍFICO: POR APLICAÇÃO, 2024
FIGURA 24 MERCADO DE METAIS LEVES DA ÁSIA-PACÍFICO: RESUMO (2024)
FIGURA 25 MERCADO DE METAIS LEVES DA ÁSIA-PACÍFICO: PARTICIPAÇÃO DA EMPRESA EM 2024 (%)
Metodologia de Investigação
A recolha de dados e a análise do ano base são feitas através de módulos de recolha de dados com amostras grandes. A etapa inclui a obtenção de informações de mercado ou dados relacionados através de diversas fontes e estratégias. Inclui examinar e planear antecipadamente todos os dados adquiridos no passado. Da mesma forma, envolve o exame de inconsistências de informação observadas em diferentes fontes de informação. Os dados de mercado são analisados e estimados utilizando modelos estatísticos e coerentes de mercado. Além disso, a análise da quota de mercado e a análise das principais tendências são os principais fatores de sucesso no relatório de mercado. Para saber mais, solicite uma chamada de analista ou abra a sua consulta.
A principal metodologia de investigação utilizada pela equipa de investigação do DBMR é a triangulação de dados que envolve a mineração de dados, a análise do impacto das variáveis de dados no mercado e a validação primária (especialista do setor). Os modelos de dados incluem grelha de posicionamento de fornecedores, análise da linha de tempo do mercado, visão geral e guia de mercado, grelha de posicionamento da empresa, análise de patentes, análise de preços, análise da quota de mercado da empresa, normas de medição, análise global versus regional e de participação dos fornecedores. Para saber mais sobre a metodologia de investigação, faça uma consulta para falar com os nossos especialistas do setor.
Personalização disponível
A Data Bridge Market Research é líder em investigação formativa avançada. Orgulhamo-nos de servir os nossos clientes novos e existentes com dados e análises que correspondem e atendem aos seus objetivos. O relatório pode ser personalizado para incluir análise de tendências de preços de marcas-alvo, compreensão do mercado para países adicionais (solicite a lista de países), dados de resultados de ensaios clínicos, revisão de literatura, mercado remodelado e análise de base de produtos . A análise de mercado dos concorrentes-alvo pode ser analisada desde análises baseadas em tecnologia até estratégias de carteira de mercado. Podemos adicionar quantos concorrentes necessitar de dados no formato e estilo de dados que procura. A nossa equipa de analistas também pode fornecer dados em tabelas dinâmicas de ficheiros Excel em bruto (livro de factos) ou pode ajudá-lo a criar apresentações a partir dos conjuntos de dados disponíveis no relatório.

