Middle East And Africa Biocides Market
Tamanho do mercado em biliões de dólares
CAGR :
% 
 USD
440.79 Billion
USD
611.03 Billion
2021
2029
USD
440.79 Billion
USD
611.03 Billion
2021
2029
| 2022 –2029 | |
| USD 440.79 Billion | |
| USD 611.03 Billion | |
| % | |
Middle East and Africa Biocides Market, By Type (Halogen Compounds, Organic Acids, Nitrogen Based Biocides/Quaternary Ammonium Compounds, Metallic Compounds, Organosulfur Compounds, Phenolic Biocides, Others), Product Type (Preservatives, Pest Control, Others), Application (Water Treatment, Food and Beverage, Boilers and Industrial Cooling Towers, Personal Care, Wood Preservation, Paints and Coating, HVAC, Boilers, Oil and Gas, Fuels, Metal Working Fluids, Marine Industry, Plastics, Leather, Others) – Industry Trends and Forecast to 2029
Market Analysis and Size
The World Health Organization (WHO) estimates that 2.1 billion people worldwide lack access to safe drinking water in their homes. Water treatment is in high demand due to a lack of safe drinking water, which is boosting the biocides market across the region, since it is used as anti-fouling agents and disinfectants. Biocides are employed in a variety of industries, including healthcare, waste-water treatment, agriculture, food and drinks, paints, coatings, pulp, paper, plastics, and construction, due to their antimicrobial properties and widespread use as disinfectants, preservatives, and insecticides.
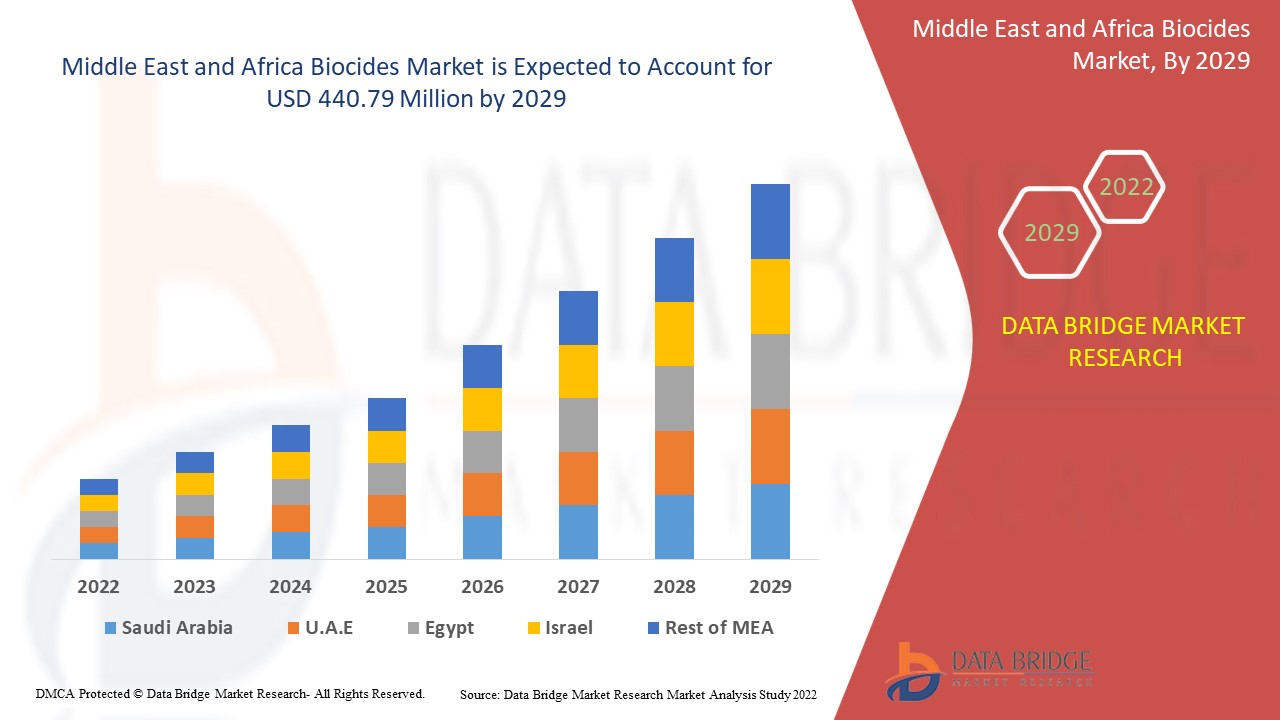
Middle East and Africa Biocides Market was valued at USD 611.03 million in 2021 and is expected to reach USD 440.79 million by 2029, registering a CAGR of 4.00% during the forecast period of 2022-2029. The market report curated by the Data Bridge Market Research team includes in-depth expert analysis, import/export analysis, pricing analysis, production consumption analysis, and climate chain scenario.
Market Definition
Biocides are products or chemicals that are used to kill pests or microbes. Mold, bacteria, algae, insects, and rodents are commonly utilized to manage and kill hazardous and undesired species. Disinfectants, wood preservatives, rodenticides, antifouling agents (on boats), in-can preservatives, and other biocides are used in households and public locations such as hospitals and industries.
Report Scope and Market Segmentation
|
Report Metric |
Details |
|
Forecast Period |
2022 to 2029 |
|
Base Year |
2021 |
|
Historic Years |
2020 (Customizable to 2019 - 2014) |
|
Quantitative Units |
Revenue in USD Million, Volumes in Units, Pricing in USD |
|
Segments Covered |
By Type (Halogen Compounds, Organic Acids, Nitrogen Based Biocides/Quaternary Ammonium Compounds, Metallic Compounds, Organosulfur Compounds, Phenolic Biocides, Others), Product Type (Preservatives, Pest Control, Others), Application (Water Treatment, Food and Beverage, Boilers and Industrial Cooling Towers, Personal Care, Wood Preservation, Paints and Coating, HVAC, Boilers, Oil and Gas, Fuels, Metal Working Fluids, Marine Industry, Plastics, Leather, Others) |
|
Countries Covered |
U.A.E, Saudi Arabia, Egypt, South Africa, Israel, Rest of Middle East and Africa |
|
Market Players Covered |
Lubrizol Corporation (U.S.), BASF SE (Germany), Clariant (Switzerland), Cortec Corporation (U.S.), Dow (U.S.), Akzo Nobel N.V. (Netherlands), Kemira (Finland), Thor (U.S.), BWA WATER ADDITIVES (U.S.), LANXESS (Germany), Albemarle Corporation (U.S.), Lonza (Switzerland), Baker Hughes (U.S.), General Electric Company (US), Buckman (U.S.), Valtris Specialty Chemicals (U.S.), Ecolab (U.S.), Merck KgaA (Germany) and Ques Industries, Inc. (U.S.). |
|
Market Opportunities |
|
Biocides Market Dynamics
This section deals with understanding the market drivers, advantages, opportunities, restraints and challenges. All of this is discussed in detail as below:
Drivers
- High Usage of Antimicrobial Protection in End Use Industries
Biocides have become increasingly popular in a variety of industries. Because cooling water systems provide a favorable environment for the growth of microorganisms, cooling towers are one of the most common application areas for biocides in power plants, mining, and chemical facilities is further anticipated to propel the growth of the biocides market.
- Increase in the Product Demand in Medical Industry
The medical business is expanding as a result of increased consumer awareness of health and hygiene. As a result, this factor is largely encouraging manufacturers to use new technologies in developing medical solutions, thus further contributing to the market growth.
- Growing Demand from Paints and Coatings Industry
The market is being driven by the growth of the paints and coatings market. The product is used to protect the painted surface against microbial contamination such as fungal or bacterial growth caused by air pollution and exposure to the outside environment in this sector.
Furthermore, the growing population has increased demand for agricultural products and created a global infrastructure need, as both the agriculture and construction sectors are heavy users of biocides in diverse commodities such as pesticides, plastics, and paints and coatings, which will further propel the growth rate of biocides market.
Opportunities
- Product Developments and Research and Development Activities
Furthermore, various product developments by the market players further enhance the applications of product, extend profitable opportunities to the market players in the forecast period of 2022 to 2029. Additionally, the growing research and development activities will further expand the future growth of the biocides market.
Restraints/Challenges
- Time-taking and Costly Registration Process
The biocidal product have to be approved before the before the market has put it on sale. Furthermore, before a biocidal product may be put on the market, the active ingredients in it must be approved. The cost of registering each biocides product under the new regulations, according to industry experts, is enormous. Furthermore, for the registration of all types of biocides, BPR necessitates massive amounts of toxicology and environmental effects testing. The registration process for biocidal products is slow and costly, posing a barrier to market expansion.
- Regulations and Raw Material Variations
On the other hand, the environmental regulations on the toxic biocides is further projected to impede the growth of the biocides market in the targeted period. However, the variations in the raw material prices might further challenge the growth of the biocides market in the near future. Therefore, these factors will further challenge the biocides market growth rate.
This biocides market report provides details of new recent developments, trade regulations, import-export analysis, production analysis, value chain optimization, market share, impact of domestic and localized market players, analyses opportunities in terms of emerging revenue pockets, changes in market regulations, strategic market growth analysis, market size, category market growths, application niches and dominance, product approvals, product launches, geographic expansions, technological innovations in the market. To gain more info on the biocides market contact Data Bridge Market Research for an Analyst Brief, our team will help you take an informed market decision to achieve market growth.
COVID-19 Impact on Biocides Market
The recent outbreak of coronavirus had a moderate impact on the biocides market. The oil and gas, paper and pulp, mining, home, industrial and institutional, paints and coatings, and wood industries are all heavily reliant on the market. The disruption in these industries caused a financial setback for the market. On the brighter side, the biocides' principal role is to kill hazardous bacteria, hence their demand has continued to rise during this time. To stop the infection from spreading, the public and industrial sectors utilized a variety of disinfectant agents. As a result, the market is have moderate growth over forecasted period.
Therefore, owing to disruptions in the global supply chain on the one hand, and increasing demand for disinfectants for household and personal care on the other, the biocides market is projected to be neutrally affected. However, in the post-COVID scenario, biocides market is projected to be significantly impacted, which will largely weigh on the market's revenue trajectory.
Recent Development
- In January 2021, LANXESS has purchased Intace SAS, a French company, as part of their expansion to maintain their position as one of the leading biocide manufacturers. Intace SAS is a French firm that specialises in the formulation and application of fungicides and biocide for the packaging sector. On January 14, 2021, LANXESS and the seller signed an agreement to that effect. The parties have agreed to keep the purchase price a secret. The transaction is expected to close in the first quarter of 2021, according to LANXESS.
Middle East and Africa Biocides Market Scope
The biocides market is segmented on the basis of type, product type and application. The growth amongst these segments will help you analyze meagre growth segments in the industries and provide the users with a valuable market overview and market insights to help them make strategic decisions for identifying core market applications.
Type
- Halogen Compounds
- Organic Acids
- Nitrogen Based Biocides/Quaternary Ammonium Compounds
- Metallic Compounds
- Organosulfur Compounds
- Phenolic Biocides
- Others
Product Type
- Preservatives
- Pest Control
- Others
Application
- Water Treatment
- Food and Beverage
- Boilers and Industrial Cooling Towers
- Personal Care
- Wood Preservation
- Paints and Coatings
- HVAC, Boilers
- Oil and Gas
- Fuels
- Metal Working Fluids
- Marine Industry
- Plastics
- Leather
- Others
Biocides Market Regional Analysis/Insights
The biocides market is analyzed and market size insights and trends are provided by country, type, product type and application as referenced above.
The countries covered in the biocides market report are Saudi Arabia, U.A.E, Israel, Egypt, South Africa, Rest of Middle East and Africa (MEA) as a part of Middle East and Africa (MEA).
The country section of the report also provides individual market impacting factors and changes in market regulation that impact the current and future trends of the market. Data points like down-stream and upstream value chain analysis, technical trends and porter's five forces analysis, case studies are some of the pointers used to forecast the market scenario for individual countries. Also, the presence and availability of global brands and their challenges faced due to large or scarce competition from local and domestic brands, impact of domestic tariffs and trade routes are considered while providing forecast analysis of the country data.
Competitive Landscape and Biocides Market Share Analysis
The biocides market competitive landscape provides details by competitor. Details included are company overview, company financials, revenue generated, market potential, investment in research and development, new market initiatives, global presence, production sites and facilities, production capacities, company strengths and weaknesses, product launch, product width and breadth, application dominance. The above data points provided are only related to the companies' focus related to biocides market.
Some of the major players operating in the biocides market are
- Lubrizol Corporation (U.S.)
- BASF SE (Germany)
- Clariant (Switzerland)
- Cortec Corporation (U.S.)
- Dow (U.S.)
- Akzo Nobel N.V. (Netherlands)
- Kemira (Finland)
- Thor (U.S.)
- BWA WATER ADDITIVES (U.S.)
- LANXESS (Germany)
- Albemarle Corporation (U.S.)
- Lonza (Switzerland)
- Baker Hughes (U.S.)
- General Electric Company (U.S.)
- Buckman (U.S.)
- Valtris Specialty Chemicals (U.S.)
- Ecolab (U.S.)
- Merck KgaA (Germany)
- Ques Industries, Inc. (U.S.)
SKU-
Obtenha acesso online ao relatório sobre a primeira nuvem de inteligência de mercado do mundo

- Painel interativo de análise de dados
- Painel de análise da empresa para oportunidades de elevado potencial de crescimento
- Acesso de analista de pesquisa para personalização e customização. consultas
- Análise da concorrência com painel interativo
- Últimas notícias, atualizações e atualizações Análise de tendências
- Aproveite o poder da análise de benchmark para um rastreio abrangente da concorrência
Índice
1 INTRODUÇÃO
1.1 OBJETIVOS DO ESTUDO
1.2 DEFINIÇÃO DE MERCADO
1.3 VISÃO GERAL DO MERCADO DE BIOCIDAS DO ORIENTE MÉDIO E DA ÁFRICA
1.4 LIMITAÇÃO
1,5 MERCADOS COBERTOS
2 SEGMENTAÇÃO DE MERCADO
2.1 MERCADOS COBERTOS
2.2 ÂMBITO GEOGRÁFICO
2,3 ANOS CONSIDERADOS PARA O ESTUDO
2.4 MOEDA E PREÇOS
2.5 MODELO DE VALIDAÇÃO DE DADOS TRIPÉ DBMR
2.6 CURVA DA LINHA DE VIDA DO TIPO DE PRODUTO
2.7 MODELAGEM MULTIVARIADA
2.8 ENTREVISTAS PRINCIPAIS COM PRINCIPAIS LÍDERES DE OPINIÃO
2.9 GRADE DE POSIÇÃO DE MERCADO DBMR
2.1 GRADE DE COBERTURA DE APLICAÇÃO DE MERCADO
2.11 MATRIZ DE DESAFIOS DO MERCADO DBMR
2.12 ANÁLISE DA PARTICIPAÇÃO DO FORNECEDOR
2.13 DADOS DE IMPORTAÇÃO E EXPORTAÇÃO
2.14 FONTES SECUNDÁRIAS
2.15 PREMISSAS
3 RESUMO EXECUTIVO
4 INSIGHTS PREMIUM
4.1 OS PRINCIPAIS PRODUTORES DE CADA TIPO DE BIOCIDA, BEM COMO ALGUNS INGRESSOS MENORES EM CADA MERCADO
4.2 TAMANHO DO MERCADO DE CALHYPO NA INDÚSTRIA DE ALIMENTOS E BEBIDAS NOS EUA
4.3 DESDOBRAMENTO DO MERCADO CANADENSE DE BIOCIDAS POR APLICAÇÃO
4.4 DESCREVA O MERCADO CANADENSE DE BIOCIDAS PARA HVAC POR PRODUTO
4.5 TAMANHO DO MERCADO DE CLORETO DE DIDECILDIMETILAMÔNIO (DDAC – TIPO QUATS) NA ÁFRICA DO SUL
4.6 ALGUNS DOS PRINCIPAIS PRODUTORES DE DDAC QUATS VENDIDOS NA ÁFRICA DO SUL SÃO MENCIONADOS ABAIXO
5 IMPACTOS DA COVID-19 NO MERCADO DE BIOCIDAS DO ORIENTE MÉDIO E DA ÁFRICA
5.1 ANÁLISE DO IMPACTO DA COVID-19 NO MERCADO DE BIOCIDAS DO ORIENTE MÉDIO E DA ÁFRICA
5.2 CONSEQUÊNCIAS DA COVID-19 E INICIATIVA DO GOVERNO PARA IMPULSIONAR O MERCADO DE BIOCIDAS NO ORIENTE MÉDIO E NA ÁFRICA
5.3 DECISÕES ESTRATÉGICAS PARA FABRICANTES APÓS A COVID-19 PARA GANHAR PARTICIPAÇÃO COMPETITIVA NO MERCADO
5.4 IMPACTO NA DEMANDA
5.5 IMPACTO NA CADEIA DE SUPRIMENTOS
5.6 CONCLUSÃO
6 VISÃO GERAL DO MERCADO
6.1 MOTORISTAS
6.1.1 CRESCIMENTO DA INDÚSTRIA DA CONSTRUÇÃO E ADOÇÃO DE REVESTIMENTOS EM PÓ
6.1.2 AUMENTO DA INFRAESTRUTURA MODERNA E DO AUTOMÓVEL LEVE
6.1.3 AUMENTO DA DEMANDA DE ÁGUA TRATADA DAS INDÚSTRIAS DE TRATAMENTO DE ÁGUA MUNICIPAL E INDUSTRIAL
6.1.4 AUMENTO DA DEMANDA DE BIOCIDAS COMO CONSERVANTES EM ALIMENTOS
6.1.5 AUMENTO DA DEMANDA POR AGROQUÍMICOS DEVIDO AO AUMENTO DA DEMANDA POR CULTURAS DE ALTA QUALIDADE E LIVRES DE PRAGAS
6.1.6 CRESCENTE DEMANDA POR PLÁSTICOS EM VISTA DO SEU USO AUMENTADO NAS INDÚSTRIAS DA CONSTRUÇÃO E AUTOMOTIVA
6.2 RESTRIÇÕES
6.2.1 AUMENTO DOS PREÇOS DAS MATÉRIAS-PRIMAS
6.2.2 REGULAMENTAÇÃO AMBIENTAL SOBRE BIOCIDAS TÓXICOS
6.3 OPORTUNIDADES
6.3.1 DESENVOLVIMENTO CRESCENTE E PREOCUPAÇÃO COM A PRODUÇÃO DE BIOCIDAS ECOLÓGICOS
6.3.2 AUMENTO DE BIOCIDAS ESPECIAIS
6.4 DESAFIO
6.4.1 AUMENTO DA EFICÁCIA DOS BIOCIDAS
7 MERCADO DE BIOCIDAS DO ORIENTE MÉDIO E ÁFRICA, POR TIPO
7.1 VISÃO GERAL
7.2 COMPOSTOS DE HALÓGENO
7.2.1 HIDANTOÍNAS
7.2.1.1 HALO-HIDANTOÍNAS
7.2.1.1.1 BCDMH (TAMBÉM CONHECIDO COMO 1-BROMO-3-CLORO-5,5-DIMETIL-HIDANTOÍNA)
7.2.1.1.2 DBDMH (TAMBÉM CONHECIDO COMO 1,3-DIBROMO-5,5-DIMETIL-HIDANTOÍNA)
7.2.1.1.3 OUTRAS HALO-HIDANTOÍNAS
7.2.1.2 DMDM (TAMBÉM CONHECIDO COMO 1,3-DIMETILOL-5,5-DIMETIL-HIDANTOÍNA)
7.2.2 CLORO
7.2.2.1 GÁS CLORO
7.2.2.2 DIÓXIDO DE CLORO
7.2.2.3 HIPOCLORETO DE SÓDIO
7.2.2.4 HIPOCLORETO DE CÁLCIO
7.2.2.5 ISOCIANURATOS (DICLOR E TRICLORO)
7.2.1 BROMO/BROMO LÍQUIDO
7.3 COMPOSTOS METÁLICOS
7.3.1 COBRE
7.3.2 MERCÚRIO
7.3.3 MAGNÉSIO
7.3.4 OUTROS
7.4 ÁCIDOS ORGÂNICOS
7.4.1 ÁCIDO FÓRMICO
7.4.2 ÁCIDO LÁTICO
7.4.3 PERACÉTICO
7.4.4 OUTROS
7.5 BIOCIDAS À BASE DE NITROGÊNIO (COMPOSTOS DE AMÔNIO QUATERNÁRIO)
7.5.1 QUATs de commodities
7.5.1.1 CLORETO DE ALQUILDIMETILBENZILAMÔNIO (QUADROSE TIPO ADBAC)
7.5.1.2 CLORETO DE DIDECILDIMETILAMÔNIO (DDAC – TIPO QUATS)
7.5.2 QUATS ESPECIAIS
7.5.2.1 CARBOQUATS (SAIS DE AMÔNIO QUATERNÁRIO DE CARBONATO E BICARBONATO)
7.5.2.2 CLORETO DE ALQUILDIMETILBENZILAMÔNIO (ADEBAC – TIPO QUATS)
7.6 COMPOSTOS ORGANOSULFURADOS
7.7 BIOCIDAS FENÓLICOS
7.8 OUTROS
8 MERCADO DE BIOCIDAS DO ORIENTE MÉDIO E ÁFRICA, POR TIPO DE PRODUTO
8.1 VISÃO GERAL
8.2 CONSERVANTES
8.3 CONTROLE DE PRAGAS
8.4 OUTROS
9 MERCADO DE BIOCIDAS DO ORIENTE MÉDIO E ÁFRICA, POR APLICAÇÃO
9.1 VISÃO GERAL
9.2 TRATAMENTO DE ÁGUA
9.3 ALIMENTOS E BEBIDAS
9.4 CALDEIRAS E TORRES DE RESFRIAMENTO INDUSTRIAIS
9.5 PRESERVAÇÃO DE MADEIRA
9.6 TINTAS E REVESTIMENTOS
9.7 PLÁSTICOS
9.8 HVAC
9.9 COMBUSTÍVEIS
9.1 FLUIDOS DE USINA DE METAL
9.11 INDÚSTRIA MARÍTIMA
9.12 PETRÓLEO E GÁS
9.13 CUIDADOS PESSOAIS
9.14 COURO
9.15 OUTROS
10 MERCADOS DE BIOCIDAS NO ORIENTE MÉDIO E ÁFRICA, POR GEOGRAFIA
10.1 ORIENTE MÉDIO E ÁFRICA
10.1.1 EMIRADOS ÁRABES UNIDOS
10.1.2 ARÁBIA SAUDITA
10.1.3 ÁFRICA DO SUL
10.1.4 ISRAEL
10.1.5 EGITO
10.1.6 RESTANTE DO ORIENTE MÉDIO E ÁFRICA
11 MERCADO DE BIOCIDAS DO ORIENTE MÉDIO E ÁFRICA, PANORAMA DA EMPRESA
11.1 ANÁLISE DA AÇÃO DA EMPRESA: ORIENTE MÉDIO E ÁFRICA
12 ANÁLISE SWOT
13 PERFIL DA EMPRESA
13.1 DI
13.1.1 RESUMO DA EMPRESA
13.1.2 ANÁLISE DE RECEITA
13.1.3 ANÁLISE DAS AÇÕES DA EMPRESA
13.1.4 PORTFÓLIO DE PRODUTOS
13.1.5 ATUALIZAÇÕES RECENTES
13.2 SOLVAY
13.2.1 RESUMO DA EMPRESA
13.2.2 ANÁLISE DE RECEITA
13.2.3 ANÁLISE DAS AÇÕES DA EMPRESA
13.2.4 PORTFÓLIO DE PRODUTOS
13.2.5 ATUALIZAÇÕES RECENTES
13.3 LANXESS
13.3.1 RESUMO DA EMPRESA
13.3.2 ANÁLISE DE RECEITA
13.3.3 ANÁLISE DE AÇÕES DA EMPRESA
13.3.4 PORTFÓLIO DE PRODUTOS
13.3.5 ATUALIZAÇÕES RECENTES
13.4 THE LUBRIZOL CORPORATION (UMA SUBSIDIÁRIA DA BERKSHIRE HATHAWAY INC.)
13.4.1 RESUMO DA EMPRESA
13.4.2 ANÁLISE DE RECEITA
13.4.3 ANÁLISE DAS AÇÕES DA EMPRESA
13.4.4 PORTFÓLIO DE PRODUTOS
13.4.5 ATUALIZAÇÕES RECENTES
13.5 CLARIANT
13.5.1 RESUMO DA EMPRESA
13.5.2 ANÁLISE DE RECEITA
13.5.3 ANÁLISE DAS AÇÕES DA EMPRESA
13.5.4 PORTFÓLIO DE PRODUTOS
13.5.5 ATUALIZAÇÕES RECENTES
13.6 Produtos Químicos AKCROS
13.6.1 RESUMO DA EMPRESA
13.6.2 PORTFÓLIO DE PRODUTOS
13.6.3 ATUALIZAÇÃO RECENTE
13.7 AKZO NOBEL NV
13.7.1 RESUMO DA EMPRESA
13.7.2 ANÁLISE DE RECEITA
13.7.3 PORTFÓLIO DE PRODUTOS
13.7.4 ATUALIZAÇÕES RECENTES
13.8 CORPORAÇÃO ALBEMARLE
13.8.1 RESUMO DA EMPRESA
13.8.2 ANÁLISE DE RECEITA
13.8.3 PORTFÓLIO DE PRODUTOS
13.8.4 ATUALIZAÇÕES RECENTES
13.9 BAKER HUGHES, UMA GE COMPANY LLC
13.9.1 RESUMO DA EMPRESA
13.9.2 ANÁLISE DE RECEITA
13.9.3 PORTFÓLIO DE PRODUTOS
13.9.4 ATUALIZAÇÃO RECENTE
13.1 BASF SE
13.10.1 RESUMO DA EMPRESA
13.10.2 ANÁLISE DE RECEITA
13.10.3 PORTFÓLIO DE PRODUTOS
13.10.4 ATUALIZAÇÕES RECENTES
13.11 BUCKMAN
13.11.1 RESUMO DA EMPRESA
13.11.2 PORTFÓLIO DE PRODUTOS
13.11.3 ATUALIZAÇÕES RECENTES
13.12 ADITIVOS PARA ÁGUA BWA
13.12.1 RESUMO DA EMPRESA
13.12.2 PORTFÓLIO DE PRODUTOS
13.12.3 ATUALIZAÇÕES RECENTES
13.13 CORBION
13.13.1 RESUMO DA EMPRESA
13.13.2 ANÁLISE DE RECEITA
13.13.3 PORTFÓLIO DE PRODUTOS
13.13.4 ATUALIZAÇÕES RECENTES
13.14 CORPORAÇÃO CORTEC
13.14.1 RESUMO DA EMPRESA
13.14.2 PORTFÓLIO DE PRODUTOS
13.14.3 ATUALIZAÇÕES RECENTES
13.15 CHEMAMDE
13.15.1 RESUMO DA EMPRESA
13.15.2 PORTFÓLIO DE PRODUTOS
13.15.3 ATUALIZAÇÃO RECENTE
13.16 CORPORAÇÃO DMP
13.16.1 RESUMO DA EMPRESA
13.16.2 PORTFÓLIO DE PRODUTOS
13.16.3 ATUALIZAÇÃO RECENTE
13.17 ECOLAB
13.17.1 RESUMO DA EMPRESA
13.17.2 ANÁLISE DE RECEITA
13.17.3 PORTFÓLIO DE PRODUTOS
13.17.4 ATUALIZAÇÕES RECENTES
13.18 KEMIRA
13.18.1 RESUMO DA EMPRESA
13.18.2 ANÁLISE DE RECEITA
13.18.3 PORTFÓLIO DE PRODUTOS
13.18.4 ATUALIZAÇÕES RECENTES
13.19 LONZA
13.19.1 RESUMO DA EMPRESA
13.19.2 ANÁLISE DE RECEITA
13.19.3 PORTFÓLIO DE PRODUTOS
13.19.4 ATUALIZAÇÕES RECENTES
13.2 MERCK KGAA
13.20.1 RESUMO DA EMPRESA
13.20.2 ANÁLISE DE RECEITA
13.20.3 PORTFÓLIO DE PRODUTOS
13.20.4 ATUALIZAÇÃO RECENTE
13.21 THOR
13.21.1 RESUMO DA EMPRESA
13.21.2 PORTFÓLIO DE PRODUTOS
13.21.3 ATUALIZAÇÕES RECENTES
13.22 VALTRIS ESPECIALIDADES QUÍMICAS
13.22.1 RESUMO DA EMPRESA
1.1.1 PORTFÓLIO DE PRODUTOS
13.22.2 ATUALIZAÇÕES RECENTES
13.23 QUES INDUSTRIES, INC.
13.23.1 RESUMO DA EMPRESA
13.23.2 PORTFÓLIO DE PRODUTOS
13.23.3 ATUALIZAÇÃO RECENTE
14 QUESTIONÁRIO
15 RELATÓRIOS RELACIONADOS
Lista de Tabela
LISTA DE TABELAS
TABELA 1 DADOS DE IMPORTAÇÃO DO PRODUTO: 3808 INSETICIDAS, RODENTICIDAS, FUNGICIDAS, HERBICIDAS, PRODUTOS ANTI-GERMINANTES E DESENVOLVIMENTO DE PLANTAS. CÓDIGO SH: 3808 (MIL USD)
TABELA 2 DADOS DE EXPORTAÇÃO DO PRODUTO: 3808 INSETICIDAS, RODENTICIDAS, FUNGICIDAS, HERBICIDAS, PRODUTOS ANTI-GERMINANTES E DESENVOLVIMENTO DE PLANTAS. CÓDIGO SH: 3808 (MIL USD)
TABELA 3 ORIENTE MÉDIO E ÁFRICA PRINCIPAIS PRODUTORES DE BIOCIDAS, POR TIPO DE BIOCIDA
TABELA 4: HIPOCLORITO DE CÁLCIO (CALHYPO) NOS EUA NO MERCADO DE BIOCIDAS, POR APLICAÇÃO EM ALIMENTOS E BEBIDAS, 2018-2027 (US$ MILHÕES)
TABELA 5 MERCADO DE BIOCIDAS DO CANADÁ, POR APLICAÇÃO, 2018-2027 (MILHÕES DE DÓLARES)
TABELA 6 MERCADO DE HVAC NO CANADÁ, POR TIPO, 2018-2027 (US$ MILHÕES)
TABELA 7 QUATES DDAC DA ÁFRICA DO SUL NO MERCADO DE BIOCIDAS, 2018-2027 (US$ MILHÕES)
TABELA 8 LISTA DE ADITIVOS ALIMENTARES TRADICIONAIS E NATURAIS APROVADOS PELA FDA
TABELA 9 LISTA DE CONSERVANTES ALIMENTARES QUÍMICOS APROVADOS PELA FDA
TABELA 10 MERCADO DE BIOCIDAS NO ORIENTE MÉDIO E ÁFRICA, POR TIPO, 2018-2027 (TONELADAS)
TABELA 11 MERCADO DE BIOCIDAS NO ORIENTE MÉDIO E ÁFRICA, POR TIPO, 2018-2027 (US$ MILHÕES)
TABELA 12 COMPOSTOS HALOGÊNICOS NO MERCADO DE BIOCIDAS DO ORIENTE MÉDIO E ÁFRICA, POR REGIÃO, 2018-2027 (TONELADAS)
TABELA 13 COMPOSTOS HALOGÊNICOS NO MERCADO DE BIOCIDAS DO ORIENTE MÉDIO E ÁFRICA, POR REGIÃO, 2018-2027 (US$ MILHÕES)
TABELA 14 COMPOSTOS HALOGÊNICOS NO MERCADO DE BIOCIDAS DO ORIENTE MÉDIO E ÁFRICA, POR TIPO DE COMPOSTOS HALOGÊNICOS, 2018-2027 (US$ MILHÕES)
TABELA 15 HIDANTOÍNAS NO MERCADO DE BIOCIDAS DO ORIENTE MÉDIO E ÁFRICA, POR TIPO DE HIDANTOÍNAS, 2018-2027 (US$ MILHÕES)
TABELA 16 HALO-HIDANTOÍNAS NO MERCADO DE BIOCIDAS DO ORIENTE MÉDIO E ÁFRICA, POR TIPO DE HALO-HIDANTOÍNAS, 2018-2027 (US$ MILHÕES)
TABELA 17 MERCADO DE CLORO NO ORIENTE MÉDIO E ÁFRICA, POR TIPO DE CLORO, 2018-2027 (US$ MILHÕES)
TABELA 18 COMPOSTOS METÁLICOS NO MERCADO DE BIOCIDAS DO ORIENTE MÉDIO E ÁFRICA, POR REGIÃO, 2018-2027 (TONELADAS)
TABELA 19 COMPOSTOS METÁLICOS NO MERCADO DE BIOCIDAS DO ORIENTE MÉDIO E ÁFRICA, POR REGIÃO, 2018-2027 (US$ MILHÕES)
TABELA 20 COMPOSTOS METÁLICOS DO ORIENTE MÉDIO E ÁFRICA NO MERCADO DE BIOCIDAS, POR TIPO DE COMPOSTOS METÁLICOS, 2018-2027 (US$ MILHÕES)
TABELA 21 ÁCIDOS ORGÂNICOS NO MERCADO DE BIOCIDAS DO ORIENTE MÉDIO E ÁFRICA, POR REGIÃO, 2018-2027 (TONELADAS)
TABELA 22 ÁCIDOS ORGÂNICOS NO MERCADO DE BIOCIDAS DO ORIENTE MÉDIO E ÁFRICA, POR REGIÃO, 2018-2027 (US$ MILHÕES)
TABELA 23 ÁCIDOS ORGÂNICOS NO MERCADO DE BIOCIDAS DO ORIENTE MÉDIO E ÁFRICA, POR TIPO DE ÁCIDOS ORGÂNICOS, 2018-2027 (US$ MILHÕES)
TABELA 24 BIOCIDAS À BASE DE NITROGÊNIO (COMPOSTOS DE AMÔNIO QUATERNÁRIO) NO MERCADO DE BIOCIDAS DO ORIENTE MÉDIO E ÁFRICA, POR REGIÃO, 2018-2027 (TONELADAS)
TABELA 25 BIOCIDAS À BASE DE NITROGÊNIO (COMPOSTOS DE AMÔNIO QUATERNÁRIO) NO MERCADO DE BIOCIDAS DO ORIENTE MÉDIO E ÁFRICA, POR REGIÃO, 2018-2027 (US$ MILHÕES)
TABELA 26 BIOCIDAS À BASE DE NITROGÊNIO (COMPOSTOS DE AMÔNIO QUATERNÁRIO) NO ORIENTE MÉDIO E ÁFRICA NO MERCADO DE BIOCIDAS, POR TIPO DE BIOCIDAS À BASE DE NITROGÊNIO (COMPOSTOS DE AMÔNIO QUATERNÁRIO), 2018-2027 (US$ MILHÕES)
TABELA 27 QUATS DE COMMODITIES NO MERCADO DE BIOCIDAS DO ORIENTE MÉDIO E ÁFRICA, POR TIPO DE QUATS DE COMMODITIES, 2018-2027 (US$ MILHÕES)
TABELA 28 QUATS ESPECIAIS NO MERCADO DE BIOCIDAS DO ORIENTE MÉDIO E ÁFRICA, POR TIPO DE QUATS ESPECIAIS, 2018-2027 (US$ MILHÕES)
TABELA 29 COMPOSTOS ORGANOSULFURADOS NO MERCADO DE BIOCIDAS DO ORIENTE MÉDIO E ÁFRICA, POR REGIÃO, 2018-2027 (TONELADAS)
TABELA 30 COMPOSTOS ORGANOSULFURADOS NO MERCADO DE BIOCIDAS DO ORIENTE MÉDIO E ÁFRICA, POR REGIÃO, 2018-2027 (US$ MILHÕES)
TABELA 31 BIOCIDAS FENÓLICOS NO MERCADO DE BIOCIDAS DO ORIENTE MÉDIO E ÁFRICA, POR REGIÃO, 2018-2027 (TONELADAS)
TABELA 32 BIOCIDAS FENÓLICOS NO MERCADO DE BIOCIDAS DO ORIENTE MÉDIO E ÁFRICA, POR REGIÃO, 2018-2027 (US$ MILHÕES)
TABELA 33 ORIENTE MÉDIO E ÁFRICA OUTROS NO MERCADO DE BIOCIDAS, POR REGIÃO, 2018-2027 (TONELADAS)
TABELA 34 ORIENTE MÉDIO E ÁFRICA OUTROS NO MERCADO DE BIOCIDAS, POR REGIÃO, 2018-2027 (US$ MILHÕES)
TABELA 35 MERCADO DE BIOCIDAS NO ORIENTE MÉDIO E ÁFRICA, POR TIPO DE PRODUTO, 2018-2027 (US$ MILHÕES)
TABELA 36 CONSERVANTES NO MERCADO DE BIOCIDAS NO ORIENTE MÉDIO E ÁFRICA, POR REGIÃO, 2018-2027 (US$ MILHÕES)
TABELA 37 CONTROLE DE PRAGAS NO MERCADO DE BIOCIDAS NO ORIENTE MÉDIO E ÁFRICA, POR REGIÃO, 2018-2027 (US$ MILHÕES)
TABELA 38 ORIENTE MÉDIO E ÁFRICA OUTROS NO MERCADO DE BIOCIDAS, POR REGIÃO, 2018-2027 (US$ MILHÕES)
TABELA 39 MERCADO DE BIOCIDAS NO ORIENTE MÉDIO E ÁFRICA, POR APLICAÇÃO, 2018-2027 (US$ MILHÕES)
TABELA 40 TRATAMENTO DE ÁGUA NO ORIENTE MÉDIO E ÁFRICA NO MERCADO DE BIOCIDAS, POR REGIÃO, 2018-2027 (US$ MILHÕES)
TABELA 41 MERCADO DE ALIMENTOS E BEBIDAS NO ORIENTE MÉDIO E ÁFRICA, POR REGIÃO, 2018-2027 (US$ MILHÕES)
TABELA 42 CALDEIRAS E TORRES DE RESFRIAMENTO INDUSTRIAIS NO ORIENTE MÉDIO E ÁFRICA NO MERCADO DE BIOCIDAS, POR REGIÃO, 2018-2027 (US$ MILHÕES)
TABELA 43 PRESERVAÇÃO DE MADEIRA NO MERCADO DE BIOCIDAS DO ORIENTE MÉDIO E ÁFRICA, POR REGIÃO, 2018-2027 (US$ MILHÕES)
TABELA 44 TINTAS E REVESTIMENTOS NO MERCADO DE BIOCIDAS DO ORIENTE MÉDIO E ÁFRICA, POR REGIÃO, 2018-2027 (US$ MILHÕES)
TABELA 45 TINTAS E REVESTIMENTOS NO MERCADO DE BIOCIDAS DO ORIENTE MÉDIO E ÁFRICA, POR REGIÃO, 2018-2027 (US$ MILHÕES)
TABELA 46 MERCADO DE HVAC NO ORIENTE MÉDIO E ÁFRICA, POR REGIÃO, 2018-2027 (US$ MILHÕES)
TABELA 47 COMBUSTÍVEIS NO MERCADO DE BIOCIDAS DO ORIENTE MÉDIO E ÁFRICA, POR REGIÃO, 2018-2027 (US$ MILHÕES)
TABELA 48 FLUIDOS DE USINA METALÚRGICA NO MERCADO DE BIOCIDAS DO ORIENTE MÉDIO E ÁFRICA, POR REGIÃO, 2018-2027 (US$ MILHÕES)
TABELA 49 INDÚSTRIA MARINHA DO ORIENTE MÉDIO E ÁFRICA NO MERCADO DE BIOCIDAS, POR REGIÃO, 2018-2027 (US$ MILHÕES)
TABELA 50 INDÚSTRIA MARINHA DO ORIENTE MÉDIO E ÁFRICA NO MERCADO DE BIOCIDAS, POR REGIÃO, 2018-2027 (US$ MILHÕES)
TABELA 51 CUIDADOS PESSOAIS NO MERCADO DE BIOCIDAS NO ORIENTE MÉDIO E ÁFRICA, POR REGIÃO, 2018-2027 (US$ MILHÕES)
TABELA 52 COURO NO MERCADO DE BIOCIDAS DO ORIENTE MÉDIO E ÁFRICA, POR REGIÃO, 2018-2027 (US$ MILHÕES)
TABELA 53 ORIENTE MÉDIO E ÁFRICA OUTROS NO MERCADO DE BIOCIDAS, POR REGIÃO, 2018-2027 (US$ MILHÕES)
TABELA 54 MERCADO DE BIOCIDAS NO ORIENTE MÉDIO E ÁFRICA, POR REGIÃO, 2018-2027 (QUILO TONELADAS)
TABELA 55 MERCADO DE BIOCIDAS NO ORIENTE MÉDIO E ÁFRICA, POR REGIÃO, 2018-2027 (US$ MILHÕES)
TABELA 56 MERCADO DE BIOCIDAS NO ORIENTE MÉDIO E ÁFRICA, POR TIPO, 2018-2027 (QUILO TONELADAS)
TABELA 57 MERCADO DE BIOCIDAS NO ORIENTE MÉDIO E ÁFRICA, POR TIPO, 2018-2027 (US$ MILHÕES)
TABELA 58 COMPOSTOS HALOGÊNICOS NO MERCADO DE BIOCIDAS DO ORIENTE MÉDIO E ÁFRICA, POR TIPO DE COMPOSTOS HALOGÊNICOS, 2018-2027 (US$ MILHÕES)
TABELA 59 ORIENTE MÉDIO E ÁFRICA: HIDANTOÍNAS NO MERCADO DE BIOCIDAS, POR TIPO DE HIDANTOÍNAS, 2018-2027 (US$ MILHÕES)
TABELA 60 MERCADO DE HALOIDANTOÍNAS NO ORIENTE MÉDIO E ÁFRICA, POR TIPO DE HALOIDANTOÍNAS, 2018-2027 (US$ MILHÕES)
TABELA 61 MERCADO DE CLORO EM BIOCIDAS NO ORIENTE MÉDIO E ÁFRICA, POR TIPO DE CLORO, 2018-2027 (US$ MILHÕES)
TABELA 62 COMPOSTOS METÁLICOS NO MERCADO DE BIOCIDAS DO ORIENTE MÉDIO E ÁFRICA, POR TIPO DE COMPOSTOS METÁLICOS, 2018-2027 (US$ MILHÕES)
TABELA 63 ÁCIDOS ORGÂNICOS NO MERCADO DE BIOCIDAS DO ORIENTE MÉDIO E ÁFRICA, POR TIPO DE ÁCIDOS ORGÂNICOS, 2018-2027 (US$ MILHÕES)
TABELA 64 BIOCIDAS À BASE DE NITROGÊNIO (COMPOSTOS DE AMÔNIO QUATERNÁRIO) NO ORIENTE MÉDIO E ÁFRICA NO MERCADO DE BIOCIDAS, POR TIPO DE BIOCIDAS À BASE DE NITROGÊNIO (COMPOSTOS DE AMÔNIO QUATERNÁRIO), 2018-2027 (US$ MILHÕES)
TABELA 65 QUATS DE COMMODITIES NO MERCADO DE BIOCIDAS DO ORIENTE MÉDIO E ÁFRICA, POR TIPO DE QUATS DE COMMODITIES, 2018-2027 (US$ MILHÕES)
TABELA 66 QUATS ESPECIAIS NO MERCADO DE BIOCIDAS DO ORIENTE MÉDIO E ÁFRICA, POR TIPO DE QUATS ESPECIAIS, 2018-2027 (US$ MILHÕES)
TABELA 67 MERCADO DE BIOCIDAS NO ORIENTE MÉDIO E ÁFRICA, POR TIPO DE PRODUTO, 2018-2027 (US$ MILHÕES)
TABELA 68 MERCADO DE BIOCIDAS NO ORIENTE MÉDIO E ÁFRICA, POR APLICAÇÃO, 2018-2027 (US$ MILHÕES)
TABELA 69 MERCADO DE BIOCIDAS NOS EMIRADOS ÁRABES UNIDOS, POR TIPO, 2018-2027 (QUILO TONELADAS)
TABELA 70 MERCADO DE BIOCIDAS NOS EMIRADOS ÁRABES UNIDOS, POR TIPO, 2018-2027 (US$ MILHÕES)
TABELA 71 COMPOSTOS HALOGÊNICOS NOS EMIRADOS ÁRABES UNIDOS NO MERCADO DE BIOCIDAS, POR TIPO DE COMPOSTOS HALOGÊNICOS, 2018-2027 (US$ MILHÕES)
TABELA 72 HIDANTOÍNAS NO MERCADO DE BIOCIDAS NOS EMIRADOS ÁRABES UNIDOS, POR TIPO DE HIDANTOÍNAS, 2018-2027 (US$ MILHÕES)
TABELA 73 HALO-HIDANTOÍNAS NO MERCADO DE BIOCIDAS DOS EMIRADOS ÁRABES UNIDOS, POR TIPO DE HALO-HIDANTOÍNAS, 2018-2027 (US$ MILHÕES)
TABELA 74 MERCADO DE CLORO EM BIOCIDAS NOS EMIRADOS ÁRABES UNIDOS, POR TIPO DE CLORO, 2018-2027 (US$ MILHÕES)
TABELA 75 COMPOSTOS METÁLICOS NOS EMIRADOS ÁRABES UNIDOS NO MERCADO DE BIOCIDAS, POR TIPO DE COMPOSTOS METÁLICOS, 2018-2027 (US$ MILHÕES)
TABELA 76 ÁCIDOS ORGÂNICOS NO MERCADO DE BIOCIDAS DOS EMIRADOS ÁRABES UNIDOS, POR TIPO DE ÁCIDOS ORGÂNICOS, 2018-2027 (US$ MILHÕES)
TABELA 77 BIOCIDAS À BASE DE NITROGÊNIO (COMPOSTOS DE AMÔNIO QUATERNÁRIO) NOS EMIRADOS ÁRABES UNIDOS NO MERCADO DE BIOCIDAS, POR TIPO DE BIOCIDAS À BASE DE NITROGÊNIO (COMPOSTOS DE AMÔNIO QUATERNÁRIO), 2018-2027 (US$ MILHÕES)
TABELA 78 QUATS DE COMMODITY NO MERCADO DE BIOCIDAS DOS EMIRADOS ÁRABES UNIDOS, POR TIPO DE QUATS DE COMMODITY, 2018-2027 (US$ MILHÕES)
TABELA 79 QUATS ESPECIAIS NO MERCADO DE BIOCIDAS DOS EMIRADOS ÁRABES UNIDOS, POR TIPO DE QUATS ESPECIAIS, 2018-2027 (US$ MILHÕES)
TABELA 80 MERCADO DE BIOCIDAS NOS EMIRADOS ÁRABES UNIDOS, POR TIPO DE PRODUTO, 2018-2027 (US$ MILHÕES)
TABELA 81 MERCADO DE BIOCIDAS NOS EMIRADOS ÁRABES UNIDOS, POR APLICAÇÃO, 2018-2027 (US$ MILHÕES)
TABELA 82 MERCADO DE BIOCIDAS DA ARÁBIA SAUDITA, POR TIPO, 2018-2027 (QUILO TONELADAS)
TABELA 83 MERCADO DE BIOCIDAS DA ARÁBIA SAUDITA, POR TIPO, 2018-2027 (US$ MILHÕES)
TABELA 84 COMPOSTOS HALOGÊNICOS DA ARÁBIA SAUDITA NO MERCADO DE BIOCIDAS, POR TIPO DE COMPOSTOS HALOGÊNICOS, 2018-2027 (US$ MILHÕES)
TABELA 85 HIDANTOÍNAS NO MERCADO DE BIOCIDAS DA ARÁBIA SAUDITA, POR TIPO DE HIDANTOÍNAS, 2018-2027 (US$ MILHÕES)
TABELA 86 HALO-HIDANTOÍNAS NO MERCADO DE BIOCIDAS DA ARÁBIA SAUDITA, POR TIPO DE HALO-HIDANTOÍNAS, 2018-2027 (US$ MILHÕES)
TABELA 87 MERCADO DE CLORO EM BIOCIDAS DA ARÁBIA SAUDITA, POR TIPO DE CLORO, 2018-2027 (US$ MILHÕES)
TABELA 88 COMPOSTOS METÁLICOS DA ARÁBIA SAUDITA NO MERCADO DE BIOCIDAS, POR TIPO DE COMPOSTOS METÁLICOS, 2018-2027 (US$ MILHÕES)
TABELA 89 ÁCIDOS ORGÂNICOS NO MERCADO DE BIOCIDAS DA ARÁBIA SAUDITA, POR TIPO DE ÁCIDOS ORGÂNICOS, 2018-2027 (US$ MILHÕES)
TABELA 90 BIOCIDAS À BASE DE NITROGÊNIO (COMPOSTOS DE AMÔNIO QUATERNÁRIO) DA ARÁBIA SAUDITA NO MERCADO DE BIOCIDAS, POR TIPO DE BIOCIDAS À BASE DE NITROGÊNIO (COMPOSTOS DE AMÔNIO QUATERNÁRIO), 2018-2027 (US$ MILHÕES)
TABELA 91 QUATS DE COMMODITY NO MERCADO DE BIOCIDAS DA ARÁBIA SAUDITA, POR TIPO DE QUATS DE COMMODITY, 2018-2027 (US$ MILHÕES)
TABELA 92 QUATS ESPECIAIS DA ARÁBIA SAUDITA NO MERCADO DE BIOCIDAS, POR TIPO DE QUATS ESPECIAIS, 2018-2027 (US$ MILHÕES)
TABELA 93 MERCADO DE BIOCIDAS DA ARÁBIA SAUDITA, POR TIPO DE PRODUTO, 2018-2027 (US$ MILHÕES)
TABELA 94 MERCADO DE BIOCIDAS DA ARÁBIA SAUDITA, POR APLICAÇÃO, 2018-2027 (US$ MILHÕES)
TABELA 95 MERCADO DE BIOCIDAS DA ÁFRICA DO SUL, POR TIPO, 2018-2027 (QUILO TONELADAS)
TABELA 96 MERCADO DE BIOCIDAS DA ÁFRICA DO SUL, POR TIPO, 2018-2027 (US$ MILHÕES)
TABELA 97 COMPOSTOS HALOGÊNICOS NO MERCADO DE BIOCIDAS DA ÁFRICA DO SUL, POR TIPO DE COMPOSTOS HALOGÊNICOS, 2018-2027 (US$ MILHÕES)
TABELA 98 HIDANTOÍNAS NO MERCADO DE BIOCIDAS DA ÁFRICA DO SUL, POR TIPO DE HIDANTOÍNAS, 2018-2027 (US$ MILHÕES)
TABELA 99 MERCADO DE HALOIDANTOÍNAS NA ÁFRICA DO SUL, POR TIPO DE HALOIDANTOÍNAS, 2018-2027 (US$ MILHÕES)
TABELA 100 MERCADO DE CLORO EM BIOCIDAS DA ÁFRICA DO SUL, POR TIPO DE CLORO, 2018-2027 (US$ MILHÕES)
TABELA 101 COMPOSTOS METÁLICOS NO MERCADO DE BIOCIDAS DA ÁFRICA DO SUL, POR TIPO DE COMPOSTOS METÁLICOS, 2018-2027 (US$ MILHÕES)
TABELA 102 ÁCIDOS ORGÂNICOS NO MERCADO DE BIOCIDAS DA ÁFRICA DO SUL, POR TIPO DE ÁCIDOS ORGÂNICOS, 2018-2027 (US$ MILHÕES)
TABELA 103 BIOCIDAS À BASE DE NITROGÊNIO (COMPOSTOS DE AMÔNIO QUATERNÁRIO) NO MERCADO DE BIOCIDAS DA ÁFRICA DO SUL, POR TIPO DE BIOCIDAS À BASE DE NITROGÊNIO (COMPOSTOS DE AMÔNIO QUATERNÁRIO), 2018-2027 (US$ MILHÕES)
TABELA 104 QUATS DE COMMODITY NO MERCADO DE BIOCIDAS DA ÁFRICA DO SUL, POR TIPO DE QUATS DE COMMODITY, 2018-2027 (US$ MILHÕES)
TABELA 105 QUATS ESPECIAIS NO MERCADO DE BIOCIDAS DA ÁFRICA DO SUL, POR TIPO DE QUATS ESPECIAIS, 2018-2027 (US$ MILHÕES)
TABELA 106 MERCADO DE BIOCIDAS DA ÁFRICA DO SUL, POR TIPO DE PRODUTO, 2018-2027 (US$ MILHÕES)
TABELA 107 MERCADO DE BIOCIDAS DA ÁFRICA DO SUL, POR APLICAÇÃO, 2018-2027 (US$ MILHÕES)
TABELA 108 MERCADO DE BIOCIDAS DE ISRAEL, POR TIPO, 2018-2027 (QUILO TONELADAS)
TABELA 109 MERCADO DE BIOCIDAS DE ISRAEL, POR TIPO, 2018-2027 (US$ MILHÕES)
TABELA 110 COMPOSTOS HALOGÊNICOS NO MERCADO DE BIOCIDAS DE ISRAEL, POR TIPO DE COMPOSTOS HALOGÊNICOS, 2018-2027 (US$ MILHÕES)
TABELA 111 HIDANTOÍNAS NO MERCADO DE BIOCIDAS DE ISRAEL, POR TIPO DE HIDANTOÍNAS, 2018-2027 (US$ MILHÕES)
TABELA 112 HALOIDANTOÍNAS NO MERCADO DE BIOCIDAS DE ISRAEL, POR TIPO DE HALOIDANTOÍNAS, 2018-2027 (US$ MILHÕES)
TABELA 113 CLORO EM MERCADO DE BIOCIDAS DE ISRAEL, POR TIPO DE CLORO, 2018-2027 (US$ MILHÕES)
TABELA 114 COMPOSTOS METÁLICOS NO MERCADO DE BIOCIDAS DE ISRAEL, POR TIPO DE COMPOSTOS METÁLICOS, 2018-2027 (US$ MILHÕES)
TABELA 115 ÁCIDOS ORGÂNICOS NO MERCADO DE BIOCIDAS DE ISRAEL, POR TIPO DE ÁCIDOS ORGÂNICOS, 2018-2027 (US$ MILHÕES)
TABELA 116 BIOCIDAS À BASE DE NITROGÊNIO (COMPOSTOS DE AMÔNIO QUATERNÁRIO) DE ISRAEL NO MERCADO DE BIOCIDAS, POR TIPO DE BIOCIDAS À BASE DE NITROGÊNIO (COMPOSTOS DE AMÔNIO QUATERNÁRIO), 2018-2027 (US$ MILHÕES)
TABELA 117 QUATS DE COMMODITY NO MERCADO DE BIOCIDAS DE ISRAEL, POR TIPO DE QUATS DE COMMODITY, 2018-2027 (US$ MILHÕES)
TABELA 118 QUATS ESPECIAIS DE ISRAEL NO MERCADO DE BIOCIDAS, POR TIPO DE QUATS ESPECIAIS, 2018-2027 (US$ MILHÕES)
TABELA 119 MERCADO DE BIOCIDAS DE ISRAEL, POR TIPO DE PRODUTO, 2018-2027 (US$ MILHÕES)
TABELA 120 MERCADO DE BIOCIDAS DE ISRAEL, POR APLICAÇÃO, 2018-2027 (US$ MILHÕES)
TABELA 121 MERCADO DE BIOCIDAS DO EGITO, POR TIPO, 2018-2027 (QUILO TONELADAS)
TABELA 122 MERCADO DE BIOCIDAS DO EGITO, POR TIPO, 2018-2027 (US$ MILHÕES)
TABELA 123 COMPOSTOS HALOGÊNICOS NO MERCADO DE BIOCIDAS DO EGITO, POR TIPO DE COMPOSTOS HALOGÊNICOS, 2018-2027 (US$ MILHÕES)
TABELA 124 MERCADO DE HIDANTOÍNAS NO EGITO, POR TIPO DE HIDANTOÍNAS, 2018-2027 (US$ MILHÕES)
TABELA 125 MERCADO DE HALOIDANTOÍNAS NO EGITO, POR TIPO DE HALOIDANTOÍNAS, 2018-2027 (US$ MILHÕES)
TABELA 126 MERCADO DE CLORO NO EGITO EM BIOCIDAS, POR TIPO DE CLORO, 2018-2027 (US$ MILHÕES)
TABELA 127 COMPOSTOS METÁLICOS NO MERCADO DE BIOCIDAS DO EGITO, POR TIPO DE COMPOSTOS METÁLICOS, 2018-2027 (US$ MILHÕES)
TABELA 128 ÁCIDOS ORGÂNICOS NO MERCADO DE BIOCIDAS DO EGITO, POR TIPO DE ÁCIDOS ORGÂNICOS, 2018-2027 (US$ MILHÕES)
TABELA 129 BIOCIDAS À BASE DE NITROGÊNIO (COMPOSTOS DE AMÔNIO QUATERNÁRIO) NO MERCADO DE BIOCIDAS DO EGITO, POR TIPO DE BIOCIDAS À BASE DE NITROGÊNIO (COMPOSTOS DE AMÔNIO QUATERNÁRIO), 2018-2027 (US$ MILHÕES)
TABELA 130 QUATS DE COMMODITIES NO MERCADO DE BIOCIDAS DO EGITO, POR TIPO DE QUATS DE COMMODITIES, 2018-2027 (US$ MILHÕES)
TABELA 131 QUATS ESPECIAIS NO MERCADO DE BIOCIDAS DO EGITO, POR TIPO DE QUATS ESPECIAIS, 2018-2027 (US$ MILHÕES)
TABELA 132 MERCADO DE BIOCIDAS DO EGITO, POR TIPO DE PRODUTO, 2018-2027 (US$ MILHÕES)
TABELA 133 MERCADO DE BIOCIDAS DO EGITO, POR APLICAÇÃO, 2018-2027 (US$ MILHÕES)
TABELA 134 MERCADO DE BIOCIDAS NO RESTANTE DO ORIENTE MÉDIO E ÁFRICA, POR TIPO, 2018-2027 (QUILO TONELADAS)
TABELA 135 MERCADO DE BIOCIDAS NO RESTANTE DO ORIENTE MÉDIO E ÁFRICA, POR TIPO, 2018-2027 (US$ MILHÕES)
Lista de Figura
LISTA DE FIGURAS
FIGURA 1 MERCADO DE BIOCIDAS DO ORIENTE MÉDIO E ÁFRICA: SEGMENTAÇÃO
FIGURA 2 MERCADO DE BIOCIDAS NO ORIENTE MÉDIO E ÁFRICA: TRIANGULAÇÃO DE DADOS
FIGURA 3 MERCADO DE BIOCIDAS NO ORIENTE MÉDIO E ÁFRICA: ANÁLISE DROC
FIGURA 4 MERCADO DE BIOCIDAS DO ORIENTE MÉDIO E ÁFRICA: ANÁLISE DO MERCADO MÉDIO E ÁFRICA VS MERCADO REGIONAL
FIGURA 5 MERCADO DE BIOCIDAS DO ORIENTE MÉDIO E ÁFRICA: ANÁLISE DE PESQUISA DA EMPRESA
FIGURA 6 MERCADO DE BIOCIDAS DO ORIENTE MÉDIO E ÁFRICA: A CURVA DA LINHA DE VIDA DO TIPO DE PRODUTO
FIGURA 7 MERCADO DE BIOCIDAS NO ORIENTE MÉDIO E ÁFRICA: DEMOGRAFIA DA ENTREVISTA
FIGURA 8 MERCADO DE BIOCIDAS DO ORIENTE MÉDIO E ÁFRICA: GRADE DE POSIÇÃO DE MERCADO DBMR
FIGURA 9 MERCADO DE BIOCIDAS DO ORIENTE MÉDIO E ÁFRICA: GRADE DE COBERTURA DE APLICAÇÃO DE MERCADO
FIGURA 10 MERCADO DE BIOCIDAS NO ORIENTE MÉDIO E ÁFRICA: A MATRIZ DO DESAFIO DO MERCADO
FIGURA 11 MERCADO DE BIOCIDAS NO ORIENTE MÉDIO E ÁFRICA: ANÁLISE DA PARTICIPAÇÃO DE FORNECEDORES
FIGURA 12 MERCADO DE BIOCIDAS DO ORIENTE MÉDIO E ÁFRICA: SEGMENTAÇÃO
FIGURA 13 O CRESCIMENTO NO USO DE BIOCIDAS COMO DESINFETANTES NA INDÚSTRIA MÉDICA E FARMACÊUTICA ESTÁ IMPULSIONANDO O MERCADO DE BIOCIDAS DO ORIENTE MÉDIO E DA ÁFRICA NO PERÍODO PREVISTO DE 2020 A 2027
FIGURA 14 COMPOSTOS DE HALOGÊNIO DEVEM SER REPRESENTANTES DA MAIOR PARCIALIDADE DO MERCADO DE BIOCIDAS DO ORIENTE MÉDIO E ÁFRICA EM 2020 E 2027
FIGURA 15 MOTIVADORES, RESTRIÇÕES, OPORTUNIDADES E DESAFIOS DO MERCADO DE BIOCIDAS DO ORIENTE MÉDIO E DA ÁFRICA
FIGURA 16 MERCADO DE BIOCIDAS NO ORIENTE MÉDIO E ÁFRICA: POR TIPO DE PRODUTO, 2019
FIGURA 17 MERCADO DE BIOCIDAS NO ORIENTE MÉDIO E ÁFRICA: POR TIPO DE PRODUTO, 2019
FIGURA 18 MERCADO DE BIOCIDAS NO ORIENTE MÉDIO E ÁFRICA: POR APLICAÇÃO, 2019
FIGURA 19 MERCADO DE BIOCIDAS NO ORIENTE MÉDIO E ÁFRICA: RESUMO (2019)
FIGURA 20 MERCADO DE BIOCIDAS NO ORIENTE MÉDIO E ÁFRICA: POR PAÍS (2019)
FIGURA 21 MERCADO DE BIOCIDAS NO ORIENTE MÉDIO E ÁFRICA: POR PAÍS (2020 E 2027)
FIGURA 22 MERCADO DE BIOCIDAS NO ORIENTE MÉDIO E ÁFRICA: POR PAÍS (2019 E 2027)
FIGURA 23 MERCADO DE BIOCIDAS NO ORIENTE MÉDIO E ÁFRICA: POR TIPO (2020-2027)
FIGURA 24 MERCADO DE BIOCIDAS DO ORIENTE MÉDIO E ÁFRICA: PARTICIPAÇÃO DA EMPRESA EM 2019 (%)
Metodologia de Investigação
A recolha de dados e a análise do ano base são feitas através de módulos de recolha de dados com amostras grandes. A etapa inclui a obtenção de informações de mercado ou dados relacionados através de diversas fontes e estratégias. Inclui examinar e planear antecipadamente todos os dados adquiridos no passado. Da mesma forma, envolve o exame de inconsistências de informação observadas em diferentes fontes de informação. Os dados de mercado são analisados e estimados utilizando modelos estatísticos e coerentes de mercado. Além disso, a análise da quota de mercado e a análise das principais tendências são os principais fatores de sucesso no relatório de mercado. Para saber mais, solicite uma chamada de analista ou abra a sua consulta.
A principal metodologia de investigação utilizada pela equipa de investigação do DBMR é a triangulação de dados que envolve a mineração de dados, a análise do impacto das variáveis de dados no mercado e a validação primária (especialista do setor). Os modelos de dados incluem grelha de posicionamento de fornecedores, análise da linha de tempo do mercado, visão geral e guia de mercado, grelha de posicionamento da empresa, análise de patentes, análise de preços, análise da quota de mercado da empresa, normas de medição, análise global versus regional e de participação dos fornecedores. Para saber mais sobre a metodologia de investigação, faça uma consulta para falar com os nossos especialistas do setor.
Personalização disponível
A Data Bridge Market Research é líder em investigação formativa avançada. Orgulhamo-nos de servir os nossos clientes novos e existentes com dados e análises que correspondem e atendem aos seus objetivos. O relatório pode ser personalizado para incluir análise de tendências de preços de marcas-alvo, compreensão do mercado para países adicionais (solicite a lista de países), dados de resultados de ensaios clínicos, revisão de literatura, mercado remodelado e análise de base de produtos . A análise de mercado dos concorrentes-alvo pode ser analisada desde análises baseadas em tecnologia até estratégias de carteira de mercado. Podemos adicionar quantos concorrentes necessitar de dados no formato e estilo de dados que procura. A nossa equipa de analistas também pode fornecer dados em tabelas dinâmicas de ficheiros Excel em bruto (livro de factos) ou pode ajudá-lo a criar apresentações a partir dos conjuntos de dados disponíveis no relatório.

