
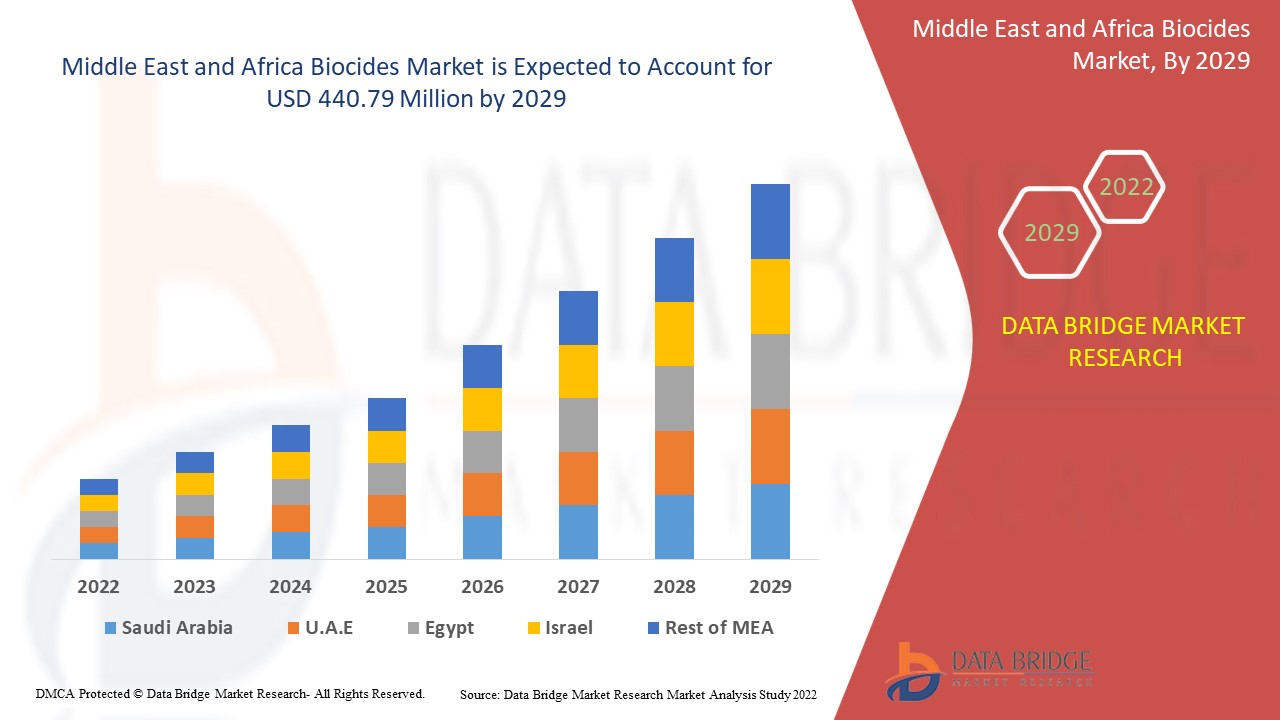
Middle East And Africa Biocides Market
Market Size in USD Billion
 USD
440.79 Billion
USD
611.03 Billion
2021
2029
USD
440.79 Billion
USD
611.03 Billion
2021
2029
| 2022 - 2029 | |
| USD 440.79 Billion | |
| USD 611.03 Billion | |
| % | |
Market Analysis and Size
The World Health Organization (WHO) estimates that 2.1 billion people worldwide lack access to safe drinking water in their homes. Water treatment is in high demand due to a lack of safe drinking water, which is boosting the biocides market across the region, since it is used as anti-fouling agents and disinfectants. Biocides are employed in a variety of industries, including healthcare, waste-water treatment, agriculture, food and drinks, paints, coatings, pulp, paper, plastics, and construction, due to their antimicrobial properties and widespread use as disinfectants, preservatives, and insecticides.
Middle East and Africa Biocides Market was valued at USD 611.03 million in 2021 and is expected to reach USD 440.79 million by 2029, registering a CAGR of 4.00% during the forecast period of 2022-2029. The market report curated by the Data Bridge Market Research team includes in-depth expert analysis, import/export analysis, pricing analysis, production consumption analysis, and climate chain scenario.
Market Definition
Biocides are products or chemicals that are used to kill pests or microbes. Mold, bacteria, algae, insects, and rodents are commonly utilized to manage and kill hazardous and undesired species. Disinfectants, wood preservatives, rodenticides, antifouling agents (on boats), in-can preservatives, and other biocides are used in households and public locations such as hospitals and industries.
Report Scope and Market Segmentation
|
Report Metric |
Details |
|
Forecast Period |
2022 to 2029 |
|
Base Year |
2021 |
|
Historic Years |
2020 (Customizable to 2019 - 2014) |
|
Quantitative Units |
Revenue in USD Million, Volumes in Units, Pricing in USD |
|
Segments Covered |
By Type (Halogen Compounds, Organic Acids, Nitrogen Based Biocides/Quaternary Ammonium Compounds, Metallic Compounds, Organosulfur Compounds, Phenolic Biocides, Others), Product Type (Preservatives, Pest Control, Others), Application (Water Treatment, Food and Beverage, Boilers and Industrial Cooling Towers, Personal Care, Wood Preservation, Paints and Coating, HVAC, Boilers, Oil and Gas, Fuels, Metal Working Fluids, Marine Industry, Plastics, Leather, Others) |
|
Countries Covered |
U.A.E, Saudi Arabia, Egypt, South Africa, Israel, Rest of Middle East and Africa |
|
Market Players Covered |
Lubrizol Corporation (U.S.), BASF SE (Germany), Clariant (Switzerland), Cortec Corporation (U.S.), Dow (U.S.), Akzo Nobel N.V. (Netherlands), Kemira (Finland), Thor (U.S.), BWA WATER ADDITIVES (U.S.), LANXESS (Germany), Albemarle Corporation (U.S.), Lonza (Switzerland), Baker Hughes (U.S.), General Electric Company (US), Buckman (U.S.), Valtris Specialty Chemicals (U.S.), Ecolab (U.S.), Merck KgaA (Germany) and Ques Industries, Inc. (U.S.). |
|
Market Opportunities |
|
Biocides Market Dynamics
This section deals with understanding the market drivers, advantages, opportunities, restraints and challenges. All of this is discussed in detail as below:
Drivers
- High Usage of Antimicrobial Protection in End Use Industries
Biocides have become increasingly popular in a variety of industries. Because cooling water systems provide a favorable environment for the growth of microorganisms, cooling towers are one of the most common application areas for biocides in power plants, mining, and chemical facilities is further anticipated to propel the growth of the biocides market.
- Increase in the Product Demand in Medical Industry
The medical business is expanding as a result of increased consumer awareness of health and hygiene. As a result, this factor is largely encouraging manufacturers to use new technologies in developing medical solutions, thus further contributing to the market growth.
- Growing Demand from Paints and Coatings Industry
The market is being driven by the growth of the paints and coatings market. The product is used to protect the painted surface against microbial contamination such as fungal or bacterial growth caused by air pollution and exposure to the outside environment in this sector.
Furthermore, the growing population has increased demand for agricultural products and created a global infrastructure need, as both the agriculture and construction sectors are heavy users of biocides in diverse commodities such as pesticides, plastics, and paints and coatings, which will further propel the growth rate of biocides market.
Opportunities
- Product Developments and Research and Development Activities
Furthermore, various product developments by the market players further enhance the applications of product, extend profitable opportunities to the market players in the forecast period of 2022 to 2029. Additionally, the growing research and development activities will further expand the future growth of the biocides market.
Restraints/Challenges
- Time-taking and Costly Registration Process
The biocidal product have to be approved before the before the market has put it on sale. Furthermore, before a biocidal product may be put on the market, the active ingredients in it must be approved. The cost of registering each biocides product under the new regulations, according to industry experts, is enormous. Furthermore, for the registration of all types of biocides, BPR necessitates massive amounts of toxicology and environmental effects testing. The registration process for biocidal products is slow and costly, posing a barrier to market expansion.
- Regulations and Raw Material Variations
On the other hand, the environmental regulations on the toxic biocides is further projected to impede the growth of the biocides market in the targeted period. However, the variations in the raw material prices might further challenge the growth of the biocides market in the near future. Therefore, these factors will further challenge the biocides market growth rate.
This biocides market report provides details of new recent developments, trade regulations, import-export analysis, production analysis, value chain optimization, market share, impact of domestic and localized market players, analyses opportunities in terms of emerging revenue pockets, changes in market regulations, strategic market growth analysis, market size, category market growths, application niches and dominance, product approvals, product launches, geographic expansions, technological innovations in the market. To gain more info on the biocides market contact Data Bridge Market Research for an Analyst Brief, our team will help you take an informed market decision to achieve market growth.
COVID-19 Impact on Biocides Market
The recent outbreak of coronavirus had a moderate impact on the biocides market. The oil and gas, paper and pulp, mining, home, industrial and institutional, paints and coatings, and wood industries are all heavily reliant on the market. The disruption in these industries caused a financial setback for the market. On the brighter side, the biocides' principal role is to kill hazardous bacteria, hence their demand has continued to rise during this time. To stop the infection from spreading, the public and industrial sectors utilized a variety of disinfectant agents. As a result, the market is have moderate growth over forecasted period.
Therefore, owing to disruptions in the global supply chain on the one hand, and increasing demand for disinfectants for household and personal care on the other, the biocides market is projected to be neutrally affected. However, in the post-COVID scenario, biocides market is projected to be significantly impacted, which will largely weigh on the market's revenue trajectory.
Recent Development
- In January 2021, LANXESS has purchased Intace SAS, a French company, as part of their expansion to maintain their position as one of the leading biocide manufacturers. Intace SAS is a French firm that specialises in the formulation and application of fungicides and biocide for the packaging sector. On January 14, 2021, LANXESS and the seller signed an agreement to that effect. The parties have agreed to keep the purchase price a secret. The transaction is expected to close in the first quarter of 2021, according to LANXESS.
Middle East and Africa Biocides Market Scope
The biocides market is segmented on the basis of type, product type and application. The growth amongst these segments will help you analyze meagre growth segments in the industries and provide the users with a valuable market overview and market insights to help them make strategic decisions for identifying core market applications.
Type
- Halogen Compounds
- Organic Acids
- Nitrogen Based Biocides/Quaternary Ammonium Compounds
- Metallic Compounds
- Organosulfur Compounds
- Phenolic Biocides
- Others
Product Type
- Preservatives
- Pest Control
- Others
Application
- Water Treatment
- Food and Beverage
- Boilers and Industrial Cooling Towers
- Personal Care
- Wood Preservation
- Paints and Coatings
- HVAC, Boilers
- Oil and Gas
- Fuels
- Metal Working Fluids
- Marine Industry
- Plastics
- Leather
- Others
Biocides Market Regional Analysis/Insights
The biocides market is analyzed and market size insights and trends are provided by country, type, product type and application as referenced above.
The countries covered in the biocides market report are Saudi Arabia, U.A.E, Israel, Egypt, South Africa, Rest of Middle East and Africa (MEA) as a part of Middle East and Africa (MEA).
The country section of the report also provides individual market impacting factors and changes in market regulation that impact the current and future trends of the market. Data points like down-stream and upstream value chain analysis, technical trends and porter's five forces analysis, case studies are some of the pointers used to forecast the market scenario for individual countries. Also, the presence and availability of global brands and their challenges faced due to large or scarce competition from local and domestic brands, impact of domestic tariffs and trade routes are considered while providing forecast analysis of the country data.
Competitive Landscape and Biocides Market Share Analysis
The biocides market competitive landscape provides details by competitor. Details included are company overview, company financials, revenue generated, market potential, investment in research and development, new market initiatives, global presence, production sites and facilities, production capacities, company strengths and weaknesses, product launch, product width and breadth, application dominance. The above data points provided are only related to the companies' focus related to biocides market.
Some of the major players operating in the biocides market are
- Lubrizol Corporation (U.S.)
- BASF SE (Germany)
- Clariant (Switzerland)
- Cortec Corporation (U.S.)
- Dow (U.S.)
- Akzo Nobel N.V. (Netherlands)
- Kemira (Finland)
- Thor (U.S.)
- BWA WATER ADDITIVES (U.S.)
- LANXESS (Germany)
- Albemarle Corporation (U.S.)
- Lonza (Switzerland)
- Baker Hughes (U.S.)
- General Electric Company (U.S.)
- Buckman (U.S.)
- Valtris Specialty Chemicals (U.S.)
- Ecolab (U.S.)
- Merck KgaA (Germany)
- Ques Industries, Inc. (U.S.)
SKU-

- Interactive Data Analysis Dashboard
- Company Analysis Dashboard for high growth potential opportunities
- Research Analyst Access for customization & queries
- Competitor Analysis with Interactive dashboard
- Latest News, Updates & Trend analysis
- Harness the Power of Benchmark Analysis for Comprehensive Competitor Tracking
Table of Content
1 INTRODUCTION
1.1 OBJECTIVES OF THE STUDY
1.2 MARKET DEFINITION
1.3 OVERVIEW OF MIDDLE EAST AND AFRICA BIOCIDES MARKET
1.4 LIMITATION
1.5 MARKETS COVERED
2 MARKET SEGMENTATION
2.1 MARKETS COVERED
2.2 GEOGRAPHICAL SCOPE
2.3 YEARS CONSIDERED FOR THE STUDY
2.4 CURRENCY AND PRICING
2.5 DBMR TRIPOD DATA VALIDATION MODEL
2.6 PRODUCT TYPE LIFE LINE CURVE
2.7 MULTIVARIATE MODELLING
2.8 PRIMARY INTERVIEWS WITH KEY OPINION LEADERS
2.9 DBMR MARKET POSITION GRID
2.1 MARKET APPLICATION COVERAGE GRID
2.11 DBMR MARKET CHALLENGE MATRIX
2.12 VENDOR SHARE ANALYSIS
2.13 IMPORT-EXPORT DATA
2.14 SECONDARY SOURCES
2.15 ASSUMPTIONS
3 EXECUTIVE SUMMARY
4 PREMIUM INSIGHTS
4.1 THE TOP PRODUCERS OF EACH TYPE OF BIOCIDE AS WELL AS A FEW SMALLER PLAYERS IN EACH MARKET
4.2 MARKET SIZE OF CALHYPO IN THE FOOD AND BEVERAGE INDUSTRY IN THE U.S.
4.3 BREAKOUT OF THE CANADIAN BIOCIDE MARKET BY APPLICATION
4.4 BREAKOUT THE CANADIAN HVAC BIOCIDE MARKET BY PRODUCT
4.5 MARKET SIZE OF DIDECYLDIMETHYLAMMONIUM CHLORIDE (DDAC – TYPE QUATS) IN SOUTH AFRICA
4.6 SOME OF THE TOP PRODUCERS OF DDAC QUATS SOLD IN SOUTH AFRICA ARE MENTIONED BELOW
5 IMPACT OF COVID-19 ON THE MIDDLE EAST AND AFRICA BIOCIDES MARKET
5.1 ANALYSIS ON IMPACT OF COVID-19 ON THE MIDDLE EAST AND AFRICA BIOCIDES MARKET
5.2 AFTERMATH OF COVID-19 AND GOVERNMENT INITIATIVE TO BOOST THE MIDDLE EAST AND AFRICA BIOCIDES MARKET
5.3 STRATEGIC DECISIONS FOR MANUFACTURERS AFTER COVID-19 TO GAIN COMPETITIVE MARKET SHARE
5.4 IMPACT ON DEMAND
5.5 IMPACT ON SUPPLY CHAIN
5.6 CONCLUSION
6 MARKET OVERVIEW
6.1 DRIVERS
6.1.1 GROWING CONSTRUCTION INDUSTRY AND ADOPTION OF POWDER COATINGS
6.1.2 INCREASING MODERN INFRASTRUCTURE AND LIGHTWEIGHT AUTOMOTIVE
6.1.3 RISING DEMAND FOR TREATED WATER FORM MUNICIPAL AND INDUSTRIAL WATER TREATMENT INDUSTRIES
6.1.4 RISING DEMAND FOR BIOCIDES AS PRESERVATIVES IN FOOD
6.1.5 RISING DEMAND FOR AGROCHEMICALS DUE TO RISE IN DEMAND FOR HIGH-QUALITY PEST-FREE CROP
6.1.6 GROWING DEMAND FOR PLASTICS IN LIGHT OF ITS INCREASING USE IN CONSTRUCTION AND AUTOMOTIVE INDUSTRIES
6.2 RESTRAINTS
6.2.1 RISING PRICES OF RAW MATERIALS
6.2.2 ENVIRONMENTAL REGULATIONS ON TOXIC BIOCIDES
6.3 OPPORTUNITIES
6.3.1 RISING DEVELOPMENT AND CONCERN TOWARDS PRODUCTION OF ECO-FRIENDLY BIOCIDES
6.3.2 RISE IN SPECIALTY BIOCIDES
6.4 CHALLENGE
6.4.1 INCREASING EFFICACY OF BIOCIDES
7 MIDDLE EAST AND AFRICA BIOCIDES MARKET, BY TYPE
7.1 OVERVIEW
7.2 HALOGEN COMPOUNDS
7.2.1 HYDANTOINS
7.2.1.1 HALOHYDANTOINS
7.2.1.1.1 BCDMH (ALSO KNOWN AS 1-BROMO-3-CHLORO-5,5-DIMETHYLHYDANTOIN)
7.2.1.1.2 DBDMH (ALSO KNOWN AS 1,3-DIBROMO-5,5-DIMETHYLHYDANTOIN)
7.2.1.1.3 OTHER HALOHYDANTOINS
7.2.1.2 DMDM (ALSO KNOWN AS 1,3-DIMETHYLOL-5,5-DIMETHYLHYDANTOIN)
7.2.2 CHLORINE
7.2.2.1 CHLORINE GAS
7.2.2.2 CHLORINE DIOXIDE
7.2.2.3 SODIUM HYPOCHLORITE
7.2.2.4 CALCIUM HYPOCHLORITE
7.2.2.5 ISOCYANURATES (DICHLOR & TRICHLOR)
7.2.1 BROMINE/LIQUID BROMINE
7.3 METALLIC COMPOUNDS
7.3.1 COPPER
7.3.2 MERCURY
7.3.3 MAGNESIUM
7.3.4 OTHERS
7.4 ORGANIC ACIDS
7.4.1 FORMIC ACID
7.4.2 LACTIC ACID
7.4.3 PERACETIC
7.4.4 OTHERS
7.5 NITROGEN BASED BIOCIDES (QUATERNARY AMMONIUM COMPOUNDS)
7.5.1 COMMODITY QUATS
7.5.1.1 ALKYLDIMETHYLBENZYLAMMONIUM CHLORIDE (ADBAC- TYPE QUATS)
7.5.1.2 DIDECYLDIMETHYLAMMONIUM CHLORIDE (DDAC – TYPE QUATS)
7.5.2 SPECIALTY QUATS
7.5.2.1 CARBOQUATS (CARBONATE AND BICARBONATE QUATERNARY AMMONIUM SALTS)
7.5.2.2 ALKYLDIMETHYLBENZYL AMMONIUM CHLORIDE (ADEBAC – TYPE QUATS)
7.6 ORGANOSULFUR COMPOUNDS
7.7 PHENOLIC BIOCIDES
7.8 OTHERS
8 MIDDLE EAST AND AFRICA BIOCIDES MARKET, BY PRODUCT TYPE
8.1 OVERVIEW
8.2 PRESERVATIVES
8.3 PEST CONTROL
8.4 OTHERS
9 MIDDLE EAST AND AFRICA BIOCIDES MARKET, BY APPLICATION
9.1 OVERVIEW
9.2 WATER TREATMENT
9.3 FOOD AND BEVERAGE
9.4 BOILERS AND INDUSTRIAL COOLING TOWERS
9.5 WOOD PRESERVATION
9.6 PAINTS AND COATINGS
9.7 PLASTICS
9.8 HVAC
9.9 FUELS
9.1 METAL WORKING FLUIDS
9.11 MARINE INDUSTRY
9.12 OIL AND GAS
9.13 PERSONAL CARE
9.14 LEATHER
9.15 OTHERS
10 MIDDLE EAST AND AFRICA BIOCIDES MARKET, BY GEOGRAPHY
10.1 MIDDLE EAST AND AFRICA
10.1.1 UNITED ARAB EMIRATES
10.1.2 SAUDI ARABIA
10.1.3 SOUTH AFRICA
10.1.4 ISRAEL
10.1.5 EGYPT
10.1.6 REST OF MIDDLE EAST AND AFRICA
11 MIDDLE EAST AND AFRICA BIOCIDES MARKET, COMPANY LANDSCAPE
11.1 COMPANY SHARE ANALYSIS: MIDDLE EAST AND AFRICA
12 SWOT ANALYSIS
13 COMPANY PROFILE
13.1 DOW
13.1.1 COMPANY SNAPSHOT
13.1.2 REVENUE ANALYSIS
13.1.3 COMPANY SHARE ANALYSIS
13.1.4 PRODUCT PORTFOLIO
13.1.5 RECENT UPDATES
13.2 SOLVAY
13.2.1 COMPANY SNAPSHOT
13.2.2 REVENUE ANALYSIS
13.2.3 COMPANY SHARE ANALYSIS
13.2.4 PRODUCT PORTFOLIO
13.2.5 RECENT UPDATES
13.3 LANXESS
13.3.1 COMPANY SNAPSHOT
13.3.2 REVENUE ANALYSIS
13.3.3 COMPANY SHARE ANALYSIS
13.3.4 PRODUCT PORTFOLIO
13.3.5 RECENT UPDATES
13.4 THE LUBRIZOL CORPORATION (A SUBSIDIARY OF BERKSHIRE HATHAWAY INC.)
13.4.1 COMPANY SNAPSHOT
13.4.2 REVENUE ANALYSIS
13.4.3 COMPANY SHARE ANALYSIS
13.4.4 PRODUCT PORTFOLIO
13.4.5 RECENT UPDATES
13.5 CLARIANT
13.5.1 COMPANY SNAPSHOT
13.5.2 REVENUE ANALYSIS
13.5.3 COMPANY SHARE ANALYSIS
13.5.4 PRODUCT PORTFOLIO
13.5.5 RECENT UPDATES
13.6 AKCROS CHEMICALS
13.6.1 COMPANY SNAPSHOT
13.6.2 PRODUCT PORTFOLIO
13.6.3 RECENT UPDATE
13.7 AKZO NOBEL N.V.
13.7.1 COMPANY SNAPSHOT
13.7.2 REVENUE ANALYSIS
13.7.3 PRODUCT PORTFOLIO
13.7.4 RECENT UPDATES
13.8 ALBEMARLE CORPORATION
13.8.1 COMPANY SNAPSHOT
13.8.2 REVENUE ANALYSIS
13.8.3 PRODUCT PORTFOLIO
13.8.4 RECENT UPDATES
13.9 BAKER HUGHES, A GE COMPANY LLC
13.9.1 COMPANY SNAPSHOT
13.9.2 REVENUE ANALYSIS
13.9.3 PRODUCT PORTFOLIO
13.9.4 RECENT UPDATE
13.1 BASF SE
13.10.1 COMPANY SNAPSHOT
13.10.2 REVENUE ANALYSIS
13.10.3 PRODUCT PORTFOLIO
13.10.4 RECENT UPDATES
13.11 BUCKMAN
13.11.1 COMPANY SNAPSHOT
13.11.2 PRODUCT PORTFOLIO
13.11.3 RECENT UPDATES
13.12 BWA WATER ADDITIVES
13.12.1 COMPANY SNAPSHOT
13.12.2 PRODUCT PORTFOLIO
13.12.3 RECENT UPDATES
13.13 CORBION
13.13.1 COMPANY SNAPSHOT
13.13.2 REVENUE ANALYSIS
13.13.3 PRODUCT PORTFOLIO
13.13.4 RECENT UPDATES
13.14 CORTEC CORPORATION
13.14.1 COMPANY SNAPSHOT
13.14.2 PRODUCT PORTFOLIO
13.14.3 RECENT UPDATES
13.15 CHEMAMDE
13.15.1 COMPANY SNAPSHOT
13.15.2 PRODUCT PORTFOLIO
13.15.3 RECENT UPDATE
13.16 DMP CORPORATION
13.16.1 COMPANY SNAPSHOT
13.16.2 PRODUCT PORTFOLIO
13.16.3 RECENT UPDATE
13.17 ECOLAB
13.17.1 COMPANY SNAPSHOT
13.17.2 REVENUE ANALYSIS
13.17.3 PRODUCT PORTFOLIO
13.17.4 RECENT UPDATES
13.18 KEMIRA
13.18.1 COMPANY SNAPSHOT
13.18.2 REVENUE ANALYSIS
13.18.3 PRODUCT PORTFOLIO
13.18.4 RECENT UPDATES
13.19 LONZA
13.19.1 COMPANY SNAPSHOT
13.19.2 REVENUE ANALYSIS
13.19.3 PRODUCT PORTFOLIO
13.19.4 RECENT UPDATES
13.2 MERCK KGAA
13.20.1 COMPANY SNAPSHOT
13.20.2 REVENUE ANALYSIS
13.20.3 PRODUCT PORTFOLIO
13.20.4 RECENT UPDATE
13.21 THOR
13.21.1 COMPANY SNAPSHOT
13.21.2 PRODUCT PORTFOLIO
13.21.3 RECENT UPDATES
13.22 VALTRIS SPECIALTY CHEMICALS
13.22.1 COMPANY SNAPSHOT
1.1.1 PRODUCT PORTFOLIO
13.22.2 RECENT UPDATES
13.23 QUES INDUSTRIES, INC.
13.23.1 COMPANY SNAPSHOT
13.23.2 PRODUCT PORTFOLIO
13.23.3 RECENT UPDATE
14 QUESTIONNAIRE
15 RELATED REPORTS
List of Table
LIST OF TABLES
TABLE 1 IMPORT DATA OF PRODUCT: 3808 INSECTICIDES, RODENTICIDES, FUNGICIDES, HERBICIDES, ANTI-SPROUTING PRODUCTS AND PLANT-GROWTH.HS CODE: 3808 (USD THOUSAND)
TABLE 2 EXPORT DATA OF PRODUCT: 3808 INSECTICIDES, RODENTICIDES, FUNGICIDES, HERBICIDES, ANTI-SPROUTING PRODUCTS AND PLANT-GROWTH.HS CODE: 3808 (USD THOUSAND)
TABLE 3 MIDDLE EAST AND AFRICA TOP PRODUCERS OF BIOCIDES, BY BIOCIDE TYPE
TABLE 4 U.S. CALCIUM HYPOCHLORITE (CALHYPO) IN BIOCIDES MARKET, BY FOOD AND BEVERAGE APPLICATION, 2018-2027 (USD MILLION)
TABLE 5 CANADA BIOCIDES MARKET, BY APPLICATION, 2018-2027 (USD MILLION)
TABLE 6 CANADA HVAC IN BIOCIDES MARKET, BY TYPE, 2018-2027 (USD MILLION)
TABLE 7 SOUTH AFRICA DDAC QUATS IN BIOCIDES MARKET, 2018-2027 (USD MILLION)
TABLE 8 LIST OF TRADITIONAL AND NATURAL FOOD ADDITIVES APPROVED BY FDA
TABLE 9 LIST OF CHEMICAL FOOD PRESERVATIVES APPROVED BY FDA
TABLE 10 MIDDLE EAST AND AFRICA BIOCIDES MARKET, BY TYPE, 2018-2027 (TONS)
TABLE 11 MIDDLE EAST AND AFRICA BIOCIDES MARKET, BY TYPE, 2018-2027 (USD MILLION)
TABLE 12 MIDDLE EAST AND AFRICA HALOGEN COMPOUNDS IN BIOCIDES MARKET, BY REGION, 2018-2027 (TONS)
TABLE 13 MIDDLE EAST AND AFRICA HALOGEN COMPOUNDS IN BIOCIDES MARKET, BY REGION, 2018-2027 (USD MILLION)
TABLE 14 MIDDLE EAST AND AFRICA HALOGEN COMPOUNDS IN BIOCIDES MARKET, BY HALOGEN COMPOUNDS TYPE, 2018-2027 (USD MILLION)
TABLE 15 MIDDLE EAST AND AFRICA HYDANTOINS IN BIOCIDES MARKET, BY HYDANTOINS TYPE, 2018-2027 (USD MILLION)
TABLE 16 MIDDLE EAST AND AFRICA HALOHYDANTOINS IN BIOCIDES MARKET, BY HALOHYDANTOINS TYPE, 2018-2027 (USD MILLION)
TABLE 17 MIDDLE EAST AND AFRICA CHLORINE IN BIOCIDES MARKET, BY CHLORINE TYPE, 2018-2027 (USD MILLION)
TABLE 18 MIDDLE EAST AND AFRICA METALLIC COMPOUNDS IN BIOCIDES MARKET, BY REGION, 2018-2027 (TONS)
TABLE 19 MIDDLE EAST AND AFRICA METALLIC COMPOUNDS IN BIOCIDES MARKET, BY REGION, 2018-2027 (USD MILLION)
TABLE 20 MIDDLE EAST AND AFRICA METALLIC COMPOUNDS IN BIOCIDES MARKET, BY METALLIC COMPOUNDS TYPE, 2018-2027 (USD MILLION)
TABLE 21 MIDDLE EAST AND AFRICA ORGANIC ACIDS IN BIOCIDES MARKET, BY REGION, 2018-2027 (TONS)
TABLE 22 MIDDLE EAST AND AFRICA ORGANIC ACIDS IN BIOCIDES MARKET, BY REGION, 2018-2027 (USD MILLION)
TABLE 23 MIDDLE EAST AND AFRICA ORGANIC ACIDS IN BIOCIDES MARKET, BY ORGANIC ACIDS TYPE, 2018-2027 (USD MILLION)
TABLE 24 MIDDLE EAST AND AFRICA NITROGEN BASED BIOCIDES (QUATERNARY AMMONIUM COMPOUNDS) IN BIOCIDES MARKET, BY REGION, 2018-2027 (TONS)
TABLE 25 MIDDLE EAST AND AFRICA NITROGEN BASED BIOCIDES (QUATERNARY AMMONIUM COMPOUNDS) IN BIOCIDES MARKET, BY REGION, 2018-2027 (USD MILLION)
TABLE 26 MIDDLE EAST AND AFRICA NITROGEN BASED BIOCIDES (QUATERNARY AMMONIUM COMPOUNDS) IN BIOCIDES MARKET, BY NITROGEN BASED BIOCIDES (QUATERNARY AMMONIUM COMPOUNDS) TYPE, 2018-2027 (USD MILLION)
TABLE 27 MIDDLE EAST AND AFRICA COMMODITY QUATS IN BIOCIDES MARKET, BY COMMODITY QUATS TYPE, 2018-2027 (USD MILLION)
TABLE 28 MIDDLE EAST AND AFRICA SPECIALTY QUATS IN BIOCIDES MARKET, BY SPECIALTY QUATS TYPE, 2018-2027 (USD MILLION)
TABLE 29 MIDDLE EAST AND AFRICA ORGANOSULFUR COMPOUNDS IN BIOCIDES MARKET, BY REGION, 2018-2027 (TONS)
TABLE 30 MIDDLE EAST AND AFRICA ORGANOSULFUR COMPOUNDS IN BIOCIDES MARKET, BY REGION, 2018-2027 (USD MILLION)
TABLE 31 MIDDLE EAST AND AFRICA PHENOLIC BIOCIDES IN BIOCIDES MARKET, BY REGION, 2018-2027 (TONS)
TABLE 32 MIDDLE EAST AND AFRICA PHENOLIC BIOCIDES IN BIOCIDES MARKET, BY REGION, 2018-2027 (USD MILLION)
TABLE 33 MIDDLE EAST AND AFRICA OTHERS IN BIOCIDES MARKET, BY REGION, 2018-2027 (TONS)
TABLE 34 MIDDLE EAST AND AFRICA OTHERS IN BIOCIDES MARKET, BY REGION, 2018-2027 (USD MILLION)
TABLE 35 MIDDLE EAST AND AFRICA BIOCIDES MARKET, BY PRODUCT TYPE, 2018-2027 (USD MILLION)
TABLE 36 MIDDLE EAST AND AFRICA PRESERVATIVES IN BIOCIDES MARKET, BY REGION, 2018-2027 (USD MILLION)
TABLE 37 MIDDLE EAST AND AFRICA PEST CONTROL IN BIOCIDES MARKET, BY REGION, 2018-2027 (USD MILLION)
TABLE 38 MIDDLE EAST AND AFRICA OTHERS IN BIOCIDES MARKET, BY REGION, 2018-2027 (USD MILLION)
TABLE 39 MIDDLE EAST AND AFRICA BIOCIDES MARKET, BY APPLICATION, 2018-2027 (USD MILLION)
TABLE 40 MIDDLE EAST AND AFRICA WATER TREATMENT IN BIOCIDES MARKET, BY REGION, 2018-2027 (USD MILLION)
TABLE 41 MIDDLE EAST AND AFRICA FOOD AND BEVERAGE IN BIOCIDES MARKET, BY REGION, 2018-2027 (USD MILLION)
TABLE 42 MIDDLE EAST AND AFRICA BOILERS AND INDUSTRIAL COOLING TOWERS IN BIOCIDES MARKET, BY REGION, 2018-2027 (USD MILLION)
TABLE 43 MIDDLE EAST AND AFRICA WOOD PRESRVATION IN BIOCIDES MARKET, BY REGION, 2018-2027 (USD MILLION)
TABLE 44 MIDDLE EAST AND AFRICA PAINTS AND COATINGS IN BIOCIDES MARKET, BY REGION, 2018-2027 (USD MILLION)
TABLE 45 MIDDLE EAST AND AFRICA PAINTS AND COATINGS IN BIOCIDES MARKET, BY REGION, 2018-2027 (USD MILLION)
TABLE 46 MIDDLE EAST AND AFRICA HVAC IN BIOCIDES MARKET, BY REGION, 2018-2027 (USD MILLION)
TABLE 47 MIDDLE EAST AND AFRICA FUELS IN BIOCIDES MARKET, BY REGION, 2018-2027 (USD MILLION)
TABLE 48 MIDDLE EAST AND AFRICA METAL WORKING FLUIDS IN BIOCIDES MARKET, BY REGION, 2018-2027 (USD MILLION)
TABLE 49 MIDDLE EAST AND AFRICA MARINE INDUSTRY IN BIOCIDES MARKET, BY REGION, 2018-2027 (USD MILLION)
TABLE 50 MIDDLE EAST AND AFRICA MARINE INDUSTRY IN BIOCIDES MARKET, BY REGION, 2018-2027 (USD MILLION)
TABLE 51 MIDDLE EAST AND AFRICA PERSONAL CARE IN BIOCIDES MARKET, BY REGION, 2018-2027 (USD MILLION)
TABLE 52 MIDDLE EAST AND AFRICA LEATHER IN BIOCIDES MARKET, BY REGION, 2018-2027 (USD MILLION)
TABLE 53 MIDDLE EAST AND AFRICA OTHERS IN BIOCIDES MARKET, BY REGION, 2018-2027 (USD MILLION)
TABLE 54 MIDDLE EAST AND AFRICA BIOCIDES MARKET, BY REGION, 2018-2027 (KILO TONS)
TABLE 55 MIDDLE EAST AND AFRICA BIOCIDES MARKET, BY REGION, 2018-2027 (USD MILLION)
TABLE 56 MIDDLE EAST AND AFRICA BIOCIDES MARKET, BY TYPE, 2018-2027 (KILO TONS)
TABLE 57 MIDDLE EAST AND AFRICA BIOCIDES MARKET, BY TYPE, 2018-2027 (USD MILLION)
TABLE 58 MIDDLE EAST AND AFRICA HALOGEN COMPOUNDS IN BIOCIDES MARKET, BY HALOGEN COMPOUNDS TYPE, 2018-2027 (USD MILLION)
TABLE 59 MIDDLE EAST AND AFRICA HYDANTOINS IN BIOCIDES MARKET, BY HYDANTOINS TYPE, 2018-2027 (USD MILLION)
TABLE 60 MIDDLE EAST AND AFRICA HALOHYDANTOINS IN BIOCIDES MARKET, BY HALOHYDANTOINS TYPE, 2018-2027 (USD MILLION)
TABLE 61 MIDDLE EAST AND AFRICA CHLORINE IN BIOCIDES MARKET, BY CHLORINE TYPE, 2018-2027 (USD MILLION)
TABLE 62 MIDDLE EAST AND AFRICA METALLIC COMPOUNDS IN BIOCIDES MARKET, BY METALLIC COMPOUNDS TYPE, 2018-2027 (USD MILLION)
TABLE 63 MIDDLE EAST AND AFRICA ORGANIC ACIDS IN BIOCIDES MARKET, BY ORGANIC ACIDS TYPE, 2018-2027 (USD MILLION)
TABLE 64 MIDDLE EAST AND AFRICA NITROGEN BASED BIOCIDES (QUATERNARY AMMONIUM COMPOUNDS) IN BIOCIDES MARKET, BY NITROGEN BASED BIOCIDES (QUATERNARY AMMONIUM COMPOUNDS) TYPE, 2018-2027 (USD MILLION)
TABLE 65 MIDDLE EAST AND AFRICA COMMODITY QUATS IN BIOCIDES MARKET, BY COMMODITY QUATS TYPE, 2018-2027 (USD MILLION)
TABLE 66 MIDDLE EAST AND AFRICA SPECIALTY QUATS IN BIOCIDES MARKET, BY SPECIALTY QUATS TYPE, 2018-2027 (USD MILLION)
TABLE 67 MIDDLE EAST AND AFRICA BIOCIDES MARKET, BY PRODUCT TYPE, 2018-2027 (USD MILLION)
TABLE 68 MIDDLE EAST AND AFRICA BIOCIDES MARKET, BY APPLICATION, 2018-2027 (USD MILLION)
TABLE 69 UNITED ARAB EMIRATES BIOCIDES MARKET, BY TYPE, 2018-2027 (KILO TONS)
TABLE 70 UNITED ARAB EMIRATES BIOCIDES MARKET, BY TYPE, 2018-2027 (USD MILLION)
TABLE 71 UNITED ARAB EMIRATES HALOGEN COMPOUNDS IN BIOCIDES MARKET, BY HALOGEN COMPOUNDS TYPE, 2018-2027 (USD MILLION)
TABLE 72 UNITED ARAB EMIRATES HYDANTOINS IN BIOCIDES MARKET, BY HYDANTOINS TYPE, 2018-2027 (USD MILLION)
TABLE 73 UNITED ARAB EMIRATES HALOHYDANTOINS IN BIOCIDES MARKET, BY HALOHYDANTOINS TYPE, 2018-2027 (USD MILLION)
TABLE 74 UNITED ARAB EMIRATES CHLORINE IN BIOCIDES MARKET, BY CHLORINE TYPE, 2018-2027 (USD MILLION)
TABLE 75 UNITED ARAB EMIRATES METALLIC COMPOUNDS IN BIOCIDES MARKET, BY METALLIC COMPOUNDS TYPE, 2018-2027 (USD MILLION)
TABLE 76 UNITED ARAB EMIRATES ORGANIC ACIDS IN BIOCIDES MARKET, BY ORGANIC ACIDS TYPE, 2018-2027 (USD MILLION)
TABLE 77 UNITED ARAB EMIRATES NITROGEN BASED BIOCIDES (QUATERNARY AMMONIUM COMPOUNDS) IN BIOCIDES MARKET, BY NITROGEN BASED BIOCIDES (QUATERNARY AMMONIUM COMPOUNDS) TYPE, 2018-2027 (USD MILLION)
TABLE 78 UNITED ARAB EMIRATES COMMODITY QUATS IN BIOCIDES MARKET, BY COMMODITY QUATS TYPE, 2018-2027 (USD MILLION)
TABLE 79 UNITED ARAB EMIRATES SPECIALTY QUATS IN BIOCIDES MARKET, BY SPECIALTY QUATS TYPE, 2018-2027 (USD MILLION)
TABLE 80 UNITED ARAB EMIRATES BIOCIDES MARKET, BY PRODUCT TYPE, 2018-2027 (USD MILLION)
TABLE 81 UNITED ARAB EMIRATES BIOCIDES MARKET, BY APPLICATION, 2018-2027 (USD MILLION)
TABLE 82 SAUDI ARABIA BIOCIDES MARKET, BY TYPE, 2018-2027 (KILO TONS)
TABLE 83 SAUDI ARABIA BIOCIDES MARKET, BY TYPE, 2018-2027 (USD MILLION)
TABLE 84 SAUDI ARABIA HALOGEN COMPOUNDS IN BIOCIDES MARKET, BY HALOGEN COMPOUNDS TYPE, 2018-2027 (USD MILLION)
TABLE 85 SAUDI ARABIA HYDANTOINS IN BIOCIDES MARKET, BY HYDANTOINS TYPE, 2018-2027 (USD MILLION)
TABLE 86 SAUDI ARABIA HALOHYDANTOINS IN BIOCIDES MARKET, BY HALOHYDANTOINS TYPE, 2018-2027 (USD MILLION)
TABLE 87 SAUDI ARABIA CHLORINE IN BIOCIDES MARKET, BY CHLORINE TYPE, 2018-2027 (USD MILLION)
TABLE 88 SAUDI ARABIA METALLIC COMPOUNDS IN BIOCIDES MARKET, BY METALLIC COMPOUNDS TYPE, 2018-2027 (USD MILLION)
TABLE 89 SAUDI ARABIA ORGANIC ACIDS IN BIOCIDES MARKET, BY ORGANIC ACIDS TYPE, 2018-2027 (USD MILLION)
TABLE 90 SAUDI ARABIA NITROGEN BASED BIOCIDES (QUATERNARY AMMONIUM COMPOUNDS) IN BIOCIDES MARKET, BY NITROGEN BASED BIOCIDES (QUATERNARY AMMONIUM COMPOUNDS) TYPE, 2018-2027 (USD MILLION)
TABLE 91 SAUDI ARABIA COMMODITY QUATS IN BIOCIDES MARKET, BY COMMODITY QUATS TYPE, 2018-2027 (USD MILLION)
TABLE 92 SAUDI ARABIA SPECIALTY QUATS IN BIOCIDES MARKET, BY SPECIALTY QUATS TYPE, 2018-2027 (USD MILLION)
TABLE 93 SAUDI ARABIA BIOCIDES MARKET, BY PRODUCT TYPE, 2018-2027 (USD MILLION)
TABLE 94 SAUDI ARABIA BIOCIDES MARKET, BY APPLICATION, 2018-2027 (USD MILLION)
TABLE 95 SOUTH AFRICA BIOCIDES MARKET, BY TYPE, 2018-2027 (KILO TONS)
TABLE 96 SOUTH AFRICA BIOCIDES MARKET, BY TYPE, 2018-2027 (USD MILLION)
TABLE 97 SOUTH AFRICA HALOGEN COMPOUNDS IN BIOCIDES MARKET, BY HALOGEN COMPOUNDS TYPE, 2018-2027 (USD MILLION)
TABLE 98 SOUTH AFRICA HYDANTOINS IN BIOCIDES MARKET, BY HYDANTOINS TYPE, 2018-2027 (USD MILLION)
TABLE 99 SOUTH AFRICA HALOHYDANTOINS IN BIOCIDES MARKET, BY HALOHYDANTOINS TYPE, 2018-2027 (USD MILLION)
TABLE 100 SOUTH AFRICA CHLORINE IN BIOCIDES MARKET, BY CHLORINE TYPE, 2018-2027 (USD MILLION)
TABLE 101 SOUTH AFRICA METALLIC COMPOUNDS IN BIOCIDES MARKET, BY METALLIC COMPOUNDS TYPE, 2018-2027 (USD MILLION)
TABLE 102 SOUTH AFRICA ORGANIC ACIDS IN BIOCIDES MARKET, BY ORGANIC ACIDS TYPE, 2018-2027 (USD MILLION)
TABLE 103 SOUTH AFRICA NITROGEN BASED BIOCIDES (QUATERNARY AMMONIUM COMPOUNDS) IN BIOCIDES MARKET, BY NITROGEN BASED BIOCIDES (QUATERNARY AMMONIUM COMPOUNDS) TYPE, 2018-2027 (USD MILLION)
TABLE 104 SOUTH AFRICA COMMODITY QUATS IN BIOCIDES MARKET, BY COMMODITY QUATS TYPE, 2018-2027 (USD MILLION)
TABLE 105 SOUTH AFRICA SPECIALTY QUATS IN BIOCIDES MARKET, BY SPECIALTY QUATS TYPE, 2018-2027 (USD MILLION)
TABLE 106 SOUTH AFRICA BIOCIDES MARKET, BY PRODUCT TYPE, 2018-2027 (USD MILLION)
TABLE 107 SOUTH AFRICA BIOCIDES MARKET, BY APPLICATION, 2018-2027 (USD MILLION)
TABLE 108 ISRAEL BIOCIDES MARKET, BY TYPE, 2018-2027 (KILO TONS)
TABLE 109 ISRAEL BIOCIDES MARKET, BY TYPE, 2018-2027 (USD MILLION)
TABLE 110 ISRAEL HALOGEN COMPOUNDS IN BIOCIDES MARKET, BY HALOGEN COMPOUNDS TYPE, 2018-2027 (USD MILLION)
TABLE 111 ISRAEL HYDANTOINS IN BIOCIDES MARKET, BY HYDANTOINS TYPE, 2018-2027 (USD MILLION)
TABLE 112 ISRAEL HALOHYDANTOINS IN BIOCIDES MARKET, BY HALOHYDANTOINS TYPE, 2018-2027 (USD MILLION)
TABLE 113 ISRAEL CHLORINE IN BIOCIDES MARKET, BY CHLORINE TYPE, 2018-2027 (USD MILLION)
TABLE 114 ISRAEL METALLIC COMPOUNDS IN BIOCIDES MARKET, BY METALLIC COMPOUNDS TYPE, 2018-2027 (USD MILLION)
TABLE 115 ISRAEL ORGANIC ACIDS IN BIOCIDES MARKET, BY ORGANIC ACIDS TYPE, 2018-2027 (USD MILLION)
TABLE 116 ISRAEL NITROGEN BASED BIOCIDES (QUATERNARY AMMONIUM COMPOUNDS) IN BIOCIDES MARKET, BY NITROGEN BASED BIOCIDES (QUATERNARY AMMONIUM COMPOUNDS) TYPE, 2018-2027 (USD MILLION)
TABLE 117 ISRAEL COMMODITY QUATS IN BIOCIDES MARKET, BY COMMODITY QUATS TYPE, 2018-2027 (USD MILLION)
TABLE 118 ISRAEL SPECIALTY QUATS IN BIOCIDES MARKET, BY SPECIALTY QUATS TYPE, 2018-2027 (USD MILLION)
TABLE 119 ISRAEL BIOCIDES MARKET, BY PRODUCT TYPE, 2018-2027 (USD MILLION)
TABLE 120 ISRAEL BIOCIDES MARKET, BY APPLICATION, 2018-2027 (USD MILLION)
TABLE 121 EGYPT BIOCIDES MARKET, BY TYPE, 2018-2027 (KILO TONS)
TABLE 122 EGYPT BIOCIDES MARKET, BY TYPE, 2018-2027 (USD MILLION)
TABLE 123 EGYPT HALOGEN COMPOUNDS IN BIOCIDES MARKET, BY HALOGEN COMPOUNDS TYPE, 2018-2027 (USD MILLION)
TABLE 124 EGYPT HYDANTOINS IN BIOCIDES MARKET, BY HYDANTOINS TYPE, 2018-2027 (USD MILLION)
TABLE 125 EGYPT HALOHYDANTOINS IN BIOCIDES MARKET, BY HALOHYDANTOINS TYPE, 2018-2027 (USD MILLION)
TABLE 126 EGYPT CHLORINE IN BIOCIDES MARKET, BY CHLORINE TYPE, 2018-2027 (USD MILLION)
TABLE 127 EGYPT METALLIC COMPOUNDS IN BIOCIDES MARKET, BY METALLIC COMPOUNDS TYPE, 2018-2027 (USD MILLION)
TABLE 128 EGYPT ORGANIC ACIDS IN BIOCIDES MARKET, BY ORGANIC ACIDS TYPE, 2018-2027 (USD MILLION)
TABLE 129 EGYPT NITROGEN BASED BIOCIDES (QUATERNARY AMMONIUM COMPOUNDS) IN BIOCIDES MARKET, BY NITROGEN BASED BIOCIDES (QUATERNARY AMMONIUM COMPOUNDS) TYPE, 2018-2027 (USD MILLION)
TABLE 130 EGYPT COMMODITY QUATS IN BIOCIDES MARKET, BY COMMODITY QUATS TYPE, 2018-2027 (USD MILLION)
TABLE 131 EGYPT SPECIALTY QUATS IN BIOCIDES MARKET, BY SPECIALTY QUATS TYPE, 2018-2027 (USD MILLION)
TABLE 132 EGYPT BIOCIDES MARKET, BY PRODUCT TYPE, 2018-2027 (USD MILLION)
TABLE 133 EGYPT BIOCIDES MARKET, BY APPLICATION, 2018-2027 (USD MILLION)
TABLE 134 REST OF MIDDLE EAST AND AFRICA BIOCIDES MARKET, BY TYPE, 2018-2027 (KILO TONS)
TABLE 135 REST OF MIDDLE EAST AND AFRICA BIOCIDES MARKET, BY TYPE, 2018-2027 (USD MILLION)
List of Figure
LIST OF FIGURES
FIGURE 1 MIDDLE EAST AND AFRICA BIOCIDES MARKET: SEGMENTATION
FIGURE 2 MIDDLE EAST AND AFRICA BIOCIDES MARKET: DATA TRIANGULATION
FIGURE 3 MIDDLE EAST AND AFRICA BIOCIDES MARKET: DROC ANALYSIS
FIGURE 4 MIDDLE EAST AND AFRICA BIOCIDES MARKET: MIDDLE EAST AND AFRICA VS REGIONAL MARKET ANALYSIS
FIGURE 5 MIDDLE EAST AND AFRICA BIOCIDES MARKET: COMPANY RESEARCH ANALYSIS
FIGURE 6 MIDDLE EAST AND AFRICA BIOCIDES MARKET: THE PRODUCT TYPE LIFE LINE CURVE
FIGURE 7 MIDDLE EAST AND AFRICA BIOCIDES MARKET: INTERVIEW DEMOGRAPHICS
FIGURE 8 MIDDLE EAST AND AFRICA BIOCIDES MARKET: DBMR MARKET POSITION GRID
FIGURE 9 MIDDLE EAST AND AFRICA BIOCIDES MARKET: MARKET APPLICATION COVERAGE GRID
FIGURE 10 MIDDLE EAST AND AFRICA BIOCIDES MARKET: THE MARKET CHALLENGE MATRIX
FIGURE 11 MIDDLE EAST AND AFRICA BIOCIDES MARKET: VENDOR SHARE ANALYSIS
FIGURE 12 MIDDLE EAST AND AFRICA BIOCIDES MARKET: SEGMENTATION
FIGURE 13 GROWTH IN THE USE OF BIOCIDES AS DISINFECTANTS IN THE MEDICAL AND PHARMACEUTICAL INDUSTRY IS DRIVING THE MIDDLE EAST AND AFRICA BIOCIDES MARKET IN THE FORECAST PERIOD OF 2020 TO 2027
FIGURE 14 HALOGEN COMPOUNDS IS EXPECTED TO ACCOUNT FOR THE LARGEST SHARE OF THE MIDDLE EAST AND AFRICA BIOCIDES MARKET IN 2020 & 2027
FIGURE 15 DRIVERS, RESTRAINTS, OPPORTUNITIES AND CHALLENGE OF MIDDLE EAST AND AFRICA BIOCIDES MARKET
FIGURE 16 MIDDLE EAST AND AFRICA BIOCIDES MARKET: BY PRODUCT TYPE, 2019
FIGURE 17 MIDDLE EAST AND AFRICA BIOCIDES MARKET: BY PRODUCT TYPE, 2019
FIGURE 18 MIDDLE EAST AND AFRICA BIOCIDES MARKET: BY APPLICATION, 2019
FIGURE 19 MIDDLE EAST AND AFRICA BIOCIDES MARKET: SNAPSHOT (2019)
FIGURE 20 MIDDLE EAST AND AFRICA BIOCIDES MARKET: BY COUNTRY (2019)
FIGURE 21 MIDDLE EAST AND AFRICA BIOCIDES MARKET: BY COUNTRY (2020 & 2027)
FIGURE 22 MIDDLE EAST AND AFRICA BIOCIDES MARKET: BY COUNTRY (2019 & 2027)
FIGURE 23 MIDDLE EAST AND AFRICA BIOCIDES MARKET: BY TYPE (2020-2027)
FIGURE 24 MIDDLE EAST AND AFRICA BIOCIDES MARKET: COMPANY SHARE 2019 (%)
Middle East And Africa Biocides Market, Supply Chain Analysis and Ecosystem Framework
To support market growth and help clients navigate the impact of geopolitical shifts, DBMR has integrated in-depth supply chain analysis into its Middle East And Africa Biocides Market research reports. This addition empowers clients to respond effectively to global changes affecting their industries. The supply chain analysis section includes detailed insights such as Middle East And Africa Biocides Market consumption and production by country, price trend analysis, the impact of tariffs and geopolitical developments, and import and export trends by country and HSN code. It also highlights major suppliers with data on production capacity and company profiles, as well as key importers and exporters. In addition to research, DBMR offers specialized supply chain consulting services backed by over a decade of experience, providing solutions like supplier discovery, supplier risk assessment, price trend analysis, impact evaluation of inflation and trade route changes, and comprehensive market trend analysis.
Data collection and base year analysis are done using data collection modules with large sample sizes. The stage includes obtaining market information or related data through various sources and strategies. It includes examining and planning all the data acquired from the past in advance. It likewise envelops the examination of information inconsistencies seen across different information sources. The market data is analysed and estimated using market statistical and coherent models. Also, market share analysis and key trend analysis are the major success factors in the market report. To know more, please request an analyst call or drop down your inquiry.
The key research methodology used by DBMR research team is data triangulation which involves data mining, analysis of the impact of data variables on the market and primary (industry expert) validation. Data models include Vendor Positioning Grid, Market Time Line Analysis, Market Overview and Guide, Company Positioning Grid, Patent Analysis, Pricing Analysis, Company Market Share Analysis, Standards of Measurement, Global versus Regional and Vendor Share Analysis. To know more about the research methodology, drop in an inquiry to speak to our industry experts.
Data Bridge Market Research is a leader in advanced formative research. We take pride in servicing our existing and new customers with data and analysis that match and suits their goal. The report can be customized to include price trend analysis of target brands understanding the market for additional countries (ask for the list of countries), clinical trial results data, literature review, refurbished market and product base analysis. Market analysis of target competitors can be analyzed from technology-based analysis to market portfolio strategies. We can add as many competitors that you require data about in the format and data style you are looking for. Our team of analysts can also provide you data in crude raw excel files pivot tables (Fact book) or can assist you in creating presentations from the data sets available in the report.


