North America Biostimulants Market
Tamanho do mercado em biliões de dólares
CAGR :
% 
 USD
1,333.80 Million
USD
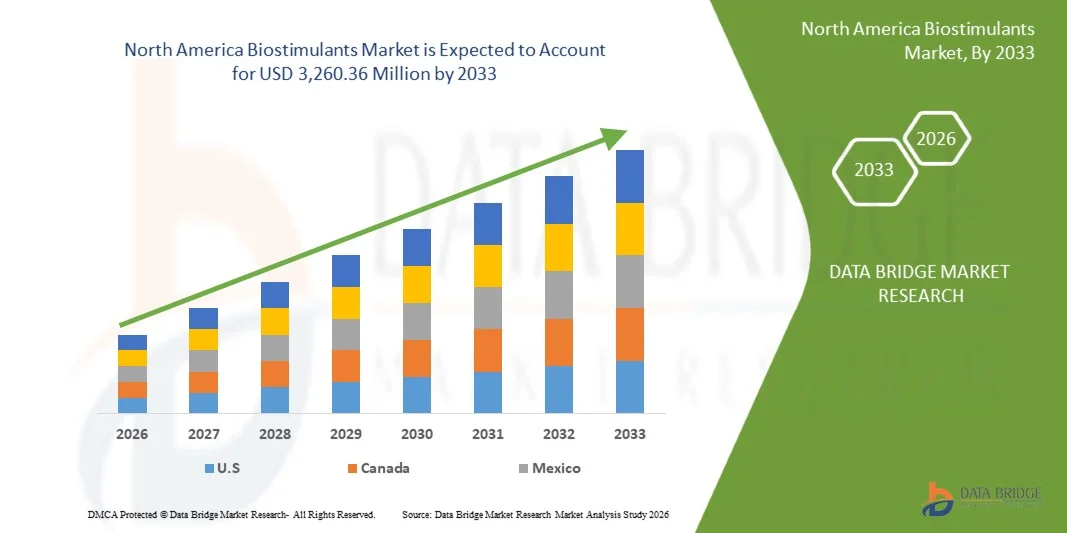
3,260.36 Million
2025
2033
USD
1,333.80 Million
USD
3,260.36 Million
2025
2033
| 2026 –2033 | |
| USD 1,333.80 Million | |
| USD 3,260.36 Million | |
| % | |
|
Segmentação do mercado de bioestimulantes na América do Norte, por origem (bioestimulantes sintéticos, bioestimulantes naturais), por forma (líquida, seca), por ingredientes ativos (vitaminas do complexo B, quitosana, quitina, aditivos microbianos, hidrolisados de proteína, à base de extrato, à base de ácido, outros), por método de aplicação (tratamento de sementes, tratamento do solo, tratamento foliar), por cultura (gramados ornamentais, oleaginosas e leguminosas, cereais e grãos, frutas e hortaliças, outras culturas), por usuário final (institutos de pesquisa, agricultores) - Tendências e previsões do setor até 2033.
Tamanho do mercado de bioestimulantes na América do Norte
- O mercado de bioestimulantes na América do Norte foi avaliado em US$ 1.333,80 milhões em 2025 e deverá atingir US$ 3.260,36 milhões em 2033 , com uma taxa de crescimento anual composta (CAGR) de 11,5% durante o período de previsão.
- O crescimento do mercado é impulsionado principalmente pela crescente demanda por aditivos naturais e sustentáveis em setores-chave como alimentos e bebidas, couro, produtos farmacêuticos e ração animal. Os avanços nas tecnologias de extração e processamento estão aprimorando a eficiência e a qualidade da produção de bioestimulantes, além de fomentar maior digitalização e inovação no setor.
- A crescente preferência do consumidor por produtos à base de plantas e ecologicamente corretos está fortalecendo a posição dos bioestimulantes como uma alternativa atraente aos produtos químicos sintéticos. Juntos, esses fatores estão acelerando a adoção de soluções baseadas em bioestimulantes e contribuindo substancialmente para a expansão do mercado de bioestimulantes na América do Norte.
Análise do Mercado de Bioestimulantes na América do Norte
- Os bioestimulantes, compostos polifenólicos naturais encontrados em diversas plantas, estão se tornando cada vez mais vitais em vários setores — incluindo alimentos e bebidas, processamento de couro, produtos farmacêuticos, ração animal e tratamento de água — devido às suas propriedades multifuncionais, como adstringência, atividade antioxidante, efeitos antimicrobianos e respeito ao meio ambiente.
- A crescente demanda por bioestimulantes é impulsionada principalmente pela mudança na América do Norte em direção a produtos naturais, sustentáveis e de base biológica, pela crescente conscientização ambiental e pela pressão regulatória cada vez maior para reduzir o uso de aditivos e produtos químicos sintéticos em bens industriais e de consumo.
- Os EUA são a força dominante no mercado de bioestimulantes da América do Norte, representando 77,59% da participação da região em 2025, e projeta-se que cresçam a uma forte taxa composta de crescimento anual (CAGR) de 12,1% de 2026 a 2033. Esse crescimento é impulsionado pelas altas taxas de adoção de ferramentas de agricultura de precisão e agricultura digital, pela expansão contínua da área de cultivo orgânico e regenerativo e pela forte presença de fabricantes e instituições de pesquisa líderes em bioestimulantes. Além disso, a crescente demanda por safras de alta qualidade — particularmente em frutas, vegetais, milho, soja e culturas especiais — continua a impulsionar a absorção do mercado.
- Prevê-se que o segmento de bioestimulantes naturais domine o mercado com uma participação de 71,41% em 2026, devido à sua ampla aplicabilidade em produtos farmacêuticos, ração animal e purificação de água, juntamente com os crescentes esforços em P&D focados em suas propriedades medicinais, antioxidantes e funcionais.
Escopo do relatório e segmentação do mercado de bioestimulantes na América do Norte
|
Atributos |
Principais informações sobre o mercado de bioestimulantes na América do Norte |
|
Segmentos abrangidos |
|
|
Países abrangidos |
América do Norte
|
|
Principais participantes do mercado |
|
|
Oportunidades de mercado |
|
|
Conjuntos de informações de dados de valor agregado |
Além das informações sobre cenários de mercado, como valor de mercado, taxa de crescimento, segmentação, cobertura geográfica e principais participantes, os relatórios de mercado elaborados pela Data Bridge Market Research também incluem análise de importação e exportação, visão geral da capacidade de produção, análise de produção e consumo, análise de tendências de preços, cenário de mudanças climáticas, análise da cadeia de suprimentos, análise da cadeia de valor, visão geral de matérias-primas/insumos, critérios de seleção de fornecedores, análise PESTLE, análise de Porter e estrutura regulatória. |
Tendências do mercado de bioestimulantes na América do Norte
“ Integração de bioestimulantes microbianos e nanoestruturados para melhorar o desempenho das culturas ”
- Uma tendência proeminente e de rápido crescimento no mercado de bioestimulantes da América do Norte é a crescente integração de tecnologias microbianas e nanobioestimulantes para aumentar a produtividade das culturas, a eficiência no uso de nutrientes e a resiliência ao estresse abiótico. Essa tendência é impulsionada pelos rápidos avanços na biotecnologia agrícola e por um movimento na América do Norte em direção a soluções agrícolas sustentáveis, de alta eficiência e com baixo uso de insumos.
- Empresas líderes como UPL, Valagro e Novozymes estão investindo fortemente em consórcios microbianos e nanoformulações que oferecem benefícios específicos, como melhor fixação de nitrogênio, colonização radicular aprimorada, absorção mais rápida de nutrientes e maior tolerância ao estresse causado por seca, calor e salinidade. Essas inovações estão ajudando os agricultores a obterem maiores produtividades, reduzindo a dependência de fertilizantes sintéticos.
- Os bioestimulantes microbianos — particularmente as rizobactérias promotoras do crescimento vegetal (PGPR), os fungos micorrízicos e as soluções à base de Bacillus — estão ganhando destaque devido à sua capacidade de fortalecer a arquitetura radicular, melhorar a fertilidade do solo e estimular as vias naturais de defesa das plantas. As empresas também estão desenvolvendo cepas de próxima geração com maior sobrevivência e compatibilidade em diversas condições de solo e clima.
- Os nanobioestimulantes, incluindo nano-silício, nano-aminoácidos e oligoelementos nanoquelados, estão surgindo como alternativas de alta eficiência às formulações convencionais. Sua estrutura em nanoescala melhora a penetração, a mobilidade e a biodisponibilidade de nutrientes, resultando em uma resposta mais rápida da planta e em doses de aplicação reduzidas.
- Na agricultura de precisão, esses bioestimulantes avançados estão sendo combinados com ferramentas digitais, como mapeamento do microbioma do solo, sensoriamento remoto e monitoramento de culturas baseado em inteligência artificial, para permitir estratégias de aplicação personalizadas e otimizar o desempenho no campo.
- Essa mudança em direção a bioestimulantes microbianos e nanoestruturados de última geração está redefinindo os padrões da indústria, transformando o mercado de insumos orgânicos básicos para soluções biológicas de alto desempenho, projetadas cientificamente.
Dinâmica do mercado de bioestimulantes na América do Norte
Motorista
“A crescente frequência de estresses climáticos nas culturas, como secas, inundações e ondas de calor, está levando os agricultores a adotarem bioestimulantes para manter a produtividade e a qualidade das colheitas.”
- O aumento da frequência de eventos climáticos extremos, como secas, inundações e ondas de calor, tornou-se uma preocupação crítica para a agricultura na América do Norte, afetando diretamente a produtividade das colheitas e a segurança alimentar.
- Essas condições extremas perturbam o metabolismo das plantas, prejudicam a absorção de nutrientes e reduzem o potencial de rendimento geral. Como resultado, os agricultores estão recorrendo cada vez mais a bioestimulantes — substâncias naturais que melhoram os processos fisiológicos das plantas — para fortalecer a resiliência das culturas contra o estresse ambiental.
- A adoção de bioestimulantes está permitindo que os produtores mantenham a produtividade e a qualidade em cenários climáticos imprevisíveis, ao mesmo tempo que promove a saúde do solo e do ecossistema a longo prazo.
- Por exemplo, conforme apresentado em um artigo de pesquisa da MDPI em julho de 2025, a aplicação de extrato de algas marinhas em plantações de soja sob condições de déficit hídrico melhorou a eficiência fotossintética e o acúmulo de biomassa, indicando o papel dos bioestimulantes no aumento da resiliência à seca.
- Conforme declarado em um comunicado conjunto da BASF e da Elicit Plant em outubro de 2024, testes de campo em plantações de girassol demonstraram que bioestimulantes derivados de algas marinhas melhoraram a resistência à seca e mantiveram a produtividade em condições de disponibilidade hídrica limitada, reforçando a confiança em produtos biológicos para mitigação do estresse hídrico.
- A crescente ocorrência de eventos climáticos extremos continua a afetar a produtividade agrícola na América do Norte, obrigando os agricultores a buscar soluções sustentáveis que aumentem a resiliência das culturas. Os bioestimulantes surgiram como um componente vital na mitigação dos efeitos de secas, inundações e ondas de calor, melhorando a tolerância ao estresse e a capacidade de recuperação das plantas.
- Apoiadas pela crescente validação em campo e inovação de produtos, espera-se que sua adoção se acelere ainda mais, à medida que os produtores priorizam a estabilidade e a qualidade da produção diante da incerteza climática.
Oportunidade
“A expansão para mercados emergentes, com crescente modernização agrícola e conscientização sobre práticas sustentáveis, apresenta um potencial de crescimento significativo.”
- A expansão do uso de bioestimulantes em mercados emergentes apresenta oportunidades de crescimento substanciais, impulsionadas pela aceleração da modernização agrícola e pela crescente conscientização sobre práticas agrícolas sustentáveis. À medida que países da Ásia-Pacífico, América Latina e África adotam cada vez mais técnicas avançadas de manejo de culturas para aumentar a produtividade e a eficiência no uso de recursos, os bioestimulantes ganham destaque como uma solução ecologicamente correta para melhorar a saúde do solo e a resiliência das culturas. Iniciativas governamentais de apoio, investimentos crescentes em pesquisa e desenvolvimento agrícola e programas de educação para agricultores estão fomentando ainda mais a penetração no mercado, posicionando as economias emergentes como importantes polos de crescimento para a indústria global de bioestimulantes nos próximos anos.
- Por exemplo, em agosto de 2025, um artigo da GK Today relatou que a mudança da Índia em direção a uma agricultura sustentável e resiliente às mudanças climáticas, juntamente com a crescente conscientização sobre a saúde das plantações, estão impulsionando a adoção de bioestimulantes no país.
- Por exemplo, em julho de 2025, a Agrithority publicou que, na América Latina, o crescente reconhecimento de bioestimulantes e bioinsumos como alternativas sustentáveis em sistemas agrícolas tropicais está acelerando o investimento e a adoção no Brasil, na Argentina e no Peru.
- Embora o segmento de bioestimulantes ofereça uma mudança promissora em direção à agricultura sustentável, aumentando a resiliência das plantas, melhorando a saúde do solo e reduzindo a dependência de agroquímicos convencionais, seu caminho a seguir não está isento de desafios. Entre os principais problemas, destacam-se um cenário regulatório ainda em evolução para garantir a eficácia e a qualidade dos produtos, lacunas generalizadas na educação dos agricultores e na garantia da qualidade em campo, além da predominância de formulações não verificadas no mercado. Enquanto esses obstáculos não forem superados por meio de testes padronizados, maior transparência e serviços de extensão rural focados no agricultor, o pleno potencial dos bioestimulantes permanecerá limitado.
Restrição/Desafio
“ O alto custo dos produtos bioestimulantes em comparação com os fertilizantes convencionais limita a sua adoção entre os pequenos agricultores e aqueles com recursos limitados .”
- O custo relativamente alto dos produtos bioestimulantes em comparação com os fertilizantes químicos convencionais representa uma restrição significativa ao crescimento do mercado, particularmente entre os pequenos agricultores e aqueles com recursos limitados.
- Embora os bioestimulantes ofereçam benefícios a longo prazo em termos de saúde do solo, estabilidade da produção e sustentabilidade, seu custo inicial e a limitada competitividade de preços muitas vezes desencorajam a adoção em regiões agrícolas sensíveis a custos. Essa disparidade de preços, aliada à menor conscientização sobre os retornos econômicos a longo prazo, continua a dificultar o uso generalizado de bioestimulantes em comunidades agrícolas em desenvolvimento e de baixa renda.
- Por exemplo, conforme relatado pela KNN India em setembro de 2025, o setor de fertilizantes destacou que as novas regulamentações que tratam os bioestimulantes sob o controle formal de fertilizantes aumentaram os custos de conformidade e produção, ameaçando muitos pequenos fabricantes e, indiretamente, elevando os custos dos produtos finais para os agricultores.
- Em 2025, Khoulati et al., em “Aproveitando os Bioestimulantes para a Agricultura Sustentável”, apontaram que um dos principais desafios são as “restrições econômicas” — incluindo o alto custo do produto em relação aos insumos convencionais — que limitam a adoção em contextos com recursos limitados.
- O custo relativamente elevado dos produtos bioestimulantes em comparação com os fertilizantes convencionais continua sendo um grande obstáculo à sua adoção generalizada, principalmente entre os pequenos agricultores e aqueles com recursos limitados.
- Apesar dos seus comprovados benefícios para a saúde do solo, a resiliência das culturas e a sustentabilidade a longo prazo, os elevados custos iniciais, os subsídios governamentais limitados e a falta de formulações acessíveis tornam os bioestimulantes menos acessíveis aos produtores sensíveis ao preço. A menos que as barreiras de custo sejam superadas através de políticas de apoio, inovação tecnológica e produção localizada, o seu potencial para transformar a agricultura sustentável permanecerá subutilizado em muitas regiões em desenvolvimento.
Escopo do mercado de bioestimulantes na América do Norte
O mercado de bioestimulantes da América do Norte está segmentado em seis segmentos principais com base na origem, forma, ingredientes ativos, método de aplicação, cultura e usuário final.
- Por origem
Com base na origem, o mercado global de bioestimulantes na América do Norte é segmentado em bioestimulantes sintéticos e bioestimulantes naturais. A forma seca é subdividida em dispersível em água, grânulos secos e pó molhável, e o processamento terceirizado é subdividido em concentrado em suspensão, concentrado emulsionável e concentrado líquido solúvel. Os bioestimulantes naturais são ainda subdivididos com base na forma em secos e processados por terceiros. A forma seca é subdividida em dispersível em água, grânulos secos e pó molhável. Em 2026, espera-se que o segmento de bioestimulantes naturais domine o mercado, com uma participação de 71,94%.
O segmento de bioestimulantes naturais também deverá registrar a maior taxa de crescimento anual composta (CAGR) de 12,6%, devido à sua crescente adoção entre os agricultores que buscam soluções de manejo de culturas sustentáveis e ecologicamente corretas. Os bioestimulantes naturais, derivados de fontes orgânicas como extratos de algas marinhas, hidrolisados de proteínas e microrganismos benéficos, melhoram o crescimento das plantas, a absorção de nutrientes e a tolerância ao estresse sem o impacto ambiental associado aos produtos químicos sintéticos.
- Por formulário
Com base na forma, o mercado global de bioestimulantes na América do Norte é segmentado em líquido e seco. A forma seca é ainda subdividida em dispersível em água, grânulos secos e pó molhável. A forma líquida é ainda subdividida em concentrado de suspensão, concentrado emulsionável e concentrado líquido solúvel. Em 2026, espera-se que o segmento líquido domine o mercado com uma participação de 65,45%.
Espera-se que o segmento líquido registre a maior taxa de crescimento anual composta (CAGR) de 12,5%, devido à sua facilidade de aplicação, rápida absorção e compatibilidade com os modernos sistemas de irrigação e pulverização. Os bioestimulantes líquidos permitem a distribuição uniforme dos ingredientes ativos, garantindo a absorção eficiente de nutrientes e o crescimento aprimorado das plantas, principalmente em operações agrícolas de grande escala.
- Por ingredientes ativos
Com base nos ingredientes ativos, o mercado global de bioestimulantes na América do Norte é segmentado em vitaminas do complexo B, quitosana, quitina, aditivos microbianos, hidrolisados proteicos, produtos à base de extratos, produtos à base de ácidos e outros. Na categoria de produtos à base de extratos, o mercado é subdividido em extratos fúngicos, extratos vegetais e extratos de algas marinhas. Já na categoria de produtos à base de ácidos, o mercado é subdividido em ácidos húmicos, ácidos fúlvicos e aminoácidos. Em 2026, prevê-se que o segmento de produtos à base de ácidos domine o mercado, com uma participação de 53,32%.
O segmento de bioestimulantes à base de ácidos também deverá registrar a maior taxa de crescimento anual composta (CAGR) de 12,7%, devido à rápida adoção de aminoácidos, ácidos húmicos e ácidos fúlvicos para aumentar a produtividade das culturas e a tolerância ao estresse. Esses bioestimulantes à base de ácidos melhoram a absorção de nutrientes, estimulam o desenvolvimento radicular e aumentam a resiliência das plantas contra estresses abióticos, como seca, salinidade e temperaturas extremas. Sua eficácia em uma ampla gama de culturas, aliada à crescente conscientização dos agricultores sobre práticas agrícolas sustentáveis e ecologicamente corretas, impulsiona sua popularidade crescente.
- Por meio de solicitação
Com base no método de aplicação, o mercado global de bioestimulantes na América do Norte é segmentado em tratamento de sementes, tratamento do solo e tratamento foliar. Em 2026, prevê-se que o segmento de tratamento foliar domine o mercado com uma participação de 74,39%.
O segmento de tratamento foliar também deverá registrar a maior taxa de crescimento anual composta (CAGR) de 12,4%, devido ao seu método direto e eficiente de fornecer nutrientes e compostos ativos às culturas. As aplicações foliares permitem a rápida absorção pelas folhas, resultando em respostas mais rápidas no crescimento, tolerância ao estresse e melhoria da produtividade em comparação com as aplicações no solo. A crescente adoção de técnicas de agricultura de precisão, as crescentes exigências de eficiência da mão de obra e a versatilidade dos tratamentos foliares em uma ampla gama de culturas impulsionam ainda mais o crescimento do mercado.
- Por colheita
Com base no tipo de cultura, o mercado global de bioestimulantes na América do Norte é segmentado em plantas ornamentais para gramados, oleaginosas e leguminosas, cereais e grãos, frutas e hortaliças, e outros. O segmento de oleaginosas e leguminosas é subdividido em soja, girassol, canola, amendoim, gergelim e outros. Já o segmento de cereais e grãos é subdividido em trigo, arroz, milho, cevada, aveia, sorgo e outros. Em 2026, prevê-se que o segmento de frutas e hortaliças domine o mercado, com uma participação de 58,87%.
O segmento de frutas e hortaliças também deverá registrar a maior taxa de crescimento anual composta (CAGR) de 12,6%, devido à crescente demanda por produtos de alta qualidade, ricos em nutrientes e visualmente atraentes. Os bioestimulantes aumentam a produtividade das culturas, melhoram o tamanho, a cor, o sabor e a vida útil das frutas, além de aumentarem a resistência a estresses abióticos como seca, calor e salinidade, tornando-os altamente valorizados no cultivo de frutas e hortaliças. A crescente preferência do consumidor por produtos frescos e orgânicos, aliada a regulamentações mais rigorosas sobre fertilizantes e pesticidas químicos, está impulsionando os agricultores a adotarem bioestimulantes.
- Por usuário final
Com base no usuário final, o mercado global de bioestimulantes na América do Norte é segmentado em institutos de pesquisa e agricultores. Em 2026, prevê-se que o segmento de agricultores domine o mercado, com uma participação de 85,34%.
Espera-se que o segmento de agricultores registre a maior taxa de crescimento anual composta (CAGR) de 12,6%, devido ao crescente reconhecimento dos bioestimulantes como ferramentas essenciais para uma agricultura sustentável e de alto rendimento. Os agricultores estão adotando cada vez mais esses produtos para melhorar o crescimento das culturas, aumentar a eficiência nutricional e fortalecer a resistência a estresses ambientais, como seca, salinidade e temperaturas extremas. A crescente demanda por produtos orgânicos e de alta qualidade, aliada a regulamentações mais rigorosas sobre fertilizantes sintéticos e insumos químicos, está incentivando os agricultores a integrar bioestimulantes em suas práticas de manejo de culturas.
Análise Regional do Mercado de Bioestimulantes na América do Norte
O mercado de bioestimulantes na América do Norte está experimentando um crescimento constante e robusto, impulsionado pela crescente adoção de insumos agrícolas sustentáveis, tecnologias de agricultura de precisão e pela tendência crescente em direção à produção de alimentos orgânicos e sem resíduos. A região continua investindo fortemente em soluções biológicas para o aprimoramento de culturas, visando melhorar a eficiência nutricional, a tolerância ao estresse e a produtividade geral das plantas.
Análise do Mercado de Bioestimulantes nos EUA e na América do Norte
Os EUA são a força dominante no mercado de bioestimulantes da América do Norte. Prevê-se que o mercado de bioestimulantes da América do Norte cresça a uma taxa composta de crescimento anual (CAGR) robusta de 12,1% entre 2026 e 2033. Esse crescimento é impulsionado pelas altas taxas de adoção de ferramentas de agricultura de precisão e agricultura digital, pela expansão contínua da área cultivada com agricultura orgânica e regenerativa e pela forte presença de fabricantes e instituições de pesquisa líderes no setor de bioestimulantes. Além disso, a crescente demanda por safras de alta qualidade — particularmente de frutas, vegetais, milho, soja e culturas especiais — continua a impulsionar a participação do mercado.
Análise do Mercado de Bioestimulantes no Canadá
O mercado de bioestimulantes na América do Norte, incluindo o Canadá, deverá crescer a uma taxa composta de crescimento anual (CAGR) de 11,4% entre 2026 e 2033. Essa expansão é impulsionada pelo rápido crescimento da agricultura orgânica e com baixo uso de insumos químicos, pela crescente demanda do consumidor por alimentos com rótulos limpos e de base biológica e pelo forte apoio governamental a práticas agrícolas ambientalmente responsáveis. A adoção de bioestimulantes está aumentando em categorias importantes de culturas — incluindo cereais, oleaginosas, gramados e hortaliças — acelerando ainda mais a entrada no mercado. Além disso, o crescente investimento do Canadá em programas de melhoria da saúde do solo está reforçando a mudança para soluções biológicas de aprimoramento de culturas, sustentando o crescimento do mercado a longo prazo.
Participação de mercado de bioestimulantes na América do Norte
O mercado de bioestimulantes na América do Norte é liderado principalmente por empresas consolidadas, incluindo:
- Ajinomoto Co., Inc. (Japão)
- Syngenta Biologicals (Suíça)
- Coromandel International Ltda. (Índia)
- BASF (Alemanha)
- Bayer AG (Alemanha)
- UPL (Índia)
- Biostadt India Limited (Índia)
- Novozymes (Dinamarca)
- Agricen (EUA)
- Corporação FMC (EUA)
- T. Stanes & Company Limited (TSTANES) (Índia)
- REKA (Koppert) (Países Baixos)
- Atlántica Agrícola (Espanha)
- Haifa Negev Technologies Ltda. (Israel)
- ILSA SpA (Itália)
- AG Biotech, Inc. (EUA)
Últimos desenvolvimentos no mercado de bioestimulantes na América do Norte
- Em fevereiro de 2023, a ILSA lançou novos bioestimulantes à base de fontes vegetais renováveis: soja e algas. O produto à base de soja contém aminoácidos, betaínas e triacontanol, enquanto o bioestimulante à base de algas é extraído por meio de métodos sustentáveis e não invasivos. Ambos os produtos melhoram o crescimento das plantas, a tolerância ao estresse e a qualidade dos frutos.
- Em fevereiro de 2025, a Horticoop investiu no REKA Group BV, uma empresa derivada da Koppert especializada em melhoramento regenerativo do solo. O investimento apoia a missão da REKA de desenvolver e distribuir bioestimulantes, nutrientes e inoculantes que aprimoram a saúde do solo, a eficiência nutricional e a resiliência das plantas. Essa parceria visa fortalecer a agricultura e a horticultura sustentáveis na América do Norte.
- Em outubro de 2024, a T.Stanes lançou e promoveu o Fytovita, um bioestimulante à base de vitaminas, destacando seu papel no aumento do crescimento das plantas, na mitigação do estresse abiótico e na melhoria da produtividade e da qualidade das colheitas.
- Em março de 2025, a Ajinomoto Co., Inc. anunciou sua participação como parceira no projeto “Estudo de Verificação da Recuperação de Pastagens Degradadas”, no Brasil, no âmbito da Iniciativa de Parceria Verde Japão-Brasil, fornecendo seus produtos bioestimulantes à base de aminoácidos (como AJIFOL® e AMINO Arginina) para aplicação em lavouras, visando verificar a restauração de pastagens degradadas.
- Em novembro de 2025, a BASF anunciou que "mantém seu compromisso com o financiamento a juros baixos para os produtores" na safra de 2026, oferecendo financiamento com taxa de juros de 0% na compra de produtos participantes de proteção de cultivos, tratamento de sementes e sementes, para apoiar os agricultores em seus investimentos em agricultura sustentável.
SKU-
Obtenha acesso online ao relatório sobre a primeira nuvem de inteligência de mercado do mundo

- Painel interativo de análise de dados
- Painel de análise da empresa para oportunidades de elevado potencial de crescimento
- Acesso de analista de pesquisa para personalização e customização. consultas
- Análise da concorrência com painel interativo
- Últimas notícias, atualizações e atualizações Análise de tendências
- Aproveite o poder da análise de benchmark para um rastreio abrangente da concorrência
Índice
1 INTRODUÇÃO
1.1 OBJETIVOS DO ESTUDO
1.2 DEFINIÇÃO DE MERCADO
1.3 VISÃO GERAL DO MERCADO DE BIOSESTIMULANTES NA AMÉRICA DO NORTE
1.4 MOEDA E PREÇOS
1.5 LIMITAÇÕES
1.6 MERCADOS ABRANGIDOS
2. SEGMENTAÇÃO DE MERCADO
2.1 MERCADOS ABRANGIDOS
2.2 ÂMBITO GEOGRÁFICO
2,3 ANOS CONSIDERADOS PARA O ESTUDO
2.4 Modelo de Validação de Dados Tripé DBMR
2.5 ENTREVISTAS PRIMÁRIAS COM PRINCIPAIS LÍDERES DE OPINIÃO
2.6 Matriz de Posicionamento de Mercado DBMR
2.7 ANÁLISE DA PARTICIPAÇÃO DE MERCADO DOS FORNECEDORES
2.8 MODELAGEM MULTIVARIADA
2.9 CURVA DA LINHA DO TEMPO DE ORIGEM
2.1 GRADE DE COBERTURA DO USUÁRIO FINAL DO MERCADO
2.11 FONTES SECUNDÁRIAS
2.12 PRESSUPOSTOS
3 RESUMO EXECUTIVO
4 INFORMAÇÕES PREMIUM
4.1 ANÁLISE DAS CINCO FORÇAS DE PORTER
4.1.1 AMEAÇA DE NOVOS CONCORRENTES
4.1.2 PODER DE NEGOCIAÇÃO DOS FORNECEDORES
4.1.3 PODER DE NEGOCIAÇÃO DOS COMPRADORES
4.1.4 AMEAÇA DE PRODUTOS SUBSTITUTOS
4.1.5 RIVALIDADE NA INDÚSTRIA
4.2 ANÁLISE DE PREÇOS
4.3 PERSPECTIVAS DA CAPACIDADE DE PRODUÇÃO DA EMPRESA
4.3.1 VISÃO GERAL
4.3.2 CONCLUSÃO
4.4 ANÁLISE DO ECOSSISTEMA INDUSTRIAL
4.4.1 VISÃO GERAL
4.4.2 EMPRESAS DE DESTAQUE
4.4.2.1 ESCALA E VANTAGENS ESTRATÉGICAS DA AMÉRICA DO NORTE
4.4.2.2 FUNÇÕES PRINCIPAIS E PAPÉIS NA CADEIA DE VALOR
4.4.3 PEQUENAS E MÉDIAS EMPRESAS
4.4.3.1 PMEs IMPULSIONADAS PELA INOVAÇÃO
4.4.3.2 MODELOS DE NEGÓCIO E PAPÉIS COMPETITIVOS
4.4.4 USUÁRIOS FINAIS
4.4.4.1 SEGMENTAÇÃO DE USUÁRIOS FINAIS
4.4.4.2 FATORES DE ADOÇÃO, BARREIRAS E CRIAÇÃO DE VALOR
4.4.4.3 TABELA DO USUÁRIO FINAL POR SEGMENTO DE CULTURA
4.4.5 CONCLUSÃO
4.5 ANÁLISE DE PATENTES – MERCADO DE BIOSESTIMULANTES NA AMÉRICA DO NORTE
4.5.1 QUALIDADE E RESISTÊNCIA DA PATENTE
4.5.2 FAMÍLIAS DE PATENTES
4.5.3 LICENCIAMENTO E COLABORAÇÕES
4.5.4 PANORAMA REGIONAL DE PATENTES
4.5.5 ESTRATÉGIA E GESTÃO DE PROPRIEDADE INTELECTUAL
4.6 FORNECIMENTO DE MATÉRIAS-PRIMAS
4.6.1 EXTRATOS DE ALGAS MARINHAS
4.6.2 SUBSTÂNCIAS HÚMICAS E FÚLVICAS
4.6.3 AMINOÁCIDOS E HIDROLISADOS DE PROTEÍNAS
4.6.4 CEPAS MICROBIANAS (BACTÉRIAS, FUNGOS E LEVEDURAS)
4.6.5 ÁCIDOS ORGÂNICOS E POLISSACARÍDEOS
4.6.6 NUTRIENTES INORGÂNICOS E AGENTES QUELANTES
4.6.7 VEÍCULOS E ADITIVOS DE FORMULAÇÃO
4.7 FATORES QUE AFETAM AS DECISÕES DE COMPRA NO MERCADO DE BIOSESTIMULANTES DA AMÉRICA DO NORTE
4.7.1 INTRODUÇÃO:
4.7.2 EFICÁCIA TÉCNICA COMPROVADA E DESEMPENHO DEMONSTRADO
4.7.3 ADEQUAÇÃO DA CULTURA, DO SOLO E DO MEIO AMBIENTE
4.7.4 VIABILIDADE ECONÔMICA E RETORNO SOBRE O INVESTIMENTO (ROI)
4.7.5 CONFIANÇA, TRANSPARÊNCIA E REPUTAÇÃO DA MARCA
4.7.6 CREDENCIAIS DE CONFORMIDADE REGULATÓRIA E SUSTENTABILIDADE
4.7.7 CONHECIMENTO, CONSCIÊNCIA E PERCEPÇÃO DE RISCO
4.7.8 CONCLUSÃO
4.8 ANÁLISE DE PRODUÇÃO E CONSUMO
4.8.1 CONJUNTO DE DADOS DE PRODUÇÃO
4.8.2 CONJUNTO DE DADOS DE CONSUMO
4.9 CENÁRIO DE IMPORTAÇÃO E EXPORTAÇÃO
4.9.1 IMPORTAR CONJUNTO DE DADOS
4.9.2 EXPORTAR CONJUNTO DE DADOS
4.1 RASTREADOR DE INOVAÇÃO E ANÁLISE ESTRATÉGICA
4.10.1 ANÁLISE DE GRANDES NEGÓCIOS E ALIANÇAS ESTRATÉGICAS
4.10.1.1 EMPREENDIMENTOS CONJUNTOS
4.10.1.2 FUSÕES E AQUISIÇÕES
4.10.1.3 CONTRATOS DE LICENCIAMENTO E PARCERIA
4.10.1.4 COLABORAÇÕES TECNOLÓGICAS
4.10.1.5 DESINVESTIMENTOS ESTRATÉGICOS / REESTRUTURAÇÃO DE PORTFÓLIO
4.10.2 NÚMERO DE PRODUTOS EM DESENVOLVIMENTO
4.10.3 ESTÁGIO DE DESENVOLVIMENTO
4.10.4 CRONOGRAMAS E MARCOS
4.10.5 ESTRATÉGIAS E METODOLOGIAS DE INOVAÇÃO
4.10.6 AVALIAÇÃO E MITIGAÇÃO DE RISCOS
4.11 CENÁRIO DE ADOÇÃO DE PRODUTOS NO MERCADO DE BIOSESTIMULANTES DA AMÉRICA DO NORTE
4.11.1 INTRODUÇÃO
4.11.2 ESTÁGIO ATUAL DE ADOÇÃO
4.11.3 PADRÕES DE ADOÇÃO REGIONAIS E ESPECÍFICOS PARA CADA CULTURA
4.11.4 FATORES MOTIVADORES DA ADOÇÃO
4.11.5 BARREIRAS À ADOÇÃO
4.11.6 CURVA DE ADOÇÃO E PERSPECTIVAS
4.11.7 PERSPECTIVA CENTRADA NO AGRICULTOR
4.11.8 IMPLICAÇÕES PARA AS PARTES INTERESSADAS
4.11.9 CONCLUSÃO
4.12 QUADRANTE DE AVALIAÇÃO DA EMPRESA
4.13 ANÁLISE DE CUSTOS DETALHADA
4.13.1 VISÃO GERAL
4.13.2 INVESTIMENTO DE CAPITAL E ESCALA DE PRODUÇÃO
4.13.2.1 ESCALA DE FÁBRICA, INFRAESTRUTURA E AUTOMAÇÃO
4.13.2.2 COMPLEXIDADE DE EQUIPAMENTOS E PROCESSOS
4.13.3 MATÉRIA-PRIMA, FORMULAÇÃO E CUSTOS OPERACIONAIS
4.13.3.1 FORNECIMENTO E VARIABILIDADE DE MATÉRIAS-PRIMAS
4.13.3.2 INTENSIDADE DE PROCESSAMENTO E COMPLEXIDADE DA FORMULAÇÃO
4.13.3.3 VARIABILIDADE E PRÊMIOS DE RISCO
4.13.4 CUSTOS REGULATÓRIOS, DE CONFORMIDADE E DE REGISTRO
4.13.4.1 CENÁRIO REGULATÓRIO E CUSTOS ASSOCIADOS
4.13.4.2 IMPLICAÇÕES PARA A BASE DE CUSTOS DE FABRICAÇÃO
4.13.5 CUSTOS DE LOGÍSTICA, DISTRIBUIÇÃO E APLICAÇÃO
4.13.5.1 EMBALAGEM, ARMAZENAMENTO E TRANSPORTE
4.13.5.2 ESTRUTURA DO CANAL E APLICAÇÃO DO USUÁRIO FINAL
4.13.6 CONSIDERAÇÕES DE CUSTO-BENEFÍCIO E IMPLICAÇÕES NA MARGEM
4.13.6.1 RETORNO DO INVESTIMENTO PARA OS PRODUTORES
4.13.6.2 MARGENS DO FABRICANTE E DO DISTRIBUIDOR
4.13.7 OPORTUNIDADES DE REDUÇÃO DE CUSTOS E TENDÊNCIAS DO SETOR
4.13.7.1 UTILIZAÇÃO DE MATÉRIAS-PRIMAS DE RESÍDUOS AGRÍCOLAS E ECONOMIA CIRCULAR
4.13.7.2 AUMENTO DE ESCALA, EFICIÊNCIA DO PROCESSO E PADRONIZAÇÃO
4.13.7.3 HARMONIZAÇÃO REGULATÓRIA E ACESSO AO MERCADO DA AMÉRICA DO NORTE
4.13.8 CONCLUSÃO
4.14 CENÁRIO DE MARGENS DE LUCRO
4.14.1 VISÃO GERAL
4.14.2 ESTRUTURA DE MARGEM DA CADEIA DE VALOR
4.14.2.1 MARGEM BRUTA DO FABRICANTE
4.14.2.2 MARGEM DO DISTRIBUIDOR/REVENDEDOR
4.14.2.3 CAPTURA DE VALOR E REALIZAÇÃO DE MARGENS PARA O AGRICULTOR
4.14.3 FATORES DE MARGEM E RESTRIÇÕES
4.14.3.1 NOVOS PRINCÍPIOS ATIVOS E PREÇOS PREMIUM
4.14.3.2 PRESSÕES BASEADAS EM CUSTOS
4.14.3.3 ESCALA E TAXA DE ADOÇÃO
4.14.3.4 PRESSÃO COMPETITIVA E SUBSTITUIÇÃO
4.14.3.5 RETORNO SOBRE O INVESTIMENTO DO AGRICULTOR E DISPOSIÇÃO A PAGAR
4.14.4 FAIXAS DE MARGEM DE LUCRO ESTIMADAS
4.14.5 ESTRATÉGIAS PARA MELHORIA DE MARGEM
4.14.5.1 PRECIFICAÇÃO BASEADA EM VALOR
4.14.5.2 OTIMIZAÇÃO DA BASE DE CUSTOS
4.14.5.3 FOCO NO SEGMENTO PREMIUM
4.14.5.4 EXPANSÃO DE ESCALA
4.14.5.5 ENVOLVIMENTO E DEMONSTRAÇÃO DOS AGRICULTORES
4.14.6 CONSIDERAÇÕES REGIONAIS E DE SEGMENTO DE CULTURA
4.14.7 CONCLUSÃO
4.15 IMPACTO DA DESACELERAÇÃO ECONÔMICA NO MERCADO
4.15.1 IMPACTO NO PREÇO
4.15.2 IMPACTO NA CADEIA DE SUPRIMENTOS
4.15.3 IMPACTO NO ENVIO
4.15.4 IMPACTO NAS DECISÕES ESTRATÉGICAS DA EMPRESA
4.15.5 IMPACTO NA DEMANDA
4.15.6 IMPACTO NAS DECISÕES ESTRATÉGICAS
4.16 ANÁLISE DA CADEIA DE SUPRIMENTOS
4.16.1 VISÃO GERAL
4.16.2 CENÁRIO DE CUSTOS LOGÍSTICOS
4.16.3 IMPORTÂNCIA DOS FORNECEDORES DE SERVIÇOS LOGÍSTICOS
5. TARIFAS E SEU IMPACTO NO MERCADO
5.1 TARIFA ATUAL
5.1.1 PERSPECTIVAS: PRODUÇÃO LOCAL VERSUS DEPENDÊNCIA DE IMPORTAÇÕES
5.2 DINÂMICA DOS CRITÉRIOS DE SELEÇÃO DE FORNECEDORES
5.3 IMPACTO NA CADEIA DE SUPRIMENTOS
5.3.1 AQUISIÇÃO DE MATÉRIA-PRIMA
5.3.2 FABRICAÇÃO E PRODUÇÃO
5.3.3 LOGÍSTICA E DISTRIBUIÇÃO
5.3.4 DEFINIÇÃO DE PREÇOS E POSICIONAMENTO DE MERCADO
5.4 PARTICIPANTES DA INDÚSTRIA: MEDIDAS PROATIVAS
5.4.1 Otimização da cadeia de suprimentos
5.4.2 ESTABELECIMENTO DE EMPREENDIMENTOS CONJUNTOS
5.5 IMPACTO NOS PREÇOS
5.6 INCLINAÇÃO REGULADORA
5.6.1 SITUAÇÃO GEOPOLÍTICA
5.6.2 PARCERIAS COMERCIAIS ENTRE OS PAÍSES
5.6.2.1 ACORDOS DE LIVRE COMÉRCIO
5.6.2.2 ESTABELECIMENTOS DE ALIANÇAS
5.6.3 ACREDITAÇÃO DE STATUS (INCLUINDO NMF)
5.6.4 PROCESSO CORRETIVO DOMÉSTICO
5.6.4.1 PLANOS DE INCENTIVO PARA AUMENTAR A PRODUÇÃO
5.6.4.2 CRIAÇÃO DE ZONAS ECONÔMICAS ESPECIAIS / PARQUES INDUSTRIAIS
6. COBERTURA REGULAMENTAR NO MERCADO DE BIOSESTIMULANTES DA AMÉRICA DO NORTE
6.1 VISÃO GERAL
6.2 DEFINIÇÕES E CLASSIFICAÇÃO REGULAMENTARES
6.3 REQUISITOS DE CONFORMIDADE E REGISTRO
6.4 DESTAQUES REGULATÓRIOS REGIONAIS
6.5 IMPLICAÇÕES PARA AS PARTES INTERESSADAS
6.6 DESAFIOS NA COBERTURA REGULATÓRIA
6.7 PERSPECTIVAS
7. VISÃO GERAL DO MERCADO
7.1 MOTORISTAS
7.1.1 A crescente frequência de estresses climáticos nas culturas, como secas, inundações e ondas de calor, está levando os agricultores a adotar bioestimulantes para manter a produtividade e a qualidade das colheitas.
7.1.2 A crescente demanda na América do Norte por alimentos orgânicos e produzidos de forma sustentável está incentivando o uso de bioestimulantes como uma alternativa natural aos fertilizantes químicos.
7.1.3 A diminuição da fertilidade do solo devido ao uso excessivo de fertilizantes sintéticos e práticas agrícolas intensivas está levando os agricultores a usar bioestimulantes para melhorar a absorção de nutrientes e a atividade microbiana do solo.
7.1.4 A crescente conscientização dos agricultores sobre a saúde do solo a longo prazo e a agricultura sustentável está aumentando a adoção de bioestimulantes para melhorar a resiliência e a produtividade das plantas.
7.2 RESTRIÇÕES
7.2.1 O ALTO CUSTO DOS PRODUTOS BIOESTIMULANTES EM COMPARAÇÃO COM OS FERTILIZANTES CONVENCIONAIS LIMITA A ADOÇÃO ENTRE OS PEQUENOS AGRICULTORES E OS AGRICULTORES COM RECURSOS LIMITADOS
7.2.2 O DESEMPENHO INCONSISTENTE EM DIFERENTES CULTURAS, SOLOS E CLIMAS CRIA INCERTEZA PARA OS AGRICULTORES, RETARDANANDO A ADOÇÃO GENERALIZADA.
7.3 OPORTUNIDADE
7.3.1 A expansão para mercados emergentes, com crescente modernização agrícola e conscientização sobre práticas sustentáveis, apresenta um significativo potencial de crescimento.
7.3.2 O desenvolvimento de bioestimulantes de próxima geração (microbianos, de algas marinhas ou à base de aminoácidos) adaptados a culturas específicas e condições de estresse oferece oportunidades para diferenciação de produtos.
7.3.3 A integração de bioestimulantes com técnicas de agricultura de precisão (como o manejo de nutrientes baseado em sensores e a aplicação direcionada) pode otimizar a eficiência e reduzir os custos de insumos.
7.4 DESAFIOS
7.4.1 A FALTA DE PADRÕES DE QUALIDADE E REGULAMENTAÇÕES PADRONIZADAS GLOBALMENTE DIFICULTA A GARANTIA DE EFICÁCIA CONSISTENTE DO PRODUTO, AFETANDO A CONFIANÇA DOS AGRICULTORES.
7.4.2 REDES DE DISTRIBUIÇÃO FRAGMENTADAS E DISPONIBILIDADE LIMITADA EM REGIÕES AGRÍCOLAS REMOTAS RESTRINGEM A PENETRAÇÃO NO MERCADO E O USO CONSISTENTE
8. MERCADO DE BIOSESTIMULANTES DA AMÉRICA DO NORTE, POR ORIGEM
8.1 VISÃO GERAL
8.2 BIOESTIMULANTES NATURAIS
8.2.1 LÍQUIDO
8.2.2 SECO
8.3 BIOSESTIMULANTES SINTÉTICOS
8.3.1 LÍQUIDO
8.3.2 SECO
9. MERCADO DE BIOSESTIMULANTES DA AMÉRICA DO NORTE, POR FORMA
9.1 VISÃO GERAL
9.2 LÍQUIDO
9.3 SECO
10 MERCADO DE BIOSESTIMULANTES DA AMÉRICA DO NORTE, POR INGREDIENTES ATIVOS
10.1 VISÃO GERAL
10.2 À BASE DE ÁCIDO
10.3 À BASE DE EXTRATO
10.4 HIDROLISADOS DE PROTEÍNA
10.5 ALTERAÇÕES MICROBIANAS
10.6 QUITINA
10.7 QUITOSANA
10.8 VITAMINAS DO COMPLEXO B
10.9 OUTROS
11 MERCADO DE BIOSESTIMULANTES DA AMÉRICA DO NORTE, POR CULTURA
11.1 VISÃO GERAL
11.2 FRUTAS E VEGETAIS
11.3 CEREAIS E GRÃOS
11.4 OLEAGINOSAS E LEGUMINOSAS
11.5 GRAMADOS E ORNAMENTAIS
11.6 OUTRAS CULTURAS
12. MERCADO DE BIOESTIMULANTES NA AMÉRICA DO NORTE, POR MÉTODO DE APLICAÇÃO
12.1 VISÃO GERAL
12.2 TRATAMENTO FOLIAR
12.3 TRATAMENTO DO SOLO
12.4 TRATAMENTO DE SEMENTES
13. MERCADO DE BIOSESTIMULANTES NA AMÉRICA DO NORTE, POR USUÁRIO FINAL
13.1 VISÃO GERAL
13.2 AGRICULTORES
13.3 INSTITUTOS DE PESQUISA
14 MERCADO DE BIOSESTIMULANTES DA AMÉRICA DO NORTE, POR REGIÃO
14.1 AMÉRICA DO NORTE
14.1.1 EUA
14.1.2 CANADÁ
14.1.3 MÉXICO
15 MERCADO DE BIOSESTIMULANTES DA AMÉRICA DO NORTE: PANORAMA DAS EMPRESAS
15.1 ANÁLISE DAS PARTICIPAÇÕES DE MERCADO DAS EMPRESAS FABRICANTES: GLOBAL
16 ANÁLISE SWOT
17 PERFIL DA EMPRESA
17.1 NOVOZYMES A/S
17.1.1 PERFIL DA EMPRESA
17.1.2 ANÁLISE DE RECEITAS
17.1.3 ANÁLISE DAS AÇÕES DA EMPRESA
17.1.4 PORTFÓLIO DE PRODUTOS
17.1.5 DESENVOLVIMENTOS RECENTES
17.2 AJINOMOTO CO., INC.
17.2.1 PERFIL DA EMPRESA
17.2.2 ANÁLISE DE RECEITAS
17.2.3 ANÁLISE DAS AÇÕES DA EMPRESA
17.2.4 PORTFÓLIO DE PRODUTOS
17.2.5 DESENVOLVIMENTOS RECENTES
17.3 UPL
17.3.1 PERFIL DA EMPRESA
17.3.2 ANÁLISE DE RECEITAS
17.3.3 ANÁLISE DAS AÇÕES DA EMPRESA
17.3.4 PORTFÓLIO DE PRODUTOS
17.3.5 DESENVOLVIMENTOS RECENTES
17.4 SYNGENTA
17.4.1 PERFIL DA EMPRESA
17.4.2 ANÁLISE DAS AÇÕES DA EMPRESA
17.4.3 PORTFÓLIO DE PRODUTOS
17.4.4 DESENVOLVIMENTOS RECENTES
17,5 BASF
17.5.1 PERFIL DA EMPRESA
17.5.2 ANÁLISE DE RECEITAS
17.5.3 ANÁLISE DAS AÇÕES DA EMPRESA
17.5.4 PORTFÓLIO DE PRODUTOS
17.5.5 DESENVOLVIMENTOS RECENTES
17.6 AG BIOTECH, INC.
17.6.1 PERFIL DA EMPRESA
17.6.2 PORTFÓLIO DE PRODUTOS
17.6.3 DESENVOLVIMENTOS RECENTES
17.7 AGRISEN
17.7.1 PERFIL DA EMPRESA
17.7.2 PORTFÓLIO DE PRODUTOS
17.7.3 DESENVOLVIMENTOS RECENTES
17.8 ATLÁNTICA AGRÍCOLA
17.8.1 PERFIL DA EMPRESA
17.8.2 PORTFÓLIO DE PRODUTOS
17.8.3 DESENVOLVIMENTOS RECENTES
17.9 BAYER AG
17.9.1 PERFIL DA EMPRESA
17.9.2 ANÁLISE DE RECEITAS
17.9.3 PORTFÓLIO DE PRODUTOS
17.9.4 DESENVOLVIMENTOS RECENTES
17.1 BIOSTADT.
17.10.1 PERFIL DA EMPRESA
17.10.2 PORTFÓLIO DE PRODUTOS
17.10.3 DESENVOLVIMENTOS RECENTES
17.11 COROMANDEL INTERNATIONAL LTDA.
17.11.1 PERFIL DA EMPRESA
17.11.2 ANÁLISE DE RECEITAS
17.11.3 PORTFÓLIO DE PRODUTOS
17.11.4 DESENVOLVIMENTOS RECENTES
17.12 FMC CORPORATION
17.12.1 PERFIL DA EMPRESA
17.12.2 ANÁLISE DE RECEITAS
17.12.3 PORTFÓLIO DE PRODUTOS
17.12.4 DESENVOLVIMENTOS RECENTES
17.13 HAIFA NEGEV TECHNOLOGIES LTDA.
17.13.1 PERFIL DA EMPRESA
17.13.2 PORTFÓLIO DE PRODUTOS
17.13.3 DESENVOLVIMENTOS RECENTES
17.14 ILSA SPA
17.14.1 PERFIL DA EMPRESA
17.14.2 PORTFÓLIO DE PRODUTOS
17.14.3 DESENVOLVIMENTOS RECENTES
17.15 REKA
17.15.1 PERFIL DA EMPRESA
17.15.2 PORTFÓLIO DE PRODUTOS
17.15.3 DESENVOLVIMENTOS RECENTES
17.16 TSTANES.
17.16.1 PERFIL DA EMPRESA
17.16.2 ANÁLISE DE RECEITAS
17.16.3 PORTFÓLIO DE PRODUTOS
17.16.4 DESENVOLVIMENTOS RECENTES
18 QUESTIONÁRIO
Lista de Tabela
TABELA 1 CAPACIDADE DE PRODUÇÃO DA EMPRESA
TABELA 2 MERCADO DE BIOSESTIMULANTES DA AMÉRICA DO NORTE, POR ORIGEM, 2018-2033 (EM MILHARES DE DÓLARES AMERICANOS)
TABELA 3 MERCADO DE BIOSESTIMULANTES DA AMÉRICA DO NORTE, POR ORIGEM, 2018-2033 (TONELADAS)
TABELA 4 BIOESTIMULANTES NATURAIS NA AMÉRICA DO NORTE NO MERCADO DE BIOESTIMULANTES, POR REGIÃO, 2018-2033 (EM MILHARES DE DÓLARES AMERICANOS)
TABELA 5 BIOESTIMULANTES NATURAIS DA AMÉRICA DO NORTE NO MERCADO DE BIOESTIMULANTES, POR FORMA, 2018-2033 (EM MILHARES DE DÓLARES AMERICANOS)
TABELA 6 MERCADO DE BIOESTIMULANTES LÍQUIDOS NA AMÉRICA DO NORTE, POR TIPO, 2018-2033 (EM MILHARES DE DÓLARES AMERICANOS)
TABELA 7 MERCADO DE BIOESTIMULANTES NA AMÉRICA DO NORTE, POR TIPO, 2018-2033 (EM MILHARES DE DÓLARES AMERICANOS)
TABELA 8. MERCADO DE BIOESTIMULANTES SINTÉTICOS NA AMÉRICA DO NORTE, POR REGIÃO, 2018-2033 (EM MILHARES DE DÓLARES AMERICANOS)
TABELA 9 BIOESTIMULANTES SINTÉTICOS NO MERCADO DE BIOESTIMULANTES DA AMÉRICA DO NORTE, POR FORMA, 2018-2033 (EM MILHARES DE DÓLARES AMERICANOS)
TABELA 10 MERCADO DE BIOESTIMULANTES LÍQUIDOS NA AMÉRICA DO NORTE, POR TIPO, 2018-2033 (EM MILHARES DE USD)
TABELA 11 MERCADO DE BIOESTIMULANTES NA AMÉRICA DO NORTE, POR TIPO, 2018-2033 (EM MILHARES DE DÓLARES AMERICANOS)
TABELA 12 MERCADO DE BIOSESTIMULANTES DA AMÉRICA DO NORTE, POR FORMA, 2018-2033 (EM MILHARES DE DÓLARES AMERICANOS)
TABELA 13 MERCADO DE BIOESTIMULANTES LÍQUIDOS NA AMÉRICA DO NORTE, POR REGIÃO, 2018-2033 (EM MILHARES DE DÓLARES AMERICANOS)
TABELA 14 MERCADO DE BIOESTIMULANTES LÍQUIDOS NA AMÉRICA DO NORTE, POR TIPO, 2018-2033 (EM MILHARES DE DÓLARES AMERICANOS)
TABELA 15 MERCADO DE BIOESTIMULANTES NA AMÉRICA DO NORTE, POR REGIÃO, 2018-2033 (EM MILHARES DE DÓLARES AMERICANOS)
TABELA 16 MERCADO DE BIOESTIMULANTES NA AMÉRICA DO NORTE, POR TIPO, 2018-2033 (EM MILHARES DE DÓLARES AMERICANOS)
TABELA 17 MERCADO DE BIOSESTIMULANTES DA AMÉRICA DO NORTE, POR ORIGEM, 2018-2033 (EM MILHARES DE DÓLARES AMERICANOS)
TABELA 18 MERCADO DE BIOESTIMULANTES À BASE DE ÁCIDO NA AMÉRICA DO NORTE, POR REGIÃO, 2018-2033 (EM MILHARES DE DÓLARES AMERICANOS)
TABELA 19 MERCADO DE BIOESTIMULANTES À BASE DE ÁCIDOS NA AMÉRICA DO NORTE, POR TIPO, 2018-2033 (EM MILHARES DE DÓLARES AMERICANOS)
TABELA 20 MERCADO DE BIOESTIMULANTES À BASE DE EXTRATOS NA AMÉRICA DO NORTE, POR REGIÃO, 2018-2033 (EM MILHARES DE DÓLARES AMERICANOS)
TABELA 21 MERCADO DE BIOESTIMULANTES À BASE DE EXTRATOS NA AMÉRICA DO NORTE, POR TIPO, 2018-2033 (EM MILHARES DE DÓLARES AMERICANOS)
TABELA 22 MERCADO DE HIDROLISADOS DE PROTEÍNA EM BIOESTIMULANTES NA AMÉRICA DO NORTE, POR REGIÃO, 2018-2033 (EM MILHARES DE DÓLARES AMERICANOS)
TABELA 23 ALTERAÇÕES MICROBIANAS NO MERCADO DE BIOESTIMULANTES DA AMÉRICA DO NORTE, POR REGIÃO, 2018-2033 (EM MILHARES DE DÓLARES AMERICANOS)
TABELA 24 MERCADO DE QUITINA EM BIOESTIMULANTES NA AMÉRICA DO NORTE, POR REGIÃO, 2018-2033 (EM MILHARES DE DÓLARES AMERICANOS)
TABELA 25 MERCADO DE QUITOSANA EM BIOESTIMULANTES NA AMÉRICA DO NORTE, POR REGIÃO, 2018-2033 (EM MILHARES DE DÓLARES AMERICANOS)
TABELA 26 MERCADO DE VITAMINAS DO COMPLEXO B EM BIOESTIMULANTES NA AMÉRICA DO NORTE, POR REGIÃO, 2018-2033 (EM MILHARES DE DÓLARES AMERICANOS)
TABELA 27 MERCADO DE BIOESTIMULANTES NA AMÉRICA DO NORTE, POR REGIÃO, 2018-2033 (EM MILHARES DE DÓLARES AMERICANOS)
TABELA 28 MERCADO DE BIOESTIMULANTES DA AMÉRICA DO NORTE, POR CULTURA, 2018-2033 (EM MILHARES DE DÓLARES AMERICANOS)
TABELA 29 FRUTAS E VEGETAIS DA AMÉRICA DO NORTE NO MERCADO DE BIOESTIMULANTES, POR REGIÃO, 2018-2033 (EM MILHARES DE DÓLARES AMERICANOS)
TABELA 30 FRUTAS E VEGETAIS DA AMÉRICA DO NORTE NO MERCADO DE BIOESTIMULANTES, POR FRUTAS, 2018-2033 (EM MILHARES DE DÓLARES AMERICANOS)
TABELA 31 FRUTAS E VEGETAIS DA AMÉRICA DO NORTE NO MERCADO DE BIOESTIMULANTES, POR VEGETAL, 2018-2033 (EM MILHARES DE USD)
TABELA 32 MERCADO DE CEREAIS E GRÃOS DA AMÉRICA DO NORTE EM BIOESTIMULANTES, POR REGIÃO, 2018-2033 (EM MILHARES DE USD)
TABELA 33 MERCADO DE CEREAIS E GRÃOS DA AMÉRICA DO NORTE EM BIOESTIMULANTES, POR TIPO, 2018-2033 (EM MILHARES DE USD)
TABELA 34 MERCADO DE OLEAGINOSAS E LEGUMINOSAS DA AMÉRICA DO NORTE EM BIOESTIMULANTES, POR REGIÃO, 2018-2033 (EM MILHARES DE DÓLARES AMERICANOS)
TABELA 35 MERCADO DE OLEAGINOSAS E LEGUMINOSAS DA AMÉRICA DO NORTE EM BIOESTIMULANTES, POR TIPO, 2018-2033 (EM MILHARES DE USD)
TABELA 36 MERCADO DE GRAMADOS E PLANTAS ORNAMENTAIS EM BIOESTIMULANTES NA AMÉRICA DO NORTE, POR REGIÃO, 2018-2033 (EM MILHARES DE DÓLARES AMERICANOS)
TABELA 37 OUTRAS CULTURAS DA AMÉRICA DO NORTE NO MERCADO DE BIOESTIMULANTES, POR REGIÃO, 2018-2033 (EM MILHARES DE USD)
TABELA 38 MERCADO DE BIOESTIMULANTES DA AMÉRICA DO NORTE, POR MÉTODO DE APLICAÇÃO, 2018-2033 (EM MILHARES DE USD)
TABELA 39 MERCADO DE TRATAMENTO FOLIAR EM BIOESTIMULANTES NA AMÉRICA DO NORTE, POR REGIÃO, 2018-2033 (EM MILHARES DE DÓLARES AMERICANOS)
TABELA 40 MERCADO DE TRATAMENTO DE SOLO COM BIOESTIMULANTES NA AMÉRICA DO NORTE, POR REGIÃO, 2018-2033 (EM MILHARES DE DÓLARES AMERICANOS)
TABELA 41 MERCADO DE TRATAMENTO DE SEMENTES COM BIOESTIMULANTES NA AMÉRICA DO NORTE, POR REGIÃO, 2018-2033 (EM MILHARES DE DÓLARES AMERICANOS)
TABELA 42 MERCADO DE BIOSESTIMULANTES DA AMÉRICA DO NORTE, POR USUÁRIO FINAL, 2018-2033 (EM MILHARES DE DÓLARES AMERICANOS)
TABELA 43 AGRICULTORES DA AMÉRICA DO NORTE NO MERCADO DE BIOESTIMULANTES, POR REGIÃO, 2018-2033 (EM MILHARES DE DÓLARES AMERICANOS)
TABELA 44 INSTITUTOS DE PESQUISA DA AMÉRICA DO NORTE NO MERCADO DE BIOESTIMULANTES, POR REGIÃO, 2018-2033 (EM MILHARES DE DÓLARES AMERICANOS)
TABELA 45 MERCADO DE BIOSESTIMULANTES DA AMÉRICA DO NORTE, POR PAÍS, 2018-2033 (EM MILHARES DE DÓLARES AMERICANOS)
TABELA 46 MERCADO DE BIOSESTIMULANTES DA AMÉRICA DO NORTE, POR PAÍS, 2018-2033 (EM MILHARES DE DÓLARES AMERICANOS)
TABELA 47 MERCADO DE BIOSESTIMULANTES DA AMÉRICA DO NORTE, POR PAÍS, 2018-2033 (TONELADAS)
TABELA 48 AMÉRICA DO NORTE
TABELA 49 MERCADO DE BIOSESTIMULANTES DA AMÉRICA DO NORTE, POR ORIGEM, 2018-2033 (EM MILHARES DE DÓLARES AMERICANOS)
TABELA 50 MERCADO DE BIOESTIMULANTES DA AMÉRICA DO NORTE, POR ORIGEM, 2018-2033 (TONELADAS)
TABELA 51 BIOESTIMULANTES NATURAIS DA AMÉRICA DO NORTE NO MERCADO DE BIOESTIMULANTES, POR FORMA, 2018-2033 (EM MILHARES DE USD)
TABELA 52 MERCADO DE BIOESTIMULANTES LÍQUIDOS NA AMÉRICA DO NORTE, POR TIPO, 2018-2033 (EM MILHARES DE USD)
TABELA 53 MERCADO DE BIOESTIMULANTES NA AMÉRICA DO NORTE, POR TIPO, 2018-2033 (EM MILHARES DE USD)
TABELA 54 BIOESTIMULANTES SINTÉTICOS NO MERCADO DE BIOESTIMULANTES DA AMÉRICA DO NORTE, POR FORMA, 2018-2033 (EM MILHARES DE DÓLARES AMERICANOS)
TABELA 55 MERCADO DE BIOESTIMULANTES LÍQUIDOS NA AMÉRICA DO NORTE, POR TIPO, 2018-2033 (EM MILHARES DE USD)
TABELA 56 MERCADO DE BIOESTIMULANTES NA AMÉRICA DO NORTE, POR TIPO, 2018-2033 (EM MILHARES DE USD)
TABELA 57 MERCADO DE BIOSESTIMULANTES DA AMÉRICA DO NORTE, POR FORMA, 2018-2033 (EM MILHARES DE DÓLARES AMERICANOS)
TABELA 58 MERCADO DE BIOESTIMULANTES LÍQUIDOS NA AMÉRICA DO NORTE, POR TIPO, 2018-2033 (EM MILHARES DE DÓLARES AMERICANOS)
TABELA 59 MERCADO DE BIOESTIMULANTES NA AMÉRICA DO NORTE, POR TIPO, 2018-2033 (EM MILHARES DE USD)
TABELA 60 MERCADO DE BIOESTIMULANTES DA AMÉRICA DO NORTE, POR INGREDIENTES ATIVOS, 2018-2033 (EM MILHARES DE DÓLARES AMERICANOS)
TABELA 61 MERCADO DE BIOESTIMULANTES À BASE DE ÁCIDOS NA AMÉRICA DO NORTE, POR TIPO, 2018-2033 (EM MILHARES DE DÓLARES AMERICANOS)
TABELA 62 MERCADO DE BIOESTIMULANTES À BASE DE EXTRATOS NA AMÉRICA DO NORTE, POR TIPO, 2018-2033 (EM MILHARES DE DÓLARES AMERICANOS)
TABELA 63 MERCADO DE BIOESTIMULANTES DA AMÉRICA DO NORTE, POR MÉTODO DE APLICAÇÃO, 2018-2032 (EM MILHARES DE USD)
TABELA 64 MERCADO DE BIOESTIMULANTES DA AMÉRICA DO NORTE, POR CULTURA, 2018-2033 (EM MILHARES DE DÓLARES AMERICANOS)
TABELA 65 FRUTAS E VEGETAIS DA AMÉRICA DO NORTE NO MERCADO DE BIOESTIMULANTES, POR FRUTAS, 2018-2033 (EM MILHARES DE USD)
TABELA 66 FRUTAS E VEGETAIS DA AMÉRICA DO NORTE NO MERCADO DE BIOESTIMULANTES, POR VEGETAL, 2018-2033 (EM MILHARES DE USD)
TABELA 67 MERCADO DE CEREAIS E GRÃOS DA AMÉRICA DO NORTE EM BIOESTIMULANTES, POR TIPO, 2018-2033 (EM MILHARES DE USD)
TABELA 68 MERCADO DE OLEAGINOSAS E LEGUMINOSAS DA AMÉRICA DO NORTE EM BIOESTIMULANTES, POR TIPO, 2018-2033 (EM MILHARES DE USD)
TABELA 69 MERCADO DE BIOESTIMULANTES DA AMÉRICA DO NORTE, POR USUÁRIO FINAL, 2018-2033 (EM MILHARES DE DÓLARES AMERICANOS)
TABELA 70 MERCADO DE BIOESTIMULANTES DOS EUA, POR ORIGEM, 2018-2033 (EM MILHARES DE DÓLARES AMERICANOS)
TABELA 71 MERCADO DE BIOESTIMULANTES DOS EUA, POR ORIGEM, 2018-2033 (TONELADAS)
TABELA 72 BIOESTIMULANTES NATURAIS DOS EUA NO MERCADO DE BIOESTIMULANTES, POR FORMA, 2018-2033 (EM MILHARES DE DÓLARES AMERICANOS)
TABELA 73 MERCADO DE BIOESTIMULANTES LÍQUIDOS DOS EUA, POR TIPO, 2018-2033 (EM MILHARES DE USD)
TABELA 74 MERCADO DE BIOESTIMULANTES SECOS DOS EUA, POR TIPO, 2018-2033 (EM MILHARES DE DÓLARES AMERICANOS)
TABELA 75 BIOESTIMULANTES SINTÉTICOS NO MERCADO DE BIOESTIMULANTES DOS EUA, POR FORMA, 2018-2033 (EM MILHARES DE DÓLARES AMERICANOS)
TABELA 76 MERCADO DE BIOESTIMULANTES LÍQUIDOS DOS EUA, POR TIPO, 2018-2033 (EM MILHARES DE USD)
TABELA 77 MERCADO DE BIOESTIMULANTES SECOS DOS EUA, POR TIPO, 2018-2033 (EM MILHARES DE USD)
TABELA 78 MERCADO DE BIOESTIMULANTES DOS EUA, POR FORMA, 2018-2033 (EM MILHARES DE DÓLARES AMERICANOS)
TABELA 79 MERCADO DE BIOESTIMULANTES LÍQUIDOS DOS EUA, POR TIPO, 2018-2033 (EM MILHARES DE USD)
TABELA 80 MERCADO DE BIOESTIMULANTES SECOS DOS EUA, POR TIPO, 2018-2033 (EM MILHARES DE DÓLARES AMERICANOS)
TABELA 81 MERCADO DE BIOESTIMULANTES DOS EUA, POR INGREDIENTES ATIVOS, 2018-2033 (EM MILHARES DE DÓLARES AMERICANOS)
TABELA 82 MERCADO DE BIOESTIMULANTES À BASE DE ÁCIDO NOS EUA, POR TIPO, 2018-2033 (EM MILHARES DE DÓLARES AMERICANOS)
TABELA 83 MERCADO DE BIOESTIMULANTES À BASE DE EXTRATOS DOS EUA, POR TIPO, 2018-2033 (EM MILHARES DE DÓLARES AMERICANOS)
TABELA 84 MERCADO DE BIOESTIMULANTES DOS EUA, POR MÉTODO DE APLICAÇÃO, 2018-2032 (EM MILHARES DE USD)
TABELA 85 MERCADO DE BIOESTIMULANTES DOS EUA, POR CULTURA, 2018-2033 (EM MILHARES DE DÓLARES AMERICANOS)
TABELA 86 FRUTAS E VEGETAIS DOS EUA NO MERCADO DE BIOESTIMULANTES, POR FRUTAS, 2018-2033 (EM MILHARES DE DÓLARES AMERICANOS)
TABELA 87 FRUTAS E VEGETAIS DOS EUA NO MERCADO DE BIOESTIMULANTES, POR VEGETAL, 2018-2033 (EM MILHARES DE DÓLARES AMERICANOS)
TABELA 88 MERCADO DE CEREAIS E GRÃOS DOS EUA EM BIOESTIMULANTES, POR TIPO, 2018-2033 (EM MILHARES DE USD)
TABELA 89 MERCADO DE OLEAGINOSAS E LEGUMINOSAS DOS EUA EM BIOESTIMULANTES, POR TIPO, 2018-2033 (EM MILHARES DE DÓLARES AMERICANOS)
TABELA 90 MERCADO DE BIOESTIMULANTES DOS EUA, POR USUÁRIO FINAL, 2018-2033 (EM MILHARES DE DÓLARES AMERICANOS)
TABELA 91 MERCADO DE BIOSESTIMULANTES DO CANADÁ, POR ORIGEM, 2018-2033 (EM MILHARES DE USD)
TABELA 92 MERCADO DE BIOSESTIMULANTES DO CANADÁ, POR ORIGEM, 2018-2033 (TONELADAS)
TABELA 93 MERCADO DE BIOESTIMULANTES NATURAIS NO CANADÁ, POR FORMA, 2018-2033 (EM MILHARES DE USD)
TABELA 94 MERCADO CANADENSE DE BIOESTIMULANTES LÍQUIDOS, POR TIPO, 2018-2033 (EM MILHARES DE USD)
TABELA 95 CANADA DRY NO MERCADO DE BIOESTIMULANTES, POR TIPO, 2018-2033 (EM MILHARES DE USD)
TABELA 96 BIOESTIMULANTES SINTÉTICOS NO MERCADO DE BIOESTIMULANTES DO CANADÁ, POR FORMA, 2018-2033 (EM MILHARES DE USD)
TABELA 97 MERCADO DE BIOESTIMULANTES LÍQUIDOS DO CANADÁ, POR TIPO, 2018-2033 (EM MILHARES DE USD)
TABELA 98 CANADA DRY NO MERCADO DE BIOESTIMULANTES, POR TIPO, 2018-2033 (EM MILHARES DE USD)
TABELA 99 MERCADO DE BIOSESTIMULANTES DO CANADÁ, POR FORMA, 2018-2033 (EM MILHARES DE USD)
TABELA 100 MERCADO CANADENSE DE BIOESTIMULANTES LÍQUIDOS, POR TIPO, 2018-2033 (EM MILHARES DE USD)
TABELA 101 CANADA DRY NO MERCADO DE BIOESTIMULANTES, POR TIPO, 2018-2033 (EM MILHARES DE USD)
TABELA 102 MERCADO DE BIOESTIMULANTES DO CANADÁ, POR INGREDIENTES ATIVOS, 2018-2033 (EM MILHARES DE USD)
TABELA 103 MERCADO CANADENSE DE BIOESTIMULANTES À BASE DE ÁCIDO, POR TIPO, 2018-2033 (EM MILHARES DE USD)
TABELA 104 MERCADO DE BIOESTIMULANTES À BASE DE EXTRATOS DO CANADÁ, POR TIPO, 2018-2033 (EM MILHARES DE USD)
TABELA 105 MERCADO DE BIOESTIMULANTES DO CANADÁ, POR MÉTODO DE APLICAÇÃO, 2018-2032 (EM MILHARES DE USD)
TABELA 106 MERCADO DE BIOESTIMULANTES DO CANADÁ, POR CULTURA, 2018-2033 (EM MILHARES DE USD)
TABELA 107 FRUTAS E VEGETAIS DO CANADÁ NO MERCADO DE BIOESTIMULANTES, POR FRUTAS, 2018-2033 (MILHARES DE USD)
TABELA 108 FRUTAS E VEGETAIS DO CANADÁ NO MERCADO DE BIOESTIMULANTES, POR VEGETAL, 2018-2033 (EM MILHARES DE USD)
TABELA 109 MERCADO DE CEREAIS E GRÃOS DO CANADÁ EM BIOESTIMULANTES, POR TIPO, 2018-2033 (EM MILHARES DE USD)
TABELA 110 MERCADO DE OLEAGINOSAS E LEGUMINOSAS DO CANADÁ EM BIOESTIMULANTES, POR TIPO, 2018-2033 (EM MILHARES DE USD)
TABELA 111 MERCADO DE BIOSESTIMULANTES DO CANADÁ, POR USUÁRIO FINAL, 2018-2033 (EM MILHARES DE USD)
TABELA 112 MERCADO DE BIOSESTIMULANTES DO MÉXICO, POR ORIGEM, 2018-2033 (EM MILHARES DE USD)
TABELA 113 MERCADO DE BIOSESTIMULANTES DO MÉXICO, POR ORIGEM, 2018-2033 (TONELADAS)
TABELA 114 MÉXICO BIOSTIMULANTES NATURAIS NO MERCADO DE BIOSTIMULANTES, POR FORMA, 2018-2033 (MILHARES DE USD)
TABELA 115 MERCADO MÉXICO DE BIOESTIMULANTES LÍQUIDOS, POR TIPO, 2018-2033 (EM MILHARES DE USD)
TABELA 116 MERCADO DE BIOESTIMULANTES NO MÉXICO, POR TIPO, 2018-2033 (EM MILHARES DE USD)
TABELA 117 MÉXICO: BIOESTIMULANTES SINTÉTICOS NO MERCADO DE BIOESTIMULANTES, POR FORMA, 2018-2033 (EM MILHARES DE USD)
TABELA 118 MERCADO MÉXICO DE BIOESTIMULANTES LÍQUIDOS, POR TIPO, 2018-2033 (EM MILHARES DE USD)
TABELA 119 MERCADO DE BIOESTIMULANTES NO MÉXICO, POR TIPO, 2018-2033 (EM MILHARES DE USD)
TABELA 120 MERCADO DE BIOSESTIMULANTES NO MÉXICO, POR FORMA, 2018-2033 (EM MILHARES DE USD)
TABELA 121 MERCADO MÉXICO DE BIOESTIMULANTES LÍQUIDOS, POR TIPO, 2018-2033 (EM MILHARES DE USD)
TABELA 122 MERCADO DE BIOESTIMULANTES NO MÉXICO, POR TIPO, 2018-2033 (EM MILHARES DE USD)
TABELA 123 MERCADO DE BIOSESTIMULANTES NO MÉXICO, POR INGREDIENTES ATIVOS, 2018-2033 (EM MILHARES DE USD)
TABELA 124 MERCADO DE BIOESTIMULANTES À BASE DE ÁCIDO MÉXICO, POR TIPO, 2018-2033 (EM MILHARES DE USD)
TABELA 125 MERCADO DE BIOESTIMULANTES À BASE DE EXTRATOS NO MÉXICO, POR TIPO, 2018-2033 (EM MILHARES DE USD)
TABELA 126 MERCADO DE BIOSESTIMULANTES NO MÉXICO, POR MÉTODO DE APLICAÇÃO, 2018-2032 (EM MILHARES DE USD)
TABELA 127 MERCADO DE BIOSESTIMULANTES NO MÉXICO, POR CULTURA, 2018-2033 (EM MILHARES DE USD)
TABELA 128 FRUTAS E VEGETAIS DO MÉXICO NO MERCADO DE BIOESTIMULANTES, POR FRUTAS, 2018-2033 (EM MILHARES DE USD)
TABELA 129 FRUTAS E VEGETAIS DO MÉXICO NO MERCADO DE BIOESTIMULANTES, POR VEGETAL, 2018-2033 (EM MILHARES DE USD)
TABELA 130 MERCADO DE CEREAIS E GRÃOS DO MÉXICO EM BIOESTIMULANTES, POR TIPO, 2018-2033 (EM MILHARES DE USD)
TABELA 131 MERCADO DE OLEAGINOSAS E LEGUMINOSAS NO MÉXICO COM BIOESTIMULANTES, POR TIPO, 2018-2033 (EM MILHARES DE USD)
TABELA 132 MERCADO DE BIOSESTIMULANTES NO MÉXICO, POR USUÁRIO FINAL, 2018-2033 (EM MILHARES DE USD)
Lista de Figura
FIGURA 1 MERCADO DE BIOSESTIMULANTES DA AMÉRICA DO NORTE: SEGMENTAÇÃO
FIGURA 2 MERCADO DE BIOSESTIMULANTES DA AMÉRICA DO NORTE: TRIANGULAÇÃO DE DADOS
FIGURA 3 MERCADO DE BIOSESTIMULANTES DA AMÉRICA DO NORTE: ANÁLISE DROC
FIGURA 4 MERCADO DE BIOSESTIMULANTES DA AMÉRICA DO NORTE: ANÁLISE DO MERCADO DA AMÉRICA DO NORTE VS. MERCADO REGIONAL
FIGURA 5 MERCADO DE BIOSESTIMULANTES DA AMÉRICA DO NORTE: ANÁLISE DE PESQUISA DE EMPRESAS
FIGURA 6 MERCADO DE BIOSESTIMULANTES DA AMÉRICA DO NORTE: DADOS DEMOGRÁFICOS DAS ENTREVISTAS
FIGURA 7 MERCADO DE BIOSESTIMULANTES DA AMÉRICA DO NORTE: MATRIZ DE POSIÇÃO DE MERCADO DA DBMR
FIGURA 8 MERCADO DE BIOSTIMULANTES DA AMÉRICA DO NORTE: ANÁLISE DA PARTICIPAÇÃO DE MERCADO DOS FORNECEDORES
FIGURA 9 MERCADO DE BIOSESTIMULANTES DA AMÉRICA DO NORTE: MODELAGEM MULTIVARIADA
FIGURA 10 MERCADO DE BIOSESTIMULANTES DA AMÉRICA DO NORTE: CURVA DE TEMPO DE TIPO
FIGURA 11 MERCADO DE BIOSESTIMULANTES DA AMÉRICA DO NORTE: GRADE DE COBERTURA DO USUÁRIO FINAL
FIGURA 12 MERCADO DE BIOSESTIMULANTES DA AMÉRICA DO NORTE: SEGMENTAÇÃO
FIGURA 13 DOIS SEGMENTOS COMPÕEM O MERCADO DE BIOESTIMULANTES DA AMÉRICA DO NORTE, POR ORIGEM (2025)
FIGURA 14 MERCADO DE BIOSESTIMULANTES DA AMÉRICA DO NORTE: RESUMO EXECUTIVO
FIGURA 15 DECISÕES ESTRATÉGICAS
FIGURA 16. O aumento da frequência de estresse climático nas culturas, como secas, inundações e ondas de calor, está levando os agricultores a adotar bioestimulantes para manter a produtividade e a qualidade das colheitas. Espera-se que isso impulsione o mercado de bioestimulantes na América do Norte durante o período de previsão de 2026 a 2033.
FIGURA 17. O SEGMENTO DE ORIGEM DEVERÁ REPRESENTAR A MAIOR PARTICIPAÇÃO DO MERCADO DE BIOESTIMULANTES DA AMÉRICA DO NORTE EM 2026 E 2033.
FIGURA 18 ANÁLISE DAS CINCO FORÇAS DE PORTER
FIGURA 19 ANÁLISE DE PREÇOS (2018-2033)
FIGURA 20 ANÁLISE DE PATENTES PELOS REQUERENTES
FIGURA 21 ANÁLISE DE PATENTES POR PAÍS
FIGURA 22 ANÁLISE DE PATENTES POR ANO
FIGURA 23 QUADRANTE DE AVALIAÇÃO DA EMPRESA
FIGURA 24: MOTORES, RESTRIÇÕES, OPORTUNIDADES E DESAFIOS DO MERCADO DE BIOSESTIMULANTES DA AMÉRICA DO NORTE
FIGURA 25 MERCADO DE BIOSESTIMULANTES DA AMÉRICA DO NORTE: POR ORIGEM, 2025
FIGURA 26 MERCADO DE BIOSESTIMULANTES DA AMÉRICA DO NORTE: POR FORMA, 2025
FIGURA 27 MERCADO DE BIOSESTIMULANTES DA AMÉRICA DO NORTE: POR INGREDIENTES ATIVOS, 2025
FIGURA 28 MERCADO DE BIOSESTIMULANTES DA AMÉRICA DO NORTE: POR CULTURA, 2025
FIGURA 29 MERCADO DE BIOSESTIMULANTES DA AMÉRICA DO NORTE: POR MÉTODO DE APLICAÇÃO, 2024
FIGURA 30 MERCADO DE BIOSESTIMULANTES DA AMÉRICA DO NORTE: POR USUÁRIO FINAL, 2025
FIGURA 31 MERCADO DE BIOSESTIMULANTES DA AMÉRICA DO NORTE, PANORAMA (2025)
FIGURA 32 MERCADO DE BIOSESTIMULANTES DA AMÉRICA DO NORTE: PARTICIPAÇÃO DAS EMPRESAS EM 2025 (%)
Metodologia de Investigação
A recolha de dados e a análise do ano base são feitas através de módulos de recolha de dados com amostras grandes. A etapa inclui a obtenção de informações de mercado ou dados relacionados através de diversas fontes e estratégias. Inclui examinar e planear antecipadamente todos os dados adquiridos no passado. Da mesma forma, envolve o exame de inconsistências de informação observadas em diferentes fontes de informação. Os dados de mercado são analisados e estimados utilizando modelos estatísticos e coerentes de mercado. Além disso, a análise da quota de mercado e a análise das principais tendências são os principais fatores de sucesso no relatório de mercado. Para saber mais, solicite uma chamada de analista ou abra a sua consulta.
A principal metodologia de investigação utilizada pela equipa de investigação do DBMR é a triangulação de dados que envolve a mineração de dados, a análise do impacto das variáveis de dados no mercado e a validação primária (especialista do setor). Os modelos de dados incluem grelha de posicionamento de fornecedores, análise da linha de tempo do mercado, visão geral e guia de mercado, grelha de posicionamento da empresa, análise de patentes, análise de preços, análise da quota de mercado da empresa, normas de medição, análise global versus regional e de participação dos fornecedores. Para saber mais sobre a metodologia de investigação, faça uma consulta para falar com os nossos especialistas do setor.
Personalização disponível
A Data Bridge Market Research é líder em investigação formativa avançada. Orgulhamo-nos de servir os nossos clientes novos e existentes com dados e análises que correspondem e atendem aos seus objetivos. O relatório pode ser personalizado para incluir análise de tendências de preços de marcas-alvo, compreensão do mercado para países adicionais (solicite a lista de países), dados de resultados de ensaios clínicos, revisão de literatura, mercado remodelado e análise de base de produtos . A análise de mercado dos concorrentes-alvo pode ser analisada desde análises baseadas em tecnologia até estratégias de carteira de mercado. Podemos adicionar quantos concorrentes necessitar de dados no formato e estilo de dados que procura. A nossa equipa de analistas também pode fornecer dados em tabelas dinâmicas de ficheiros Excel em bruto (livro de factos) ou pode ajudá-lo a criar apresentações a partir dos conjuntos de dados disponíveis no relatório.

