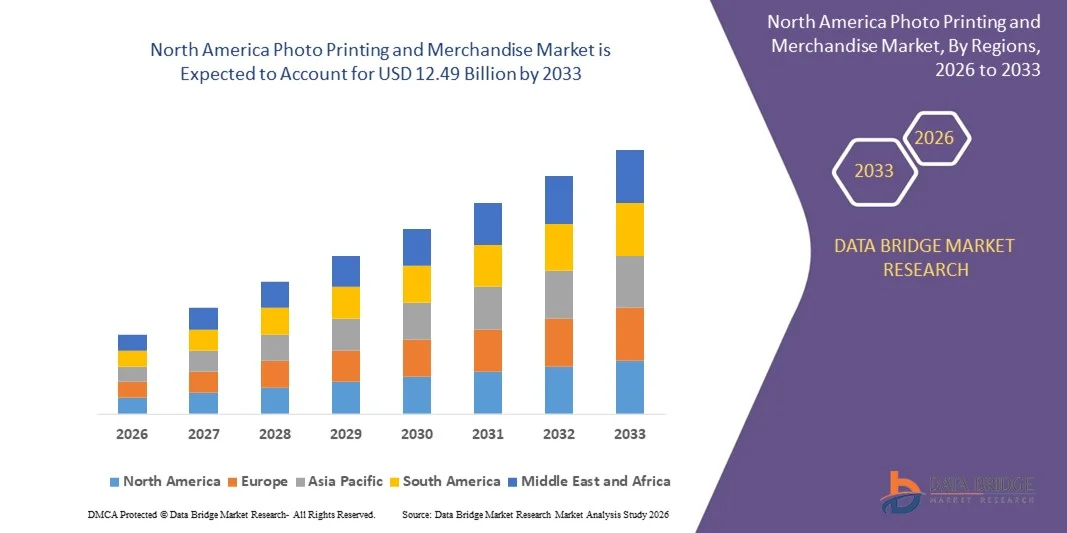
North America Photo Printing And Merchandise Market
Tamanho do mercado em biliões de dólares
CAGR :
% 
 USD
7.11 Billion
USD
12.49 Billion
2025
2033
USD
7.11 Billion
USD
12.49 Billion
2025
2033
| 2026 –2033 | |
| USD 7.11 Billion | |
| USD 12.49 Billion | |
| % | |
|
Segmentação do mercado de impressão fotográfica e produtos personalizados na América do Norte, por produto (calendários, cartões, canecas, álbuns de fotos, presentes fotográficos, impressões, camisetas, quadros e outros), modelo de impressão (impressão digital e impressão offset), dispositivo (desktop e celular), canal de distribuição (quiosques de atendimento rápido, lojas online, lojas físicas e outros) - Tendências e previsões do setor até 2033.
O que é a América do Norte Photo Printing e Merchandise Market Tamanho e taxa de crescimento
- Como por Data Bridge Market Research Análise da América do Norte foto impressão e tamanho de mercado de mercadorias foi avaliado em7,11 mil milhões de dólares em 2025e espera-se alcançar12,49 mil milhões de USD até 2033, em umaCAGR de 7,3%durante o período de previsão
- O uso crescente de dispositivos móveis para imagens de alta resolução e a crescente demanda por impressões e imagens 3D estão agindo como um fator importante para o crescimento do mercado. Além disso, o crescente desenvolvimento da tecnologia de captação de fotos está a impulsionar o crescimento do mercado
Tamanho e previsão do mercado
- Valor de mercado global (2025):7,11 mil milhões de USD
- Valor de mercado previsto (2033):12,49 mil milhões de USD
- Previsões CAGR (2026-2033):7.3%
Quais são os principais produtos de impressão fotográfica e mercado de mercadorias
- A integração da inteligência artificial com a tecnologia de impressão digital está criando uma nova janela de oportunidade para o mercado. No entanto, Calendários de papel sendo substituídos por planejadores digitais estão agindo como um grande desafio para o crescimento do mercado
- Os EUA dominaram o mercado global de impressão de fotos e mercadorias com uma participação estimada em 64,6% em 2025, impulsionada por fortes gastos com o consumidor em brindes personalizados, livros fotográficos premium e mercadoria personalizada
- O México está testemunhando uma taxa de crescimento mais rápida de 11,36%, devido ao aumento da penetração de smartphones, aumento da renda disponível de classe média e crescente conscientização sobre presentes personalizados
- O segmento Photo Books dominou o mercado com uma participação estimada em 34,6% em 2025, impulsionada pela forte demanda por lembranças premium, lembranças personalizadas usadas para memórias, casamentos, álbuns de viagem e portfólios de fotografia profissional
Segmentação de Mercados de Impressão e Mercado de Fotografias
|
Atributos |
Impressão de fotos e Mercado de Mercados |
|
Segmentos Cobertos |
|
|
Países abrangidos |
América do Norte
|
|
Jogadores do mercado chave |
|
|
Oportunidades de Mercado |
|
|
Informações sobre o Valor Adicionado |
Além dos insights sobre cenários de mercado, como valor de mercado, taxa de crescimento, segmentação, cobertura geográfica e principais atores, os relatórios de mercado curados pela Data Bridge Market Research também incluem análise de especialistas em profundidade, análise de preços, análise de compartilhamento de marca, inquérito ao consumidor, análise demografia, análise da cadeia de suprimentos, análise da cadeia de valor, visão geral da matéria-prima/consumíveis, critérios de seleção de fornecedores, Análise de PESTLE, Análise de Porter e marco regulatório. |
Qual é a tendência chave no mercado de impressão de fotos e merchandisse
Mudança ascendente em direção à impressão fotográfica personalizada, qualidade premium e na mídia
- O mercado de impressão de fotos e mercadorias está testemunhando forte adoção de produtos de alta resolução, personalizados e impressos digitalmente, incluindo livros de fotos, decoração de parede, calendários, vestuário e presentes personalizados
- Os fabricantes estão expandindo portfólios com mercadorias específicas para aplicações, como fotos duráveis, acabamentos de papel premium, envoltórios de tela e produtos funcionais de estilo de vida adaptados para doações e decoração
- A crescente demanda por personalização, valor emocional e contação visual de histórias está impulsionando a adoção entre consumidores individuais, fotógrafos profissionais e segmentos de doações corporativas
- Por exemplo, empresas como WhiteWall, Kodak Alaris, Cimpress, District Photo e Walmart estão investindo em tecnologias avançadas de impressão digital, automação e plataformas de customização em massa
- O foco crescente em tempos de volta rápida, serviços de impressão sob demanda e experiências de pedidos omnicanais está acelerando a demanda por produtos fotográficos premium
- Como os consumidores valorizam cada vez mais experiências personalizadas e produtos visuais de alta qualidade, a impressão de fotos e a comercialização permanecerão essenciais em casos de uso pessoal, profissional e comercial
Quais são os Principais Drivers de Impressão Fotográfica e Mercado de Mercados
- Aumento da demanda por presentes personalizados, decoração em casa e produtos de estilo de vida personalizados em mercados globais de consumo
- Por exemplo, durante 2024-2025, os principais jogadores como Cimpress, WhiteWall, Kodak Alaris e Hallmark expandiram as capacidades de impressão digital e introduziram novas ofertas personalizadas de produtos
- Crescimento rápido de plataformas de comércio eletrônico, uso de fotos móveis e criação de conteúdo em mídia social nos EUA, Europa e América do Norte está aumentando a demanda por serviços de impressão de fotos
- Avanços na impressão de jato de tinta, gerenciamento de cores, aprimoramento de imagem baseado em IA e realização automatizada melhoraram a qualidade, velocidade e eficiência de custo de impressão
- A adoção crescente de produtos fotográficos em marcas corporativas, campanhas promocionais e presentes baseados em eventos suporta ainda mais a expansão do mercado
- Suportado pelo aumento do rendimento disponível, adoção de fotografia digital e preferência do consumidor por produtos personalizados, o mercado de impressão fotográfica e merchandisse deve testemunhar crescimento constante a longo prazo
Que fator está desafiando o crescimento do mercado de impressão de fotos e merchandisse
- Altos custos operacionais associados com equipamentos de impressão premium, tintas especiais, substratos e logística podem impactar a rentabilidade
- Por exemplo, durante 2024-2025, flutuações nos preços do papel, custos de energia e interrupções da cadeia de suprimentos afetaram os prazos de produção para vários prestadores de serviços globais
- Competição intensa de plataformas de impressão online de baixo custo e lojas de impressão locais cria pressões de preços e restrições de margem
- Conscientização limitada do consumidor em certas regiões sobre qualidade de impressão premium, materiais de arquivo e durabilidade a longo prazo retarda a adoção baseada no valor
- Aumentar a mudança para o armazenamento e compartilhamento de fotos somente digital reduz volumes de impressão em alguns segmentos de consumo
- Para enfrentar esses desafios, as empresas estão focando em automação, materiais sustentáveis, serviços de valor agregado, modelos de entrega mais rápidos e experiências de usuário digital aprimoradas para fortalecer a adoção global de Impressão de Fotos e Mercadoria
Como é segmentada a impressão de fotos e mercado de mercadorias
O mercado é segmentado com base emproduto, tipo de impressão modelo, dispositivo e canal de distribuição.
- Por Produto
Com base no produto, o mercado de impressão de fotos e mercadorias é segmentado em calendários, cartões, canecas, livros de fotos, fotos presentes, impressões, t-shirts, artes de parede, e outros. O segmento Photo Books dominou o mercado com uma participação estimada em 34,6% em 2025, impulsionada pela forte demanda por lembranças premium, lembranças personalizadas usadas para memórias, casamentos, álbuns de viagem e portfólios de fotografia profissional. Alto valor emocional, opções de personalização e qualidade de impressão melhorada aumentaram a preferência do consumidor por livros de fotos em plataformas online e de varejo.
Espera-se que o segmento de presentes fotográficos cresça no CAGR mais rápido de 2026 para 2033, apoiado pela crescente demanda por soluções personalizadas de presentes durante festivais, eventos corporativos e ocasiões especiais. Aumentar a disponibilidade de canecas personalizadas, almofadas, quadros e acessórios de estilo de vida, combinado com rápida reviravolta e acessibilidade ao comércio eletrônico, está acelerando a adoção global.
- Por Tipo de Impressão Modelo
Com base no modelo de tipo de impressão, o mercado é segmentado em Impressão Digital e Impressão de Filme & Offset. O segmento de Impressão Digital dominou o mercado com 58,2% de participação em 2025, devido à sua flexibilidade, capacidade de curto prazo, tempos de giro mais rápidos e eficiência de custo para impressão personalizada e sob demanda. A impressão digital permite impressão de dados variáveis, saída de alta resolução e integração perfeita com plataformas de pedidos on-line, tornando-se a escolha preferida para a mercadoria personalizada.
O segmento Film & Offset Printing é projetado para crescer no CAGR mais rápido de 2026 para 2033, impulsionado pela demanda por produção de grande volume, qualidade de cor consistente e eficiência de custo em aplicações de impressão a granel. A impressão offset continua a ser amplamente utilizada para calendários, cartões de saudação e produtos fotográficos padronizados em configurações comerciais e institucionais.
- Por Dispositivo
Com base no dispositivo, o mercado de impressão de fotos e mercadorias é segmentado em plataformas Desktop e Mobile. O segmento móvel dominou o mercado com 61,4% de participação em 2025, apoiado pela adoção generalizada de smartphones, câmeras móveis de alta qualidade e aplicativos de impressão de fotos amigáveis. Os consumidores preferem cada vez mais dispositivos móveis para capturar, editar e encomendar produtos fotográficos devido à conveniência, acessibilidade e fluxos de trabalho baseados em aplicativos.
Espera-se que o segmento Desktop cresça no CAGR mais rápido de 2026 para 2033, impulsionado pelo uso contínuo entre fotógrafos profissionais, designers e usuários corporativos que necessitam de ferramentas avançadas de edição, telas maiores e manuseio de arquivos de alta resolução. O crescimento na impressão de fotos de nível profissional e aplicações empresariais também suporta a adoção de plataforma desktop.
- Por Canal de Distribuição
Com base no canal de distribuição, o mercado é segmentado em lojas online, lojas de varejo, quiosque instantâneo e outros. O segmento Online Stores dominou o mercado com 46,9% de participação em 2025, impulsionado por conveniência, amplas opções de personalização de produtos, preços competitivos e entrega de porta. As plataformas online permitem que os consumidores façam upload de imagens, personalizem projetos e façam pedidos com o mínimo de esforço, apoiando a adoção em alto nível em mercados globais.
O segmento de quiosque instantâneo é projetado para crescer no CAGR mais rápido de 2026 para 2033, apoiado pela demanda de serviços de impressão rápida de fotos no local em shoppings, aeroportos, locais turísticos e locais de eventos. Avanços em quiosques de autoatendimento e tecnologia de impressão instantânea estão acelerando ainda mais o crescimento do segmento.
Qual é a região que detém a maior parte do mercado de impressão de fotos e merchandise
- Os EUA dominaram o mercado global de impressão de fotos e mercadorias com uma participação estimada em 64,6% em 2025, impulsionada por fortes gastos com o consumidor em brindes personalizados, livros fotográficos premium e mercadoria personalizada
- Tecnologias de impressão avançadas, redes de distribuição eficientes e integração com canais de comércio eletrônico e varejo impulsionam o crescimento contínuo
- Aumento da demanda por doações corporativas, personalização orientada pelas mídias sociais e plataformas digitais de compartilhamento de fotos mais combustíveis adoção do mercado
Canada Photo Printing and Merchandise Market Insight
No Canadá, o mercado está crescendo constantemente, apoiado pelo crescente interesse na personalização de fotos, forte alfabetização digital e expansão da infraestrutura de comércio eletrônico. Os consumidores preferem cada vez mais impressões de alta qualidade, calendários e presentes de fotos temáticos. Os investimentos em soluções de impressão automatizadas e sistemas de realização eficientes aumentam a acessibilidade e conveniência, conduzindo a adoção a longo prazo.
México Photo Printing and Merchandise Market Insight
O México está testemunhando uma taxa de crescimento mais rápida de 11,36%, devido ao aumento da penetração de smartphones, aumento da renda disponível de classe média e crescente conscientização de presentes personalizados. Plataformas de pedidos on-line, serviços de impressão móvel e instalações de impressão locais de baixo custo suportam a expansão do mercado. A adoção de soluções de impressão digital para livros fotográficos, canecas e arte de parede está aumentando em regiões urbanas e semi-urbanas.
Quais são as principais empresas no mercado de impressão de fotos e merchandise
A indústria de impressão fotográfica e merchandise é liderada principalmente por empresas bem estabelecidas, incluindo:
- Walmart (EUA)
- Kodak Alaris Inc. (U.K.)
- Cimpress (Irlanda)
- LLC (EUA)
- WhiteWall (Alemanha)
- Foto do Distrito, Inc. (EUA)
- JONDO, Ltd. (Japão)
Quais são os Desenvolvimentos Recentes no Mercado Global de Impressão Fotográfica e Mercado de Mercados
- Em maio de 2025, Xiaomi, uma empresa chinesa líder em eletrônica de consumo, anunciou o lançamento global de sua impressora de fotos portátil 1S Xiaomi, com tecnologia de impressão de tinta zero (ZINK), uma resolução 313 x 512 dpi, e um tamanho compacto de impressão de 2 x 3 polegadas, reforçando sua presença no segmento portátil de impressão de fotos e acelerando a adoção pelo consumidor de soluções instantâneas de impressão de fotos
- Em novembro de 2024, Sticker Mule, um proeminente fornecedor de impressão personalizada, lançou Stores, uma solução de serviço completo que permite aos influenciadores, criadores e marcas vender mercadorias personalizadas diretamente através do site da empresa, enquanto Sticker Mule gerencia atendimento e atendimento ao cliente, aumentando as oportunidades de monetização e simplificando a distribuição de mercadorias
- Em outubro de 2024, FastEditor, um fornecedor líder em edição de software, introduziu o Editor de Logo, uma nova ferramenta hospedada em sites de parceiros de impressão que permite aos clientes projetar e visualizar logotipos em toda uma gama de produtos antes de imprimir, melhorando as capacidades de personalização e simplificando o processo de encomenda de impressão
- Em dezembro de 2022, American Greetings, em colaboração com Alicia Keys, lançou CreatacardTM personalizado feriado digital saudações projetadas pelo 15-tempo GRAMMY® Artista premiado, expandindo ofertas premium de personalização digital e elevando o engajamento do consumidor no segmento de saudações digitais
- Em abril de 2021, a Eastman Kodak Company adquiriu os ativos do negócio de dispositivos computador-placa (CTP) da ECRM Incorporated ao serviço das indústrias gráficas e de jornais, fortalecendo o portfólio de tecnologia de impressão da Kodak e reforçando sua posição em soluções profissionais de imagem
- Em 2021, Card Factory anunciou a abertura de uma nova loja no Flintshire Retail Park, no Norte de Gales, para expandir seu portfólio de produtos e fortalecer sua pegada de varejo, apoiando a visibilidade da marca e impulsionando o crescimento nos canais de vendas de varejo físicos
SKU-
Obtenha acesso online ao relatório sobre a primeira nuvem de inteligência de mercado do mundo

- Painel interativo de análise de dados
- Painel de análise da empresa para oportunidades de elevado potencial de crescimento
- Acesso de analista de pesquisa para personalização e customização. consultas
- Análise da concorrência com painel interativo
- Últimas notícias, atualizações e atualizações Análise de tendências
- Aproveite o poder da análise de benchmark para um rastreio abrangente da concorrência
Metodologia de Investigação
A recolha de dados e a análise do ano base são feitas através de módulos de recolha de dados com amostras grandes. A etapa inclui a obtenção de informações de mercado ou dados relacionados através de diversas fontes e estratégias. Inclui examinar e planear antecipadamente todos os dados adquiridos no passado. Da mesma forma, envolve o exame de inconsistências de informação observadas em diferentes fontes de informação. Os dados de mercado são analisados e estimados utilizando modelos estatísticos e coerentes de mercado. Além disso, a análise da quota de mercado e a análise das principais tendências são os principais fatores de sucesso no relatório de mercado. Para saber mais, solicite uma chamada de analista ou abra a sua consulta.
A principal metodologia de investigação utilizada pela equipa de investigação do DBMR é a triangulação de dados que envolve a mineração de dados, a análise do impacto das variáveis de dados no mercado e a validação primária (especialista do setor). Os modelos de dados incluem grelha de posicionamento de fornecedores, análise da linha de tempo do mercado, visão geral e guia de mercado, grelha de posicionamento da empresa, análise de patentes, análise de preços, análise da quota de mercado da empresa, normas de medição, análise global versus regional e de participação dos fornecedores. Para saber mais sobre a metodologia de investigação, faça uma consulta para falar com os nossos especialistas do setor.
Personalização disponível
A Data Bridge Market Research é líder em investigação formativa avançada. Orgulhamo-nos de servir os nossos clientes novos e existentes com dados e análises que correspondem e atendem aos seus objetivos. O relatório pode ser personalizado para incluir análise de tendências de preços de marcas-alvo, compreensão do mercado para países adicionais (solicite a lista de países), dados de resultados de ensaios clínicos, revisão de literatura, mercado remodelado e análise de base de produtos . A análise de mercado dos concorrentes-alvo pode ser analisada desde análises baseadas em tecnologia até estratégias de carteira de mercado. Podemos adicionar quantos concorrentes necessitar de dados no formato e estilo de dados que procura. A nossa equipa de analistas também pode fornecer dados em tabelas dinâmicas de ficheiros Excel em bruto (livro de factos) ou pode ajudá-lo a criar apresentações a partir dos conjuntos de dados disponíveis no relatório.

