
North America Chlor Alkali Market
Market Size in USD Billion
CAGR :
% 
 USD
32.38 Billion
USD
52.39 Billion
2025
2033
USD
32.38 Billion
USD
52.39 Billion
2025
2033
| 2026 –2033 | |
| USD 32.38 Billion | |
| USD 52.39 Billion | |
| % | |
|
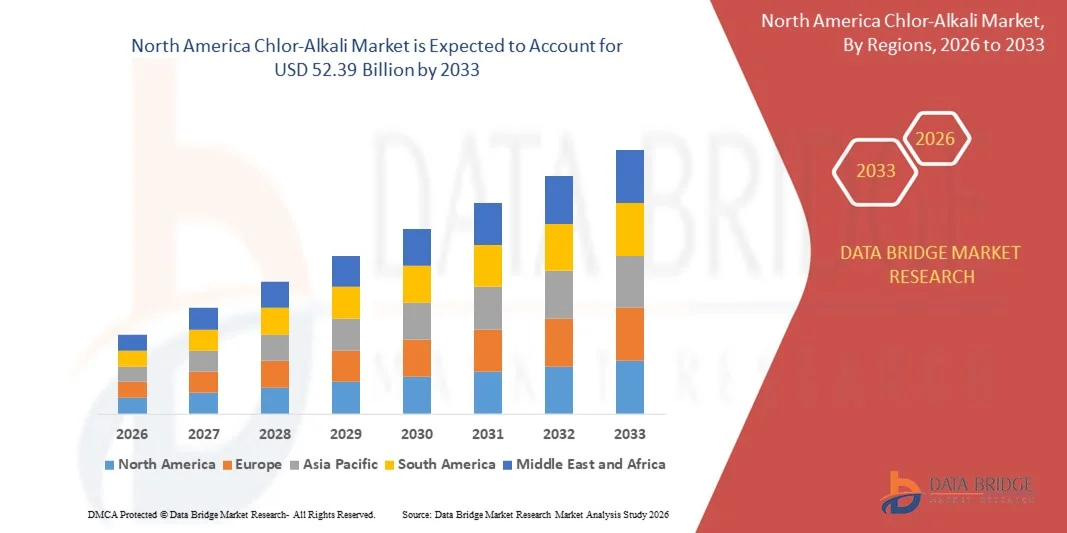
North America Chlor-Alkali Market Size
- The North America chlor-alkali market size was valued at USD 32.38 billion in 2025 and is expected to reach USD 52.39 billion by 2033, at a CAGR of 6.2% during the forecast period
- The market growth is largely fueled by the rising demand for essential chemicals such as caustic soda, chlorine, and sodium hypochlorite across multiple industries, including water treatment, chemical processing, and paper and pulp manufacturing, which is driving consistent adoption and capacity expansions
- Furthermore, increasing industrialization in emerging economies, coupled with infrastructure development and urbanization, is intensifying the demand for chlor‑alkali products for applications in soaps, detergents, and PVC production, thereby significantly contributing to market growth
North America Chlor-Alkali Market Analysis
- Chlor‑alkali products, including caustic soda, chlorine, and derivatives, are critical raw materials used in diverse industrial processes, making them indispensable for manufacturing, water treatment, and chemical production across residential, commercial, and industrial sectors
- The escalating demand for chlor‑alkali chemicals is primarily driven by the growth of end-use industries, rising regulatory emphasis on clean water and sanitation, and technological advancements in energy-efficient production processes such as membrane cell technology, which enhance supply reliability and operational efficiency
- U.S. dominated the chlor-alkali market in 2025, due to its well-established chemical manufacturing infrastructure, strong industrial base, and growing demand for chlor-alkali products across water treatment, chemical processing, and PVC production sectors
- Canada is expected to be the fastest growing country in the chlor-alkali market during the forecast period due to increasing industrialization, expansion of chemical and water treatment facilities, and growing demand for high-purity caustic soda and chlorine
- Caustic soda lye segment dominated the market with a market share of 50% in 2025, due to its extensive applications in chemical processing, pulp and paper manufacturing, and water treatment. Industries prefer Caustic Soda Lye for its high solubility, consistent concentration, and ease of handling, which simplifies large-scale production processes. It is also favored for its cost-effectiveness and reliability in producing downstream chemicals, making it a staple in industrial operations. The rising demand for cleaning agents and industrial chemicals further strengthens the market presence of Caustic Soda Lye. Manufacturers are increasingly focusing on producing high-purity lye to meet stringent regulatory standards, ensuring quality and safety. The segment’s dominance is expected to continue due to its versatility across multiple end-use sectors and global industrial adoption
Report Scope and Chlor-Alkali Market Segmentation
|
Attributes |
Chlor-Alkali Key Market Insights |
|
Segments Covered |
|
|
Countries Covered |
North America
|
|
Key Market Players |
|
|
Market Opportunities |
|
|
Value Added Data Infosets |
In addition to the insights on market scenarios such as market value, growth rate, segmentation, geographical coverage, and major players, the market reports curated by the Data Bridge Market Research also include import export analysis, production capacity overview, production consumption analysis, price trend analysis, climate change scenario, supply chain analysis, value chain analysis, raw material/consumables overview, vendor selection criteria, PESTLE Analysis, Porter Analysis, and regulatory framework. |
North America Chlor-Alkali Market Trends
Increasing Adoption of Membrane Cell Technology in Chlor‑Alkali Production
- The adoption of membrane cell technology in chlor‑alkali production is a key trend, as it provides higher energy efficiency, lower environmental impact, and superior product purity compared to traditional diaphragm and mercury cell processes, driving widespread industrial interest
- For instance, thyssenkrupp nucera has supplied advanced membrane cell electrolyzers to multiple chlor‑alkali facilities in Saudi Arabia and India, enabling manufacturers to enhance production efficiency, reduce energy usage, and comply with stringent environmental regulations
- Membrane cell technology also facilitates scalable production for caustic soda and chlorine, allowing companies to adjust output based on market demand and optimize operational costs, which is increasingly important for maintaining competitiveness
- The trend is further supported by governmental regulations and sustainability initiatives promoting lower mercury emissions and reduced energy consumption, encouraging the replacement of older technologies with membrane-based systems
- In addition, the integration of advanced monitoring and automation systems with membrane cell processes enables real-time control, predictive maintenance, and process optimization, enhancing overall operational reliability and consistency in product quality
- The growing emphasis on energy-efficient and environmentally responsible production methods is reshaping the chlor‑alkali industry, as companies increasingly invest in membrane cell technology to meet global industrial demand while aligning with sustainability goals
North America Chlor-Alkali Market Dynamics
Driver
Growing Industrialization and Urbanization in Emerging Economies
- The rapid industrialization and urbanization in emerging economies is driving heightened demand for chlor‑alkali products such as caustic soda, chlorine, and sodium hypochlorite, which are essential for water treatment, chemical processing, and construction industries
- For instance, Tata Chemicals Ltd. in India is expanding its chlor‑alkali production capacity to meet increasing demand from the growing paper, detergent, and PVC manufacturing sectors, reflecting how industrial expansion is stimulating market growth
- Rising urban populations and infrastructure development are creating consistent demand for disinfectants, cleaning agents, and PVC, which rely heavily on chlor‑alkali chemicals, thereby reinforcing their central role in industrial growth
- The proliferation of manufacturing facilities in emerging markets is leading to greater consumption of chlor‑alkali products for multiple industrial applications, supporting steady market expansion across regions such as Asia-Pacific and the North America
- In addition, the increasing investment in industrial projects, residential complexes, and public utilities is ensuring long-term demand stability for chlor‑alkali chemicals, strengthening the market outlook and attracting further capital investment
Restraint/Challenge
High Energy Consumption and Environmental Compliance Costs
- High energy requirements for chlor‑alkali production, especially in older mercury and diaphragm cell plants, pose a significant challenge for cost-efficient manufacturing and affect profit margins for producers
- For instance, several small and mid-sized manufacturers face financial strain in upgrading older plants to meet energy efficiency standards and comply with environmental regulations imposed by authorities such as the Ministry of Environment in India and the U.S. EPA
- Strict regulatory frameworks for emissions and effluent disposal increase operational costs, as companies must invest in pollution control equipment and adopt cleaner production technologies, impacting overall profitability
- Managing high operational expenses while maintaining competitive pricing for chlor‑alkali products remains a critical barrier, particularly for producers in price-sensitive emerging markets
- In addition, the need to balance energy efficiency, environmental compliance, and production output is challenging for companies globally, requiring significant capital investment and technological upgrades to sustain growth
North America Chlor-Alkali Market Scope
The market is segmented on the basis of type, product, production process, distribution channel, and end-user.
- By Type
On the basis of type, the Chlor-Alkali market is segmented into Caustic Soda Flakes, Caustic Soda Lye, and Others. The Caustic Soda Lye segment dominated the market with the largest revenue share of 50% in 2025 due to its extensive applications in chemical processing, pulp and paper manufacturing, and water treatment. Industries prefer Caustic Soda Lye for its high solubility, consistent concentration, and ease of handling, which simplifies large-scale production processes. It is also favored for its cost-effectiveness and reliability in producing downstream chemicals, making it a staple in industrial operations. The rising demand for cleaning agents and industrial chemicals further strengthens the market presence of Caustic Soda Lye. Manufacturers are increasingly focusing on producing high-purity lye to meet stringent regulatory standards, ensuring quality and safety. The segment’s dominance is expected to continue due to its versatility across multiple end-use sectors and global industrial adoption.
The Caustic Soda Flakes segment is anticipated to witness the fastest growth rate from 2026 to 2033, driven by increasing use in smaller-scale industrial operations and household applications. For instance, companies such as Olin Corporation are expanding production of flakes to cater to specialty applications where solid handling is preferred. Flakes provide easier storage and transportation advantages compared with liquid lye, making them suitable for regions with logistical challenges. Growing adoption in niche chemical processes and in emerging markets is expected to fuel consistent demand. Innovations in flake production that improve purity and reduce energy consumption further enhance their appeal. The segment’s growth is also supported by rising awareness of operational efficiency and storage convenience.
- By Product
On the basis of product, the market is segmented into Chlorine, Sodium Hydroxide and Potassium Hydroxide, Caustic Soda, Sodium Hypochlorite, Vinyl Chloride Monomer, Hydrogen Chloride, and Others. The Chlorine segment dominated the market in 2025 due to its critical role in producing PVC, disinfectants, and other industrial chemicals. Chlorine’s widespread use in water treatment and sanitation drives consistent industrial demand, particularly in urban and municipal applications. Its compatibility with various downstream chemical processes ensures stable market adoption. Leading chemical manufacturers are investing in chlorine production facilities to meet growing infrastructure and healthcare demands. Regulatory compliance and advances in safe handling practices have enhanced its adoption across multiple sectors. The segment remains pivotal for the chemical industry, maintaining its leadership position in revenue generation.
The Sodium Hypochlorite segment is expected to witness the fastest growth rate from 2026 to 2033, fueled by increasing demand for disinfectants and bleaching agents in healthcare and water treatment sectors. For instance, companies such as OxyChem are scaling production to supply hospitals and municipal water systems. Rising public health awareness and stricter sanitation regulations further drive demand for liquid bleach solutions. Its versatility in both industrial and household applications adds to market attractiveness. Advances in stabilized formulations and eco-friendly production methods also contribute to segment growth. Growing urbanization and industrialization are expected to continue supporting its expansion.
- By Production Process
On the basis of production process, the market is segmented into Membrane Cell Process, Diaphragm Cell Process, and Mercury Cell Process. The Membrane Cell Process segment dominated the market in 2025 due to its energy efficiency, lower environmental impact, and high-purity output. Industries prefer membrane technology for producing caustic soda and chlorine with minimal mercury contamination, aligning with stringent environmental regulations. The process also enables scalable production with reduced waste generation, making it economically viable for large-scale operations. Investments in modern membrane facilities and technological upgrades by major manufacturers support sustained growth. Its adoption across developed regions is reinforced by environmental compliance mandates and corporate sustainability initiatives. The segment’s leadership is expected to continue as green production becomes a key priority globally.
The Diaphragm Cell Process segment is anticipated to witness the fastest growth rate from 2026 to 2033, driven by its suitability for smaller and mid-sized production facilities in emerging markets. For instance, companies such as Tata Chemicals are expanding diaphragm-based units to cater to regional chemical manufacturing needs. The process offers moderate operational costs and flexibility in production scale. Its compatibility with various chemical end-products enhances adoption in diverse industrial applications. Technological improvements that reduce energy consumption and improve efficiency are boosting market interest. Rising industrial activity in developing economies supports steady expansion of this segment.
- By Distribution Channel
On the basis of distribution channel, the market is segmented into B2B/Direct Sales, Warehouses, E-Commerce, Specialty Stores, and Others. The B2B/Direct Sales segment dominated the market in 2025 due to its strong ties with industrial and commercial customers who require bulk orders and long-term supply contracts. Direct sales ensure reliable supply chains, consistent quality, and timely delivery, which are critical for large-scale operations. Manufacturers often establish long-term agreements with chemical processing, pulp and paper, and pharmaceutical companies to secure stable revenue streams. Efficient logistics and dedicated customer support enhance trust and adoption of direct sales channels. The segment’s dominance is reinforced by its alignment with industry procurement practices and predictable demand cycles.
The E-Commerce segment is expected to witness the fastest growth rate from 2026 to 2033, driven by increasing online procurement of specialty chemicals and smaller packaging units. For instance, companies such as Brenntag are leveraging online platforms to provide B2B and B2C customers with streamlined ordering and delivery options. Rising digital adoption in emerging markets enables quick access to chemical products without traditional intermediaries. Convenience, transparent pricing, and traceable delivery make e-commerce an attractive option for smaller enterprises. Growing awareness of digital supply channels and integration with inventory management systems supports adoption. The segment’s growth is further fueled by expansion in specialty chemicals and consumer-focused industrial products.
- By End-User
On the basis of end-user, the market is segmented into Soaps and Detergents, Paper and Pulp, Pharmaceuticals, Organics, Inorganics, Textiles, Water Treatment, Chemical Processing, and Others. The Soaps and Detergents segment dominated the market in 2025 due to the high consumption of caustic soda and chlorine in cleaning products manufacturing. Rising hygiene awareness and increasing demand for household and industrial cleaning agents contribute to steady market growth. Large-scale detergent manufacturers rely on a continuous supply of raw chemicals to maintain production efficiency. Innovations in eco-friendly and high-performance formulations further reinforce demand. Regulatory standards for product safety drive the use of standardized chemical inputs in production processes. The segment’s dominance is expected to continue due to its consistent and widespread consumption across residential and industrial sectors.
The Water Treatment segment is anticipated to witness the fastest growth rate from 2026 to 2033, driven by the rising need for safe drinking water and wastewater management in urban and industrial areas. For instance, companies such as Suez are investing in chlorine and caustic soda supplies for municipal and industrial water treatment projects. Stricter environmental regulations and public health initiatives increase demand for disinfectants and pH control chemicals. Technological advancements in water treatment processes enhance operational efficiency and chemical usage. Growing urbanization and industrialization contribute to expanding adoption of treatment chemicals. The segment’s growth trajectory is expected to remain strong as global water safety standards become more stringent.
North America Chlor-Alkali Market Regional Analysis
- U.S. dominated the chlor-alkali market with the largest revenue share in 2025, driven by its well-established chemical manufacturing infrastructure, strong industrial base, and growing demand for chlor-alkali products across water treatment, chemical processing, and PVC production sectors
- High industrial output, advanced production technologies, and regulatory emphasis on environmental compliance and energy-efficient operations further reinforce the country’s market leadership
- A robust network of leading domestic producers, strategic partnerships with global chemical companies, and continuous adoption of membrane cell technology support strong market penetration across industrial, municipal, and chemical sectors, while ongoing investments in R&D and process optimization solidify the U.S. position as the dominant market in North America
Canada Chlor-Alkali Market Insight
Canada is projected to register the fastest CAGR in the North America chlor-alkali market from 2026 to 2033, supported by increasing industrialization, expansion of chemical and water treatment facilities, and growing demand for high-purity caustic soda and chlorine. For instance, Kemira’s investments in expanding chlorine and caustic soda production capacities for municipal water treatment and chemical applications highlight how industrial growth and infrastructure development are driving market expansion. Rising focus on sustainable production, adoption of energy-efficient technologies, and supportive government policies for chemical manufacturing are accelerating consumption. The growing emphasis on eco-friendly chlor-alkali processes and high-quality chemical outputs is enhancing the market outlook, positioning Canada as the fastest-growing country in the region.
Mexico Chlor-Alkali Market Insight
Mexico is anticipated to witness steady growth from 2026 to 2033, driven by the increasing demand for chlor-alkali products in water treatment, industrial chemicals, and construction sectors. The expansion of chemical manufacturing clusters, improving access to industrial-grade chlor-alkali products, and the rising participation of regional and global chemical companies are improving product availability. Increasing adoption of cost-effective production technologies and investment in supply chain efficiency support a stable market growth trajectory. In addition, government initiatives promoting safe water treatment practices and industrial modernization are contributing to steady consumption, ensuring Mexico maintains a consistent growth pattern within the North America chlor-alkali market.
North America Chlor-Alkali Market Share
The chlor-alkali industry is primarily led by well-established companies, including:
- Formosa Plastics Corporation (Taiwan)
- Hanwha Solutions (South Korea)
- Olin Corporation (U.S.)
- Tosoh Corporation (Japan)
- Tata Chemicals Ltd (India)
- Covestro AG (Germany)
- SABIC (Saudi Arabia)
- Kemira (Finland)
- SP Chemicals Holdings Ltd. (Hong Kong)
- Coogee Chemicals (Australia)
- Xinjiang Zhongtai Chemical Co., Ltd (China)
- China Petroleum & Chemical Corporation (China)
- AGC Inc. (Japan)
- Westlake Chemical Corporation (U.S.)
Latest Developments in North America Chlor-Alkali Market
- In July 2025, TGV SRAAC Ltd. in India selected thyssenkrupp nucera to expand its chlor‑alkali plant in Kurnool by 50%, increasing caustic soda output from 1,000 to 1,500 tons per day. This capacity increase will boost the company’s annual production by approximately 500,000 tons, addressing rising domestic demand in chemical and water treatment industries. The project enhances TGV SRAAC’s supply reliability and strengthens India’s overall chlor‑alkali market, supporting industrial growth and local chemical manufacturing independence
- In June 2025, thyssenkrupp nucera was awarded a contract by Basic Chemical Industries Company (BCI / CMDC) to expand their chlor‑alkali plant in Jubail, Saudi Arabia. This expansion involves the installation of advanced membrane‑electrolysis technology, which will significantly enhance energy efficiency and production capacity for caustic soda and chlorine. The development strengthens BCI’s ability to meet growing industrial demand in the Middle East and reinforces the company’s leadership position in the regional chlor‑alkali market while supporting sustainable production practices
- In June 2025, Kumho Mitsui Chemicals in South Korea commissioned a new chlor‑alkali plant supplied by thyssenkrupp nucera, using the advanced e‑BiTAC v7 electrolyzer. This facility will produce around 60,000 tons per year of chlorine, reducing the company’s reliance on imports and enhancing domestic supply. The plant integrates an eco‑friendly brine‑recycling process, contributing to sustainability goals, and positions Kumho Mitsui Chemicals as a competitive player in the South Korean chlor‑alkali market while improving operational efficiency
- In December 2024, Chlorum Solutions USA partnered with thyssenkrupp nucera to develop a skid‑mounted chlor‑alkali facility in Casa Grande, Arizona, United States. This modular plant allows rapid deployment and reduces dependence on long‑distance chemical imports, improving the availability of caustic soda and chlorine for regional industries. The partnership strengthens the company’s local supply chain, enhances operational flexibility, and meets the increasing demand from industrial, water treatment, and chemical processing sectors in the U.S. market
- In January 2023, Mitsui & Co., Ltd. and Olin Corporation launched the Blue Water Alliance joint venture to integrate procurement, sales, and logistics for chlor‑alkali products globally. This collaboration ensures greater supply security, streamlines distribution, and increases access to essential chemicals such as caustic soda and ethylene dichloride. The alliance also supports sustainability initiatives by optimizing supply chains and leveraging renewable energy, positioning both companies to meet rising global demand while improving efficiency and resilience in the chlor‑alkali market
SKU-
Get online access to the report on the World's First Market Intelligence Cloud

- Interactive Data Analysis Dashboard
- Company Analysis Dashboard for high growth potential opportunities
- Research Analyst Access for customization & queries
- Competitor Analysis with Interactive dashboard
- Latest News, Updates & Trend analysis
- Harness the Power of Benchmark Analysis for Comprehensive Competitor Tracking
North America Chlor Alkali Market, Supply Chain Analysis and Ecosystem Framework
To support market growth and help clients navigate the impact of geopolitical shifts, DBMR has integrated in-depth supply chain analysis into its North America Chlor Alkali Market research reports. This addition empowers clients to respond effectively to global changes affecting their industries. The supply chain analysis section includes detailed insights such as North America Chlor Alkali Market consumption and production by country, price trend analysis, the impact of tariffs and geopolitical developments, and import and export trends by country and HSN code. It also highlights major suppliers with data on production capacity and company profiles, as well as key importers and exporters. In addition to research, DBMR offers specialized supply chain consulting services backed by over a decade of experience, providing solutions like supplier discovery, supplier risk assessment, price trend analysis, impact evaluation of inflation and trade route changes, and comprehensive market trend analysis.
Research Methodology
Data collection and base year analysis are done using data collection modules with large sample sizes. The stage includes obtaining market information or related data through various sources and strategies. It includes examining and planning all the data acquired from the past in advance. It likewise envelops the examination of information inconsistencies seen across different information sources. The market data is analysed and estimated using market statistical and coherent models. Also, market share analysis and key trend analysis are the major success factors in the market report. To know more, please request an analyst call or drop down your inquiry.
The key research methodology used by DBMR research team is data triangulation which involves data mining, analysis of the impact of data variables on the market and primary (industry expert) validation. Data models include Vendor Positioning Grid, Market Time Line Analysis, Market Overview and Guide, Company Positioning Grid, Patent Analysis, Pricing Analysis, Company Market Share Analysis, Standards of Measurement, Global versus Regional and Vendor Share Analysis. To know more about the research methodology, drop in an inquiry to speak to our industry experts.
Customization Available
Data Bridge Market Research is a leader in advanced formative research. We take pride in servicing our existing and new customers with data and analysis that match and suits their goal. The report can be customized to include price trend analysis of target brands understanding the market for additional countries (ask for the list of countries), clinical trial results data, literature review, refurbished market and product base analysis. Market analysis of target competitors can be analyzed from technology-based analysis to market portfolio strategies. We can add as many competitors that you require data about in the format and data style you are looking for. Our team of analysts can also provide you data in crude raw excel files pivot tables (Fact book) or can assist you in creating presentations from the data sets available in the report.

