
Asia Eggs Market
Market Size in USD Billion
 USD
26.80 Billion
USD
46.10 Billion
2024
2032
USD
26.80 Billion
USD
46.10 Billion
2024
2032
| 2025 - 2032 | |
| USD 26.80 Billion | |
| USD 46.10 Billion | |
| % | |
|
Asia Eggs Market Size
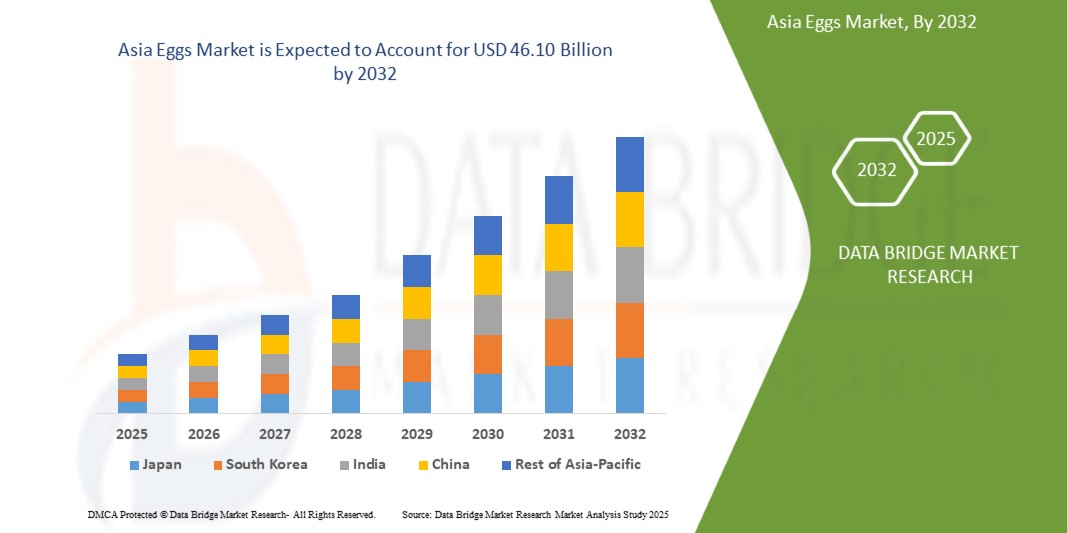
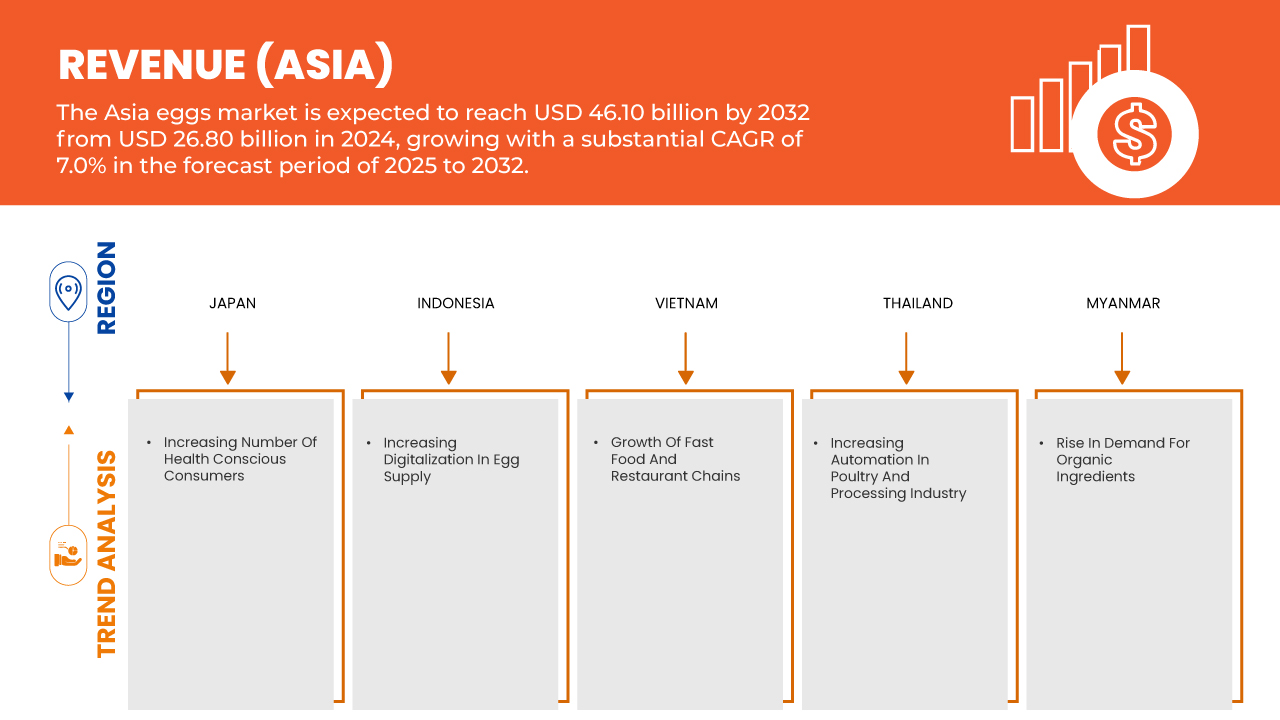
- The Asia Eggs Market was valued at USD 26.80 billion in 2024 and is expected to reach USD 46.10 billion by 2032
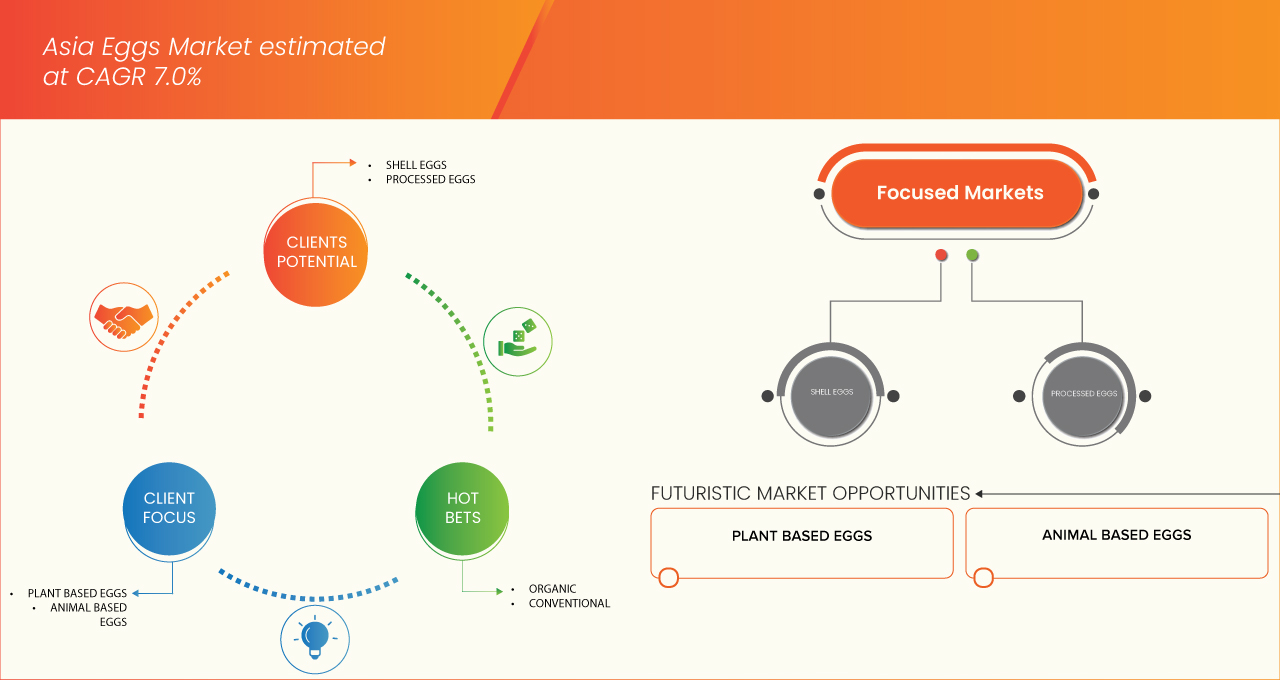
- During the forecast period of 2025 to 2032 the market is likely to grow at a CAGR of 7.0%, primarily driven by expansion of online retail and supermarket distribution channels
- This growth is driven by factors such as the rapid development and modernization of supermarket and hypermarket chains have significantly improved the offline availability of egg
Asia Eggs Market Analysis
- The Asia Eggs Market is witnessing steady growth, fueled by rising population, rapid urbanization, and changing dietary habits that emphasize affordable, protein-rich, and versatile food options. Eggs remain a staple across households due to their nutritional value, cost-effectiveness, and adaptability in diverse cuisines. However, concerns related to avian diseases, fluctuating feed costs, and food safety standards pose challenges to long-term market stability.
- The industry is increasingly focusing on product innovation and premiumization. Producers are launching fortified eggs enriched with Omega-3, Vitamin D, and antioxidants to meet the needs of health-conscious consumers. The rising popularity of organic, free-range, and antibiotic-free eggs aligns with the global shift toward wellness, sustainability, and clean-label products.
- Japan dominated the Asia Eggs Market, accounting for over 31.47% market share in 2024 of regional production and consumption, supported by large-scale poultry farms, high household demand, and strong integration of eggs in traditional and modern diets.
- Indonesia is the fastest-growing market in the region, driven by its large population, rising disposable incomes, and increasing demand for affordable protein sources. Expansion of modern retail networks and fortified egg consumption is accelerating growth.
- The Shell Eggs segment dominated the Asia Eggs Market with largest share of over 74.21% 2024, reflecting its dominance in daily household consumption, while fortified and organic eggs are gradually gaining traction in urban markets.
Report Scope and Asia Eggs Market Segmentation
|
Attributes |
Asia Egg Key Market Insights |
|
Segments Covered |
|
|
Countries Covered |
|
|
Key Market Players |
|
|
Market Opportunities |
|
|
Value Added Data Infosets |
In addition to the insights on market scenarios such as market value, growth rate, segmentation, geographical coverage, and major players, the market reports curated by the Data Bridge Market Research also include import export analysis, production capacity overview, production consumption analysis, price trend analysis, climate change scenario, supply chain analysis, value chain analysis, raw material/consumables overview, vendor selection criteria, PESTLE Analysis, Porter Analysis, and regulatory framework. |
Asia Eggs Market Trends
Health-Oriented Innovation and Sustainable Farming in the Asia Eggs Market
- One prominent trend in the Asia Eggs Market is the growing focus on healthier, premium egg varieties and the adoption of sustainable farming practices to align with evolving consumer preferences and regulatory requirements.
- The market is witnessing increased demand for fortified eggs enriched with Omega-3, Vitamin D, and antioxidants, as well as organic, free-range, and antibiotic-free options. This shift is driven by rising health consciousness, food safety concerns, and the global move toward ethical consumption.
- For instance, in 2024, leading producers in Asia introduced branded “functional eggs” fortified with lutein for eye health and marketed in eco-friendly biodegradable cartons, highlighting both nutrition and sustainability benefits.
- Major players are integrating technology-driven innovations such as blockchain-enabled traceability, automated layer farms, and recyclable packaging to enhance transparency and operational efficiency. Regional diversification, including country-specific branding such as “kampung eggs” in Southeast Asia or premium cage-free variants in East Asia, is strengthening market penetration and consumer engagement.
- With regulators and consumers increasingly demanding clean-label products and eco-friendly farming methods, egg producers are prioritizing humane poultry practices, sustainable feed sourcing, and ESG-aligned reporting. This emphasis on health, transparency, and sustainability is emerging as a key differentiator, enabling brands to capture consumer trust and achieve long-term competitiveness in the Asian Asia Eggs Market.
Asia Eggs Market Dynamics
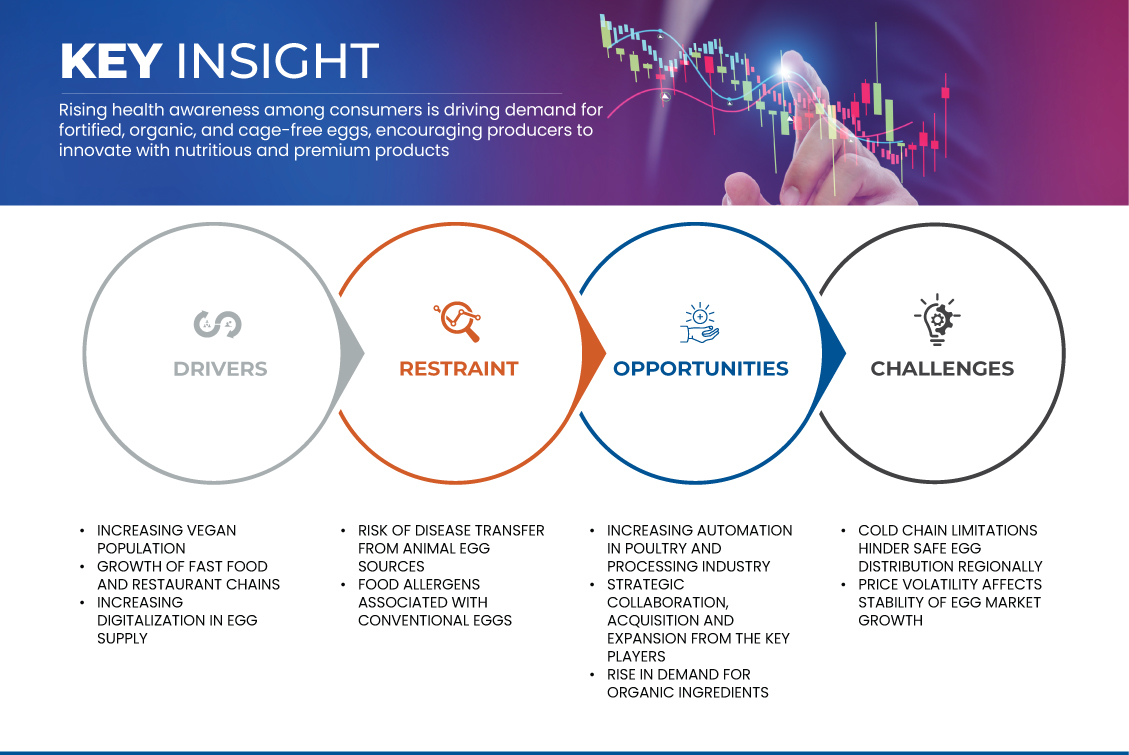
Driver
Increasing Vegan Population
- The rising vegan population in Asia is reshaping the Asia Eggs Market, influenced by health consciousness, ethical concerns about animal welfare, and growing awareness of environmental sustainability.
- In countries like Thailand, Singapore, and parts of Southeast Asia, younger, urban, and educated consumers are increasingly adopting vegan diets, reducing reliance on traditional animal-based protein sources.
- Plant-based egg alternatives made from mung beans (JUST Egg), legumes, and algae-based substitutes are gaining visibility in retail and foodservice channels, offering direct competition to conventional eggs.
- Major players are responding by innovating fortified and cruelty-free options, with companies such as Eat Just and Evo Foods expanding their portfolios of vegan egg alternatives in Asian markets.
- The rising vegan population is driving market diversification, encouraging egg producers to explore sustainable product lines and positioning vegan eggs as a transformative force in the Asia Eggs Market.
- For instance, in April 2023, according to an article published by Asia Food Journal, Singapore’s Float Foods unveiled the region’s first 100% plant-based poached egg and yolk—OnlyEg Poached Eg and OnlyEg Yolk—at the Food & Hotel Asia exhibition, signaling pioneering innovation in vegan-friendly protein alternatives
Opportunity
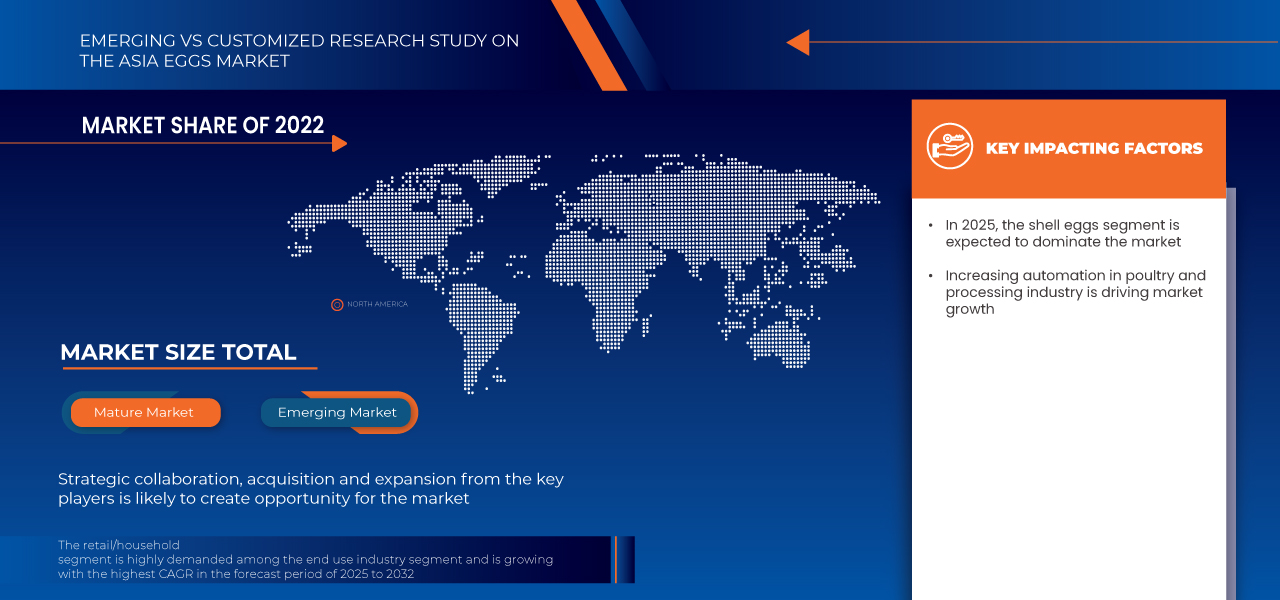
Increasing Automation in Poultry and Processing Industry
- The Asia Eggs Market is increasingly driven by technological adoption and automation in production. Countries such as Thailand and Vietnam are investing in automated hatcheries, grading, and packaging systems to minimize manual labor and ensure consistent quality.
- Robotics and AI-powered monitoring systems are being deployed in poultry farms to track bird health, improve feed conversion, and detect early signs of disease, reducing mortality and increasing overall farm efficiency.
- Automation in egg processing facilities—covering washing, candling, sorting, and labeling—is enabling producers to scale operations rapidly.
- The COVID-19 pandemic accelerated digital adoption, pushing producers to embrace automation for supply chain resilience. Countries like Japan have integrated traceability systems with blockchain technology to assure consumers of egg safety and quality.
- For instance, in October 2023, according to an article published by China Daily, Nantong’s Hai’an city in Jiangsu province adopted IoT and data-driven technology in poultry farming, allowing a single caretaker to manage up to 120,000 hens via smartphone, achieving a remarkable 6.6 metric tons of eggs produced daily
- As consumer demand for high-quality, safe, and traceable eggs grows, automation is becoming a transformative growth driver, creating long-term opportunities for efficiency, profitability, and compliance with stricter government food safety standards.
Restraint/Challenge
Price Volatility Affects Stability of Egg Market Growth
- Eggs, as a staple protein source, are highly sensitive to fluctuations in feed costs, disease outbreaks, and supply-demand imbalances.
- Sudden spikes in corn and soybean prices—the primary ingredients in poultry feed—directly increase production costs, forcing producers to adjust egg prices.
- Disease outbreaks, such as avian influenza, have repeatedly disrupted production across Asia, reducing supply and triggering sharp price hikes.
- Seasonal variations and extreme weather events exacerbate supply instability, making it difficult for producers to maintain consistent output and pricing.
- Small-scale farmers, who make up a significant portion of Asia’s poultry sector, are especially vulnerable, threatening their financial sustainability and limiting investment in scaling or modernization.
- For instance, in July 2025, as reported by Asia News Network, Bhutan's wholesale egg prices rose from Nu 1,900 per carton in February to Nu 2,300, attributed to the "One-Child, One-Egg" initiative and increased demand. Local vendors faced shortages, leading to retail prices reaching Nu 370 per tray.
Asia Eggs Market Scope
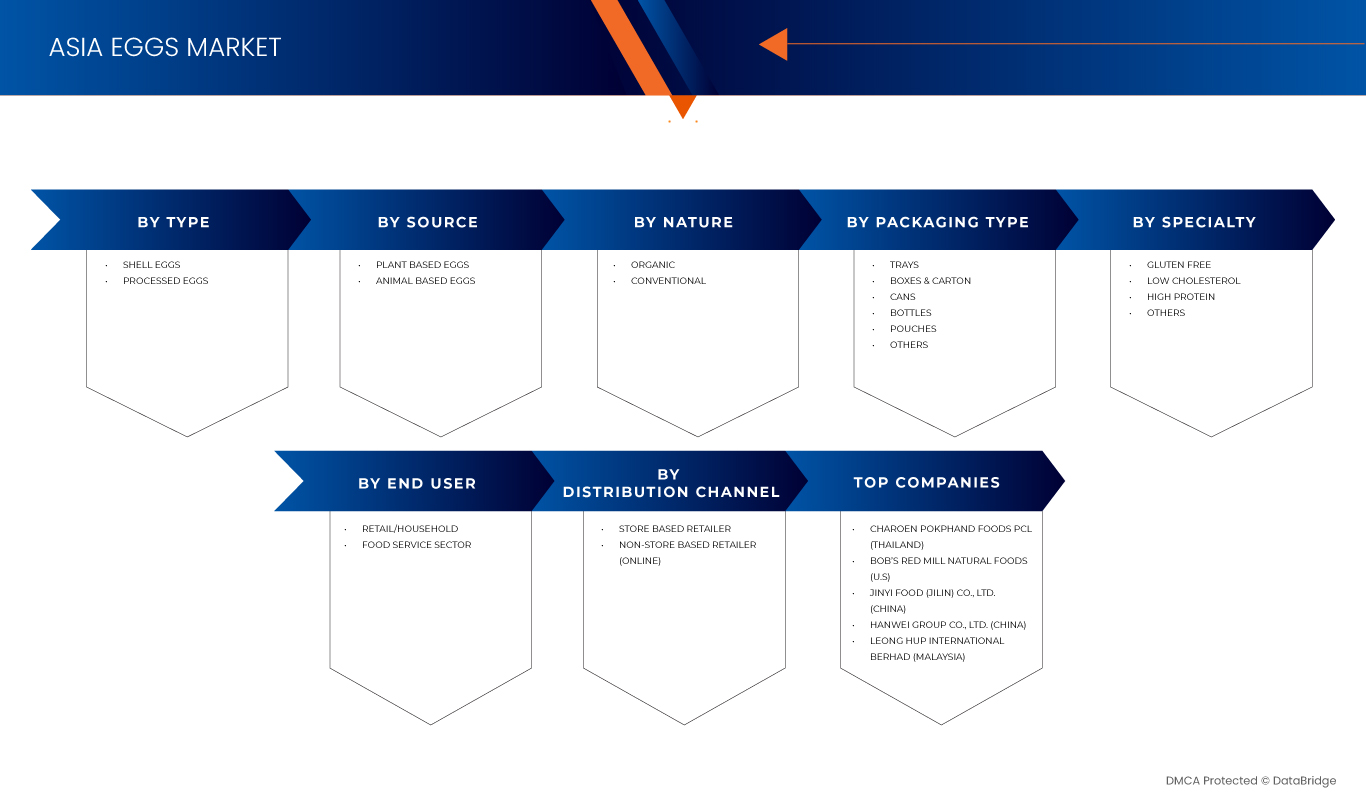
The Asia Eggs Market is segmented into type, source, nature, packaging type, specialty, end user and distribution channel.
By Type
On the basis of type, the market is segmented into shell eggs and processed egg. In 2025, the shell eggs segment is expected to dominate the market with a 74.28% market share due to superior barrier protection, lightweight structure, cost efficiency, versatility, extended shelf life, sustainability, and rising demand across food, pharmaceutical, and consumer goods industries
By End user
On the basis of end user, the Asia Eggs Market is segmented into retail/household, food service sector. In 2025, the Retail/Household segment is expected to dominate the market with a 88.83% market share due to the growing application and usage in the retail segment.
By Nature
On the basis of nature, the Asia Eggs Market is segmented into conventional and organic. In 2025, the conventional segment is expected to dominate the market with a 89.49% market share due to affordability, widespread consumer preference, high availability, and established distribution networks, making it the most accessible and cost-effective option in the egg market
By Source
On the basis of source, the Asia Eggs Market is segmented into plant based egg, animal based egg. In 2025, animal based eggs segment is expected to dominate the market with a 99.93% market share due to the availability of various animal based egg products in liquid form are driving the growth of the market
By Packaging type
On the basis of packaging type, the Asia Eggs Market is segmented into trays, boxes & carton, cans, bottles, pouches, others. In 2025, trays segment is expected to dominate the market with a 42.91% market share due to the easy availability and easy usage of trays packaging.
By Specialty
On the basis of specialty, the Asia Eggs Market is segmented into gluten free, low cholesterol, high protein and others. In 2025, the food & beverage segment is expected to dominate the market with a 17.34% market share due to the increasing demand for high protein foods such as eggs among health-conscious consumers
By Distribution channel
On the basis of distribution channel, the Asia Eggs Market is segmented into store based retailer and non-store based retailer (online). In 2025, the Food & Beverage segment is expected to dominate the market with a 75.47% market share due to the convenience and easy accessibility of a plant-based products in the nearby stores
Asia Eggs Market Regional Analysis
- Japan dominated the Asia Eggs Market, accounting for over 31.47% market share in 2024 of regional production and consumption, supported by large-scale poultry farms, high household demand, and strong integration of eggs in traditional and modern diets.
- Japan represents a mature and high-consumption market, with eggs deeply integrated into daily diets, such as in sushi, tamago, and traditional breakfast dishes. Demand is supported by consumers’ preference for fresh, high-quality, and safely produced eggs. Health-conscious trends are driving growth in fortified eggs enriched with vitamins and DHA, as well as cage-free and antibiotic-free variants.
- Food safety and hygiene standards are exceptionally stringent, pushing producers toward advanced traceability systems and eco-friendly packaging. Convenience stores, supermarkets, and e-commerce channels remain dominant distribution outlets, while premiumization and branded eggs continue to capture a loyal, quality-driven consumer base.
Indonesia Asia Eggs Market Insight
Indonesia is witnessing strong growth in egg consumption, supported by a large population, rising middle-class incomes, and increasing demand for affordable protein sources. Eggs are a staple ingredient in local cuisines, making them an essential part of household diets. Market expansion is driven by growing preference for fortified and packaged eggs, alongside government initiatives to improve food security and nutrition. However, supply chain inefficiencies and disease management challenges remain barriers. Traditional wet markets dominate distribution, but modern retail and online grocery platforms are gaining momentum in urban centers. Premium eggs, traceable sourcing, and sustainable packaging are emerging as differentiators in a highly price-sensitive market.
The Major Market Leaders Operating in the Market Are:
- Charoen Pokphand Foods PCL (Thailand)
- Bob’s Red Mill Natural Foods (U.S)
- Jinyi Food (Jilin) Co., Ltd. (China)
- Hanwei Group Co., Ltd. (China)
- Leong Hup International Berhad (Malaysia)
- Sakku Group (Thailand)
- Hubei Shendan Health Food Co., Ltd. (China)
- PT. Sreeya Sewu Indonesia Tbk (Indonesia)
- Seng Choon Farm Pte Ltd. (Singapore)
- Teo Seng Capital Berhad (Malaysia)
- Chew’s Egg (Singapore)
- Eggriculture Foods Ltd. (Singapore)
- Tafa Egg (Vietnam)
- Vinh Thanh Dat Foods Joint Stock Company (Vietnam)
SKU-

- Interactive Data Analysis Dashboard
- Company Analysis Dashboard for high growth potential opportunities
- Research Analyst Access for customization & queries
- Competitor Analysis with Interactive dashboard
- Latest News, Updates & Trend analysis
- Harness the Power of Benchmark Analysis for Comprehensive Competitor Tracking
Table of Content
1 INTRODUCTION
1.1 OBJECTIVES OF THE STUDY
1.2 MARKET DEFINITION
1.3 OVERVIEW
1.4 LIMITATIONS
1.5 MARKETS COVERED
2 MARKET SEGMENTATION
2.1 MARKETS COVERED
2.2 GEOGRAPHICAL SCOPE
2.3 YEARS CONSIDERED FOR THE STUDY
2.4 CURRENCY AND PRICING
2.5 DBMR TRIPOD DATA VALIDATION MODEL
2.6 MULTIVARIATE MODELING
2.7 PRIMARY INTERVIEWS WITH KEY OPINION LEADERS
2.8 DBMR MARKET POSITION GRID
2.9 MARKET END-USER COVERAGE GRID
2.1 DBMR VENDOR SHARE ANALYSIS
2.11 SECONDARY SOURCES
2.12 ASSUMPTIONS
3 EXECUTIVE SUMMARY
4 PREMIUM INSIGHTS
4.1 PORTER’S FIVE FORCES ANALYSIS
4.1.1 THREAT OF NEW ENTRANTS
4.1.2 BARGAINING POWER OF SUPPLIERS
4.1.3 BARGAINING POWER OF BUYERS
4.1.4 THREAT OF SUBSTITUTES
4.1.5 INTERNAL COMPETITION
4.2 IMPORT EXPORT SCENARIO
4.3 PRICING ANALYSIS
4.4 PRODUCTION CONSUMPTION ANALYSIS
4.5 PROFIT MARGINS SCENARIO
4.6 VENDOR SELECTION CRITERIA
4.7 CONSUMER BUYING BEHAVIOUR
4.7.1 OVERVIEW
4.7.2 CULTURAL AND DIETARY SIGNIFICANCE
4.7.3 HEALTH AND NUTRITION AWARENESS
4.7.4 PRICE SENSITIVITY AND VALUE PERCEPTION
4.7.5 URBANIZATION AND CONVENIENCE ORIENTATION
4.7.6 TRUST, SAFETY, AND QUALITY CONCERNS
4.7.7 SUSTAINABILITY AND ETHICAL CONSIDERATIONS
4.7.8 DISTRIBUTION CHANNEL INFLUENCE
4.7.9 DEMOGRAPHIC INFLUENCES
4.7.10 CONCLUSION
4.8 SUPPLY CHAIN ANALYSIS FOR THE ASIA EGGS MARKET
4.8.1 OVERVIEW
4.8.2 LOGISTIC COST SCENARIO
4.8.3 IMPORTANCE OF LOGISTICS SERVICE PROVIDERS
4.8.4 CONCLUSION:
4.9 TECHNOLOGICAL ADVANCEMENT
4.1 VALUE CHAIN ANALYSIS
4.11 BRAND OUTLOOK
4.11.1 BRAND COMPARATIVE ANALYSIS OF THE ASIA EGGS MARKET
4.11.2 PRODUCT VS BRAND OVERVIEW
4.11.2.1 PRODUCT OVERVIEW
4.11.2.2 BRAND OVERVIEW
4.12 COST ANALYSIS BREAKDOWN – ASIA EGGS MARKET
4.13 INDUSTRY ECOSYSTEM ANALYSIS – ASIA EGGS MARKET
4.14 INNOVATION TRACKER – ASIA EGGS MARKET
4.15 PATENT ANALYSIS
4.16 RAW MATERIAL COVERAGE ON THE ASIA EGGS MARKET
4.16.1 FEED INGREDIENTS – THE LARGEST COST COMPONENT
4.16.2 VETERINARY AND HEALTH INPUTS
4.16.3 PACKAGING MATERIALS
4.16.4 UTILITIES AND ENERGY INPUTS
4.16.5 MARKET IMPLICATIONS
5 TARIFFS & IMPACT ON THE MARKET – ASIA EGGS MARKET
6 REGULATION COVERAGE FOR THE ASIA EGGS MARKET
7 MARKET OVERVIEW
7.1 DRIVER
7.1.1 INCREASING NUMBER OF HEALTH-CONSCIOUS CONSUMERS
7.1.2 INCREASING VEGAN POPULATION
7.1.3 GROWTH OF FAST FOOD AND RESTAURANT CHAINS
7.1.4 INCREASING DIGITALIZATION IN EGG SUPPLY
7.2 RESTRAINTS
7.2.1 RISK OF DISEASE TRANSFER FROM ANIMAL EGG SOURCES
7.2.2 FOOD ALLERGENS ASSOCIATED WITH CONVENTIONAL EGGS
7.3 OPPORTUNITIES
7.3.1 INCREASING AUTOMATION IN THE POULTRY AND PROCESSING INDUSTRY
7.3.2 STRATEGIC COLLABORATIONS, ACQUISITIONS, AND EXPANSIONS FROM KEY PLAYERS
7.3.3 RISE IN DEMAND FOR ORGANIC INGREDIENTS
7.4 CHALLENGES
7.4.1 COLD CHAIN LIMITATIONS HINDER SAFE EGG DISTRIBUTION REGIONALLY
7.4.2 PRICE VOLATILITY AFFECTS THE STABILITY OF EGG MARKET GROWTH
8 ASIA EGGS MARKET, BY TYPE
8.1 OVERVIEW
8.2 SHELL EGGS
8.2.1 CAGED, BY EGG
8.2.2 CAGED-FREE, BY EGG
8.3 PROCESSED EGGS
8.3.1 EGG POWDER/DRIED EGGS, BY PRODUCT
8.3.2 LIQUID EGGS, BY PRODUCT
8.3.3 FROZEN EGGS, BY PRODUCT
8.3.4 SPECIALTY EGGS, BY PRODUCT
9 ASIA EGGS MARKET, BY NATURE
9.1 OVERVIEW
9.2 CONVENTIONAL
9.3 ORGANIC
10 ASIA EGGS MARKET, BY PACKAGING TYPE
10.1 OVERVIEW
10.2 TRAYS
10.3 BOXES & CARTON
10.4 BOTTLES
10.5 POUCHES
10.6 CANS
10.7 OTHERS
11 ASIA EGGS MARKET, BY SPECIALTY
11.1 OVERVIEW
11.2 HIGH PROTEIN
11.3 LOW CHOLESTEROL
11.4 GLUTEN FREE
11.5 OTHERS
12 ASIA EGGS MARKET, BY DISTRIBUTION CHANNEL
12.1 OVERVIEW
12.2 STORE-BASED RETAILER
12.2.1 STORE-BASED RETAILER, BY DISTRIBUTION CHANNEL
12.3 NON-STORE BASED RETAILER (ONLINE)
13 ASIA EGGS MARKET, BY END-USER
13.1 OVERVIEW
13.2 RETAIL/HOUSEHOLD
13.3 FOOD SERVICE SECTOR
13.3.1 FOOD SERVICE SECTOR, BY SECTOR
13.3.1.1 RESTAURANT, BY TYPE
13.3.1.1.1 CHAIN RESTAURANT, BY SERVICE TYPE
13.3.1.1.1.1 FULL SERVICE RESTAURANTS, BY SERVICE TYPE
14 ASIA EGGS MARKET, BY SOURCE
14.1 OVERVIEW
14.2 ANIMAL-BASED EGGS
14.2.1 ANIMAL-BASED EGGS, BY CATEGORY
14.3 PLANT-BASED EGGS
14.3.1 PLANT-BASED EGGS, BY CATEGORY
15 ASIA EGGS MARKET, BY COUNTRY
15.1 ASIA EGGS MARKET
15.1.1 JAPAN
15.1.2 INDONESIA
15.1.3 VIETNAM
15.1.4 THAILAND
15.1.5 MYANMAR
15.1.6 TAIWAN
15.1.7 SINGAPORE
16 ASIA EGGS MARKET: COMPANY LANDSCAPE
16.1 COMPANY SHARE ANALYSIS: ASIA (DISTRIBUTERS)
17 SWOT ANALYSIS
18 COMPANY PROFILES DISTRIBUTER
18.1 AKARAGROUP
18.1.1 COMPANY SNAPSHOT
18.1.2 PRODUCT PORTFOLIO
18.1.3 RECENT DEVELOPMENT
18.2 CV. MAZA INSTAN FOOD (INFOOD)
18.2.1 COMPANY SNAPSHOT
18.2.2 PRODUCT PORTFOLIO
18.2.3 RECENT DEVELOPMENT
18.3 DASOON
18.3.1 COMPANY SNAPSHOT
18.3.2 PRODUCT PORTFOLIO
18.3.3 RECENT DEVELOPMENT
18.4 G DAN
18.4.1 COMPANY SNAPSHOT
18.4.2 PRODUCT PORTFOLIO
18.4.3 RECENT DEVELOPMENT
18.5 GOOD EGGS, INC.
18.5.1 COMPANY SNAPSHOT
18.5.2 PRODUCT PORTFOLIO
18.5.3 RECENT DEVELOPMENT
18.6 ONLYEG
18.6.1 COMPANY SNAPSHOT
18.6.2 PRODUCT PORTFOLIO
18.6.3 RECENT DEVELOPMENT
18.7 SENGKANG IMPORT & EXPORT PTE LTD
18.7.1 COMPANY SNAPSHOT
18.7.2 PRODUCT PORTFOLIO
18.7.3 RECENT DEVELOPMENT
19 COMAPANY PROFILES MANUFACTURER
19.1 CHAROEN POKPHAND FOODS PCL
19.1.1 COMPANY SNAPSHOT
19.1.2 REVENUE ANALYSIS
19.1.3 PRODUCT PORTFOLIO
19.1.4 RECENT DEVELOPMENT
19.2 SAKKU GROUP
19.2.1 COMPANY SNAPSHOT
19.2.2 BRAND PORTFOLIO
19.2.3 RECENT DEVELOPMENT
19.3 TAFA EGG
19.3.1 COMPANY SNAPSHOT
19.3.2 PRODUCT PORTFOLIO
19.3.3 RECENT DEVELOPMENT
19.4 HUBEI SHENDAN HEALTH FOOD CO., LTD
19.4.1 COMPANY SNAPSHOT
19.4.2 PRODUCT PORTFOLIO
19.4.3 RECENT DEVELOPMENT
19.5 HAN WEI GROUP CO., LTD
19.5.1 COMPANY SNAPSHOT
19.5.2 PRODUCT PORTFOLIO
19.5.3 RECENT DEVELOPMENT
19.6 BOB’S RED MILL NATURAL FOODS
19.6.1 COMPANY SNAPSHOT
19.6.2 PRODUCT PORTFOLIO
19.6.3 RECENT DEVELOPMENT
19.7 CHEW’S EGG
19.7.1 COMPANY SNAPSHOT
19.7.2 PRODUCT PORTFOLIO
19.7.3 RECENT DEVELOPMENT
19.8 EGGRICULTURE
19.8.1 COMPANY SNAPSHOT
19.8.2 REVENUE ANALYSIS
19.8.3 PRODUCT PORTFOLIO
19.8.4 RECENT DEVELOPMENT
19.9 JINYI FOOD (ALL ABOUT EGGS)
19.9.1 COMPANY SNAPSHOT
19.9.2 PRODUCT PORTFOLIO
19.9.3 RECENT DEVELOPMENT
19.1 LEONG HUP INTERNATIONAL BERHAD
19.10.1 COMPANY SNAPSHOT
19.10.2 REVENUE ANALYSIS
19.10.3 PRODUCT PORTFOLIO
19.10.4 RECENT DEVELOPMENT
19.11 PT. SREEYA SEWU INDONESIA TBK
19.11.1 COMPANY SNAPSHOT
19.11.2 REVENUE ANALYSIS
19.11.3 PRODUCT PORTFOLIO
19.11.4 RECENT DEVELOPMENT
19.12 SENG CHOON FARM PTE LTD
19.12.1 COMPANY SNAPSHOT
19.12.2 PRODUCT PORTFOLIO
19.12.3 RECENT DEVELOPMENT
19.13 TEO SENG CAPITAL BERHAD
19.13.1 COMPANY SNAPSHOT
19.13.2 REVENUE ANALYSIS
19.13.3 PRODUCT PORTFOLIO
19.13.4 RECENT DEVELOPMENT
19.14 VINH THANH DAT FOOD
19.14.1 COMPANY SNAPSHOT
19.14.2 PRODUCT PORTFOLIO
19.14.3 RECENT DEVELOPMENT
20 QUESTIONNAIRE
21 RELATED REPORTS
List of Table
TABLE 1 REGULATORY COVERAGE
TABLE 2 ASIA EGGS MARKET, BY TYPE, 2018-2032 (USD MILLION)
TABLE 3 ASIA EGGS MARKET, BY TYPE, 2018-2032
TABLE 4 ASIA SHELL EGGS IN EGGS MARKET, BY SUB-TYPE, 2018-2032 (USD MILLION)
TABLE 5 ASIA SHELL EGGS IN EGGS MARKET, BY SUB-TYPE, 2018-2032 (MILLION UNITS)
TABLE 6 ASIA SHELL EGGS IN EGGS MARKET, BY SUB-TYPE, 2018-2032 (USD/UNIT)
TABLE 7 ASIA CAGED IN EGGS MARKET, BY EGG, 2018-2032 (USD MILLION)
TABLE 8 ASIA CAGED-FREE IN EGGS MARKET, BY EGG, 2018-2032 (USD MILLION)
TABLE 9 ASIA PROCESSED EGGS IN EGGS MARKET, BY SUB-TYPE, 2018-2032 (USD MILLION)
TABLE 10 ASIA PROCESSED EGGS IN EGGS MARKET, BY SUB-TYPE, 2018-2032 (KILO TONS)
TABLE 11 ASIA PROCESSED EGGS IN EGGS MARKET, BY SUB-TYPE, 2018-2032 (USD/KG)
TABLE 12 ASIA EGG POWDER/DRIED EGGS IN EGGS MARKET, BY EGG, 2018-2032 (USD MILLION)
TABLE 13 ASIA LIQUID EGGS IN EGGS MARKET, BY PRODUCT, 2018-2032 (USD MILLION)
TABLE 14 ASIA FROZEN EGGS IN EGGS MARKET, BY PRODUCT, 2018-2032 (USD MILLION)
TABLE 15 ASIA SPECIALTY EGGS IN EGGS MARKET, BY PRODUCT, 2018-2032 (USD MILLION)
TABLE 16 ASIA EGGS MARKET, BY NATURE, 2018-2032 (USD MILLION)
TABLE 17 ASIA EGGS MARKET, BY PACKAGING TYPE, 2018-2032 (USD MILLION)
TABLE 18 ASIA EGGS MARKET, BY SPECIALTY, 2018-2032 (USD MILLION)
TABLE 19 ASIA EGGS MARKET, BY DISTRIBUTION CHANNEL, 2018-2032 (USD MILLION)
TABLE 20 ASIA STORE BASED RETAILER IN EGGS MARKET, BY DISTRIBUTION CHANNEL, 2018-2032 (USD MILLION)
TABLE 21 ASIA EGGS MARKET, BY END-USER, 2018-2032 (USD MILLION)
TABLE 22 GS MARKET, BY END-USER, 2018-2032 (MILLION UNITS/KILO TONS)
TABLE 23 ASIA FOOD SERVICE SECTOR IN EGGS MARKET, BY FOOD SERVICE SECTOR, 2018-2032 (USD MILLION)
TABLE 24 ASIA RESTAURANTS IN EGGS MARKET, BY TYPE, 2018-2032 (USD MILLION)
TABLE 25 ASIA CHAIN RESTAURANT IN EGGS MARKET, BY SERVICE TYPE, 2018-2032 (USD MILLION)
TABLE 26 ASIA FULL SERVICE RESTAURANTS IN EGGS MARKET, BY SERVICE TYPE, 2018-2032 (USD MILLION)
TABLE 27 ASIA EGGS MARKET, BY SOURCE, 2018-2032 (USD MILLION)
TABLE 28 ASIA EGGS MARKET, BY SOURCE, 2018-2032 (MILLION UNITS/KILO TONS)
TABLE 29 ASIA ANIMAL-BASED EGGS IN EGGS MARKET, BY CATEGORY, 2018-2032 (USD MILLION)
TABLE 30 ASIA PLANT-BASED EGGS IN EGGS MARKET, BY CATEGORY, 2018-2032 (USD MILLION)
TABLE 31 ASIA EGGS MARKET, BY COUNTRY, 2018-2032 (USD MILLION)
TABLE 32 ASIA SHELL EGGS IN EGGS MARKET, BY COUNTRY, 2018-2032 (MILLION UNITS)
TABLE 33 ASIA PROCESSED EGGS IN EGGS MARKET, BY COUNTRY, 2018-2032 (KILO TONS)
TABLE 34 JAPAN EGGS MARKET, BY TYPE, 2018-2032 (USD MILLION)
TABLE 35 JAPAN EGGS MARKET, BY TYPE, 2018-2032
TABLE 36 JAPAN SHELL EGGS IN EGGS MARKET, BY SUB-TYPE, 2018-2032 (USD MILLION)
TABLE 37 JAPAN SHELL EGGS IN EGGS MARKET, BY SUB-TYPE, 2018-2032 (MILLION UNITS)
TABLE 38 JAPAN SHELL EGGS IN EGGS MARKET, BY SUB-TYPE, 2018-2032 (USD/UNIT)
TABLE 39 JAPAN CAGED IN EGGS MARKET, BY EGG, 2018-2032 (USD MILLION)
TABLE 40 JAPAN CAGED-FREE IN EGGS MARKET, BY EGG, 2018-2032 (USD MILLION)
TABLE 41 JAPAN PROCESSED EGGS IN EGGS MARKET, BY SUB-TYPE, 2018-2032 (USD MILLION)
TABLE 42 JAPAN PROCESSED EGGS IN EGGS MARKET, BY SUB-TYPE, 2018-2032 (KILO TONS)
TABLE 43 JAPAN PROCESSED EGGS IN EGGS MARKET, BY SUB-TYPE, 2018-2032 (USD/KG)
TABLE 44 JAPAN EGG POWDER/DRIED EGGS IN EGGS MARKET, BY PRODUCT, 2018-2032 (USD MILLION)
TABLE 45 JAPAN LIQUID EGGS IN EGGS MARKET, BY PRODUCT, 2018-2032 (USD MILLION)
TABLE 46 JAPAN FROZEN EGGS IN EGGS MARKET, BY PRODUCT, 2018-2032 (USD MILLION)
TABLE 47 JAPAN SPECIALTY EGGS IN EGGS MARKET, BY PRODUCT, 2018-2032 (USD MILLION)
TABLE 48 JAPAN EGGS MARKET, BY END-USER, 2018-2032 (USD MILLION)
TABLE 49 JAPAN EGGS MARKET, BY END-USER, 2018-2032 (MILLION UNITS/KILO TONS)
TABLE 50 JAPAN FOOD SERVICE SECTOR IN EGGS MARKET, BY TYPE, 2018-2032 (USD MILLION)
TABLE 51 JAPAN RESTAURANTS IN EGGS MARKET, BY TYPE, 2018-2032 (USD MILLION)
TABLE 52 JAPAN CHAIN RESTAURANT IN EGGS MARKET, BY SERVICE TYPE, 2018-2032 (USD MILLION)
TABLE 53 JAPAN FULL SERVICE RESTAURANTS IN EGGS MARKET, BY SERVICE TYPE, 2018-2032 (USD MILLION)
TABLE 54 JAPAN EGGS MARKET, BY SOURCE, 2018-2032 (USD MILLION)
TABLE 55 JAPAN EGGS MARKET, BY SOURCE, 2018-2032 (MILLION UNITS/KILO TONS)
TABLE 56 JAPAN ANIMAL-BASED EGGS IN EGGS MARKET, BY CATEGORY, 2018-2032 (USD MILLION)
TABLE 57 JAPAN PLANT-BASED EGGS IN EGGS MARKET, BY CATEGORY, 2018-2032 (USD MILLION)
TABLE 58 JAPAN EGGS MARKET, BY NATURE, 2018-2032 (USD MILLION)
TABLE 59 JAPAN EGGS MARKET, BY PACKAGING TYPE, 2018-2032 (USD MILLION)
TABLE 60 JAPAN EGGS MARKET, BY SPECIALTY, 2018-2032 (USD MILLION)
TABLE 61 JAPAN EGGS MARKET, BY DISTRIBUTION CHANNEL, 2018-2032 (USD MILLION)
TABLE 62 JAPAN STORE BASED RETAILER IN EGGS MARKET, BY DISTRIBUTION CHANNEL, 2018-2032 (USD MILLION)
TABLE 63 INDONESIA EGGS MARKET, BY TYPE, 2018-2032 (USD MILLION)
TABLE 64 INDONESIA EGGS MARKET, BY TYPE, 2018-2032
TABLE 65 INDONESIA SHELL EGGS IN EGGS MARKET, BY SUB-TYPE, 2018-2032 (USD MILLION)
TABLE 66 INDONESIA SHELL EGGS IN EGGS MARKET, BY SUB-TYPE, 2018-2032 (MILLION UNITS)
TABLE 67 INDONESIA SHELL EGGS IN EGGS MARKET, BY SUB-TYPE, 2018-2032 (USD/UNIT)
TABLE 68 INDONESIA CAGED IN EGGS MARKET, BY EGG, 2018-2032 (USD MILLION)
TABLE 69 INDONESIA CAGED-FREE IN EGGS MARKET, BY EGG, 2018-2032 (USD MILLION)
TABLE 70 INDONESIA PROCESSED EGGS IN EGGS MARKET, BY SUB-TYPE, 2018-2032 (USD MILLION)
TABLE 71 INDONESIA PROCESSED EGGS IN EGGS MARKET, BY SUB-TYPE, 2018-2032 (KILO TONS)
TABLE 72 INDONESIA PROCESSED EGGS IN EGGS MARKET, BY SUB-TYPE, 2018-2032 (USD/KG)
TABLE 73 INDONESIA EGG POWDER/DRIED EGGS IN EGGS MARKET, BY PRODUCT, 2018-2032 (USD MILLION)
TABLE 74 INDONESIA LIQUID EGGS IN EGGS MARKET, BY PRODUCT, 2018-2032 (USD MILLION)
TABLE 75 INDONESIA FROZEN EGGS IN EGGS MARKET, BY PRODUCT, 2018-2032 (USD MILLION)
TABLE 76 INDONESIA SPECIALTY EGGS IN EGGS MARKET, BY PRODUCT, 2018-2032 (USD MILLION)
TABLE 77 INDONESIA EGGS MARKET, BY END-USER, 2018-2032 (USD MILLION)
TABLE 78 INDONESIA EGGS MARKET, BY END-USER, 2018-2032 (MILLION UNITS/KILO TONS)
TABLE 79 INDONESIA FOOD SERVICE SECTOR IN EGGS MARKET, BY TYPE, 2018-2032 (USD MILLION)
TABLE 80 INDONESIA RESTAURANTS IN EGGS MARKET, BY TYPE, 2018-2032 (USD MILLION)
TABLE 81 INDONESIA CHAIN RESTAURANT IN EGGS MARKET, BY SERVICE TYPE, 2018-2032 (USD MILLION)
TABLE 82 INDONESIA FULL SERVICE RESTAURANTS IN EGGS MARKET, BY SERVICE TYPE, 2018-2032 (USD MILLION)
TABLE 83 INDONESIA EGGS MARKET, BY SOURCE, 2018-2032 (USD MILLION)
TABLE 84 INDONESIA EGGS MARKET, BY SOURCE, 2018-2032 (MILLION UNITS/KILO TONS)
TABLE 85 INDONESIA ANIMAL-BASED EGGS IN EGGS MARKET, BY CATEGORY, 2018-2032 (USD MILLION)
TABLE 86 INDONESIA PLANT-BASED EGGS IN EGGS MARKET, BY CATEGORY, 2018-2032 (USD MILLION)
TABLE 87 INDONESIA EGGS MARKET, BY NATURE, 2018-2032 (USD MILLION)
TABLE 88 INDONESIA EGGS MARKET, BY PACKAGING TYPE, 2018-2032 (USD MILLION)
TABLE 89 INDONESIA EGGS MARKET, BY SPECIALTY, 2018-2032 (USD MILLION)
TABLE 90 INDONESIA EGGS MARKET, BY DISTRIBUTION CHANNEL, 2018-2032 (USD MILLION)
TABLE 91 INDONESIA STORE BASED RETAILER IN EGGS MARKET, BY DISTRIBUTION CHANNEL, 2018-2032 (USD MILLION)
TABLE 92 VIETNAM EGGS MARKET, BY TYPE, 2018-2032 (USD MILLION)
TABLE 93 VIETNAM EGGS MARKET, BY TYPE, 2018-2032
TABLE 94 VIETNAM SHELL EGGS IN EGGS MARKET, BY SUB-TYPE, 2018-2032 (USD MILLION)
TABLE 95 VIETNAM SHELL EGGS IN EGGS MARKET, BY SUB-TYPE, 2018-2032 (MILLION UNITS)
TABLE 96 VIETNAM SHELL EGGS IN EGGS MARKET, BY SUB-TYPE, 2018-2032 (USD/UNIT)
TABLE 97 VIETNAM CAGED IN EGGS MARKET, BY EGG, 2018-2032 (USD MILLION)
TABLE 98 VIETNAM CAGED-FREE IN EGGS MARKET, BY EGG, 2018-2032 (USD MILLION)
TABLE 99 VIETNAM PROCESSED EGGS IN EGGS MARKET, BY SUB-TYPE, 2018-2032 (USD MILLION)
TABLE 100 VIETNAM PROCESSED EGGS IN EGGS MARKET, BY SUB-TYPE, 2018-2032 (KILO TONS)
TABLE 101 VIETNAM PROCESSED EGGS IN EGGS MARKET, BY SUB-TYPE, 2018-2032 (USD/KG)
TABLE 102 VIETNAM EGG POWDER/DRIED EGGS IN EGGS MARKET, BY PRODUCT, 2018-2032 (USD MILLION)
TABLE 103 VIETNAM LIQUID EGGS IN EGGS MARKET, BY PRODUCT, 2018-2032 (USD MILLION)
TABLE 104 VIETNAM FROZEN EGGS IN EGGS MARKET, BY PRODUCT, 2018-2032 (USD MILLION)
TABLE 105 VIETNAM SPECIALTY EGGS IN EGGS MARKET, BY PRODUCT, 2018-2032 (USD MILLION)
TABLE 106 VIETNAM EGGS MARKET, BY END-USER, 2018-2032 (USD MILLION)
TABLE 107 VIETNAM EGGS MARKET, BY END-USER, 2018-2032 (MILLION UNITS/KILO TONS)
TABLE 108 VIETNAM FOOD SERVICE SECTOR IN EGGS MARKET, BY TYPE, 2018-2032 (USD MILLION)
TABLE 109 VIETNAM RESTAURANTS IN EGGS MARKET, BY TYPE, 2018-2032 (USD MILLION)
TABLE 110 VIETNAM CHAIN RESTAURANT IN EGGS MARKET, BY SERVICE TYPE, 2018-2032 (USD MILLION)
TABLE 111 VIETNAM FULL SERVICE RESTAURANTS IN EGGS MARKET, BY SERVICE TYPE, 2018-2032 (USD MILLION)
TABLE 112 VIETNAM EGGS MARKET, BY SOURCE, 2018-2032 (USD MILLION)
TABLE 113 VIETNAM EGGS MARKET, BY SOURCE, 2018-2032 (MILLION UNITS/KILO TONS)
TABLE 114 VIETNAM ANIMAL-BASED EGGS IN EGGS MARKET, BY CATEGORY, 2018-2032 (USD MILLION)
TABLE 115 VIETNAM PLANT-BASED EGGS IN EGGS MARKET, BY CATEGORY, 2018-2032 (USD MILLION)
TABLE 116 VIETNAM EGGS MARKET, BY NATURE, 2018-2032 (USD MILLION)
TABLE 117 VIETNAM EGGS MARKET, BY PACKAGING TYPE, 2018-2032 (USD MILLION)
TABLE 118 VIETNAM EGGS MARKET, BY SPECIALTY, 2018-2032 (USD MILLION)
TABLE 119 VIETNAM EGGS MARKET, BY DISTRIBUTION CHANNEL, 2018-2032 (USD MILLION)
TABLE 120 VIETNAM STORE BASED RETAILER IN EGGS MARKET, BY DISTRIBUTION CHANNEL, 2018-2032 (USD MILLION)
TABLE 121 THAILAND EGGS MARKET, BY TYPE, 2018-2032 (USD MILLION)
TABLE 122 THAILAND EGGS MARKET, BY TYPE, 2018-2032
TABLE 123 THAILAND SHELL EGGS IN EGGS MARKET, BY SUB-TYPE, 2018-2032 (USD MILLION)
TABLE 124 THAILAND SHELL EGGS IN EGGS MARKET, BY SUB-TYPE, 2018-2032 (MILLION UNITS)
TABLE 125 THAILAND SHELL EGGS IN EGGS MARKET, BY SUB-TYPE, 2018-2032 (USD/UNIT)
TABLE 126 THAILAND CAGED IN EGGS MARKET, BY EGG, 2018-2032 (USD MILLION)
TABLE 127 THAILAND CAGED-FREE IN EGGS MARKET, BY EGG, 2018-2032 (USD MILLION)
TABLE 128 THAILAND PROCESSED EGGS IN EGGS MARKET, BY SUB-TYPE, 2018-2032 (USD MILLION)
TABLE 129 THAILAND PROCESSED EGGS IN EGGS MARKET, BY SUB-TYPE, 2018-2032 (KILO TONS)
TABLE 130 THAILAND PROCESSED EGGS IN EGGS MARKET, BY SUB-TYPE, 2018-2032 (USD/KG)
TABLE 131 THAILAND EGG POWDER/DRIED EGGS IN EGGS MARKET, BY PRODUCT, 2018-2032 (USD MILLION)
TABLE 132 THAILAND LIQUID EGGS IN EGGS MARKET, BY PRODUCT, 2018-2032 (USD MILLION)
TABLE 133 THAILAND FROZEN EGGS IN EGGS MARKET, BY PRODUCT, 2018-2032 (USD MILLION)
TABLE 134 THAILAND SPECIALTY EGGS IN EGGS MARKET, BY PRODUCT, 2018-2032 (USD MILLION)
TABLE 135 THAILAND EGGS MARKET, BY END-USER, 2018-2032 (USD MILLION)
TABLE 136 THAILAND EGGS MARKET, BY END-USER, 2018-2032 (MILLION UNITS/KILO TONS)
TABLE 137 THAILAND FOOD SERVICE SECTOR IN EGGS MARKET, BY TYPE, 2018-2032 (USD MILLION)
TABLE 138 THAILAND RESTAURANTS IN EGGS MARKET, BY TYPE, 2018-2032 (USD MILLION)
TABLE 139 THAILAND CHAIN RESTAURANT IN EGGS MARKET, BY SERVICE TYPE, 2018-2032 (USD MILLION)
TABLE 140 THAILAND FULL SERVICE RESTAURANTS IN EGGS MARKET, BY SERVICE TYPE, 2018-2032 (USD MILLION)
TABLE 141 THAILAND EGGS MARKET, BY SOURCE, 2018-2032 (USD MILLION)
TABLE 142 THAILAND EGGS MARKET, BY SOURCE, 2018-2032 (MILLION UNITS/KILO TONS)
TABLE 143 THAILAND ANIMAL-BASED EGGS IN EGGS MARKET, BY CATEGORY, 2018-2032 (USD MILLION)
TABLE 144 THAILAND PLANT-BASED EGGS IN EGGS MARKET, BY CATEGORY, 2018-2032 (USD MILLION)
TABLE 145 THAILAND EGGS MARKET, BY NATURE, 2018-2032 (USD MILLION)
TABLE 146 THAILAND EGGS MARKET, BY PACKAGING TYPE, 2018-2032 (USD MILLION)
TABLE 147 THAILAND EGGS MARKET, BY SPECIALTY, 2018-2032 (USD MILLION)
TABLE 148 THAILAND EGGS MARKET, BY DISTRIBUTION CHANNEL, 2018-2032 (USD MILLION)
TABLE 149 THAILAND STORE BASED RETAILER IN EGGS MARKET, BY DISTRIBUTION CHANNEL, 2018-2032 (USD MILLION)
TABLE 150 MYANMAR EGGS MARKET, BY TYPE, 2018-2032 (USD MILLION)
TABLE 151 MYANMAR EGGS MARKET, BY TYPE, 2018-2032
TABLE 152 MYANMAR SHELL EGGS IN EGGS MARKET, BY SUB-TYPE, 2018-2032 (USD MILLION)
TABLE 153 MYANMAR SHELL EGGS IN EGGS MARKET, BY SUB-TYPE, 2018-2032 (MILLION UNITS)
TABLE 154 MYANMAR SHELL EGGS IN EGGS MARKET, BY SUB-TYPE, 2018-2032 (USD/UNIT)
TABLE 155 MYANMAR CAGED IN EGGS MARKET, BY EGG, 2018-2032 (USD MILLION)
TABLE 156 MYANMAR CAGED-FREE IN EGGS MARKET, BY EGG, 2018-2032 (USD MILLION)
TABLE 157 MYANMAR PROCESSED EGGS IN EGGS MARKET, BY SUB-TYPE, 2018-2032 (USD MILLION)
TABLE 158 MYANMAR PROCESSED EGGS IN EGGS MARKET, BY SUB-TYPE, 2018-2032 (KILO TONS)
TABLE 159 MYANMAR PROCESSED EGGS IN EGGS MARKET, BY SUB-TYPE, 2018-2032 (USD/KG)
TABLE 160 MYANMAR EGG POWDER/DRIED EGGS IN EGGS MARKET, BY PRODUCT, 2018-2032 (USD MILLION)
TABLE 161 MYANMAR LIQUID EGGS IN EGGS MARKET, BY PRODUCT, 2018-2032 (USD MILLION)
TABLE 162 MYANMAR FROZEN EGGS IN EGGS MARKET, BY PRODUCT, 2018-2032 (USD MILLION)
TABLE 163 MYANMAR SPECIALTY EGGS IN EGGS MARKET, BY PRODUCT, 2018-2032 (USD MILLION)
TABLE 164 MYANMAR EGGS MARKET, BY END-USER, 2018-2032 (USD MILLION)
TABLE 165 MYANMAR EGGS MARKET, BY END-USER, 2018-2032 (MILLION UNITS/KILO TONS)
TABLE 166 MYANMAR FOOD SERVICE SECTOR IN EGGS MARKET, BY TYPE, 2018-2032 (USD MILLION)
TABLE 167 MYANMAR RESTAURANTS IN EGGS MARKET, BY TYPE, 2018-2032 (USD MILLION)
TABLE 168 MYANMAR CHAIN RESTAURANT IN EGGS MARKET, BY SERVICE TYPE, 2018-2032 (USD MILLION)
TABLE 169 MYANMAR FULL SERVICE RESTAURANTS IN EGGS MARKET, BY SERVICE TYPE, 2018-2032 (USD MILLION)
TABLE 170 MYANMAR EGGS MARKET, BY SOURCE, 2018-2032 (USD MILLION)
TABLE 171 MYANMAR EGGS MARKET, BY SOURCE, 2018-2032 (MILLION UNITS/KILO TONS)
TABLE 172 MYANMAR ANIMAL-BASED EGGS IN EGGS MARKET, BY CATEGORY, 2018-2032 (USD MILLION)
TABLE 173 MYANMAR PLANT-BASED EGGS IN EGGS MARKET, BY CATEGORY, 2018-2032 (USD MILLION)
TABLE 174 MYANMAR EGGS MARKET, BY NATURE, 2018-2032 (USD MILLION)
TABLE 175 MYANMAR EGGS MARKET, BY PACKAGING TYPE, 2018-2032 (USD MILLION)
TABLE 176 MYANMAR EGGS MARKET, BY SPECIALTY, 2018-2032 (USD MILLION)
TABLE 177 MYANMAR EGGS MARKET, BY DISTRIBUTION CHANNEL, 2018-2032 (USD MILLION)
TABLE 178 MYANMAR STORE BASED RETAILER IN EGGS MARKET, BY DISTRIBUTION CHANNEL, 2018-2032 (USD MILLION)
TABLE 179 TAIWAN EGGS MARKET, BY TYPE, 2018-2032 (USD MILLION)
TABLE 180 TAIWAN EGGS MARKET, BY TYPE, 2018-2032
TABLE 181 TAIWAN SHELL EGGS IN EGGS MARKET, BY SUB-TYPE, 2018-2032 (USD MILLION)
TABLE 182 TAIWAN SHELL EGGS IN EGGS MARKET, BY SUB-TYPE, 2018-2032 (MILLION UNITS)
TABLE 183 TAIWAN SHELL EGGS IN EGGS MARKET, BY SUB-TYPE, 2018-2032 (USD/UNIT)
TABLE 184 TAIWAN CAGED IN EGGS MARKET, BY EGG, 2018-2032 (USD MILLION)
TABLE 185 TAIWAN CAGED-FREE IN EGGS MARKET, BY EGG, 2018-2032 (USD MILLION)
TABLE 186 TAIWAN PROCESSED EGGS IN EGGS MARKET, BY SUB-TYPE, 2018-2032 (USD MILLION)
TABLE 187 TAIWAN PROCESSED EGGS IN EGGS MARKET, BY SUB-TYPE, 2018-2032 (KILO TONS)
TABLE 188 TAIWAN PROCESSED EGGS IN EGGS MARKET, BY SUB-TYPE, 2018-2032 (USD/KG)
TABLE 189 TAIWAN EGG POWDER/DRIED EGGS IN EGGS MARKET, BY PRODUCT, 2018-2032 (USD MILLION)
TABLE 190 TAIWAN LIQUID EGGS IN EGGS MARKET, BY PRODUCT, 2018-2032 (USD MILLION)
TABLE 191 TAIWAN FROZEN EGGS IN EGGS MARKET, BY PRODUCT, 2018-2032 (USD MILLION)
TABLE 192 TAIWAN SPECIALTY EGGS IN EGGS MARKET, BY PRODUCT, 2018-2032 (USD MILLION)
TABLE 193 TAIWAN EGGS MARKET, BY END-USER, 2018-2032 (USD MILLION)
TABLE 194 TAIWAN EGGS MARKET, BY END-USER, 2018-2032 (MILLION UNITS/KILO TONS)
TABLE 195 TAIWAN FOOD SERVICE SECTOR IN EGGS MARKET, BY TYPE, 2018-2032 (USD MILLION)
TABLE 196 TAIWAN RESTAURANTS IN EGGS MARKET, BY TYPE, 2018-2032 (USD MILLION)
TABLE 197 TAIWAN CHAIN RESTAURANT IN EGGS MARKET, BY SERVICE TYPE, 2018-2032 (USD MILLION)
TABLE 198 TAIWAN FULL SERVICE RESTAURANTS IN EGGS MARKET, BY SERVICE TYPE, 2018-2032 (USD MILLION)
TABLE 199 TAIWAN EGGS MARKET, BY SOURCE, 2018-2032 (USD MILLION)
TABLE 200 TAIWAN EGGS MARKET, BY SOURCE, 2018-2032 (MILLION UNITS/KILO TONS)
TABLE 201 TAIWAN ANIMAL-BASED EGGS IN EGGS MARKET, BY CATEGORY, 2018-2032 (USD MILLION)
TABLE 202 TAIWAN PLANT-BASED EGGS IN EGGS MARKET, BY CATEGORY, 2018-2032 (USD MILLION)
TABLE 203 TAIWAN EGGS MARKET, BY NATURE, 2018-2032 (USD MILLION)
TABLE 204 TAIWAN EGGS MARKET, BY PACKAGING TYPE, 2018-2032 (USD MILLION)
TABLE 205 TAIWAN EGGS MARKET, BY SPECIALTY, 2018-2032 (USD MILLION)
TABLE 206 TAIWAN EGGS MARKET, BY DISTRIBUTION CHANNEL, 2018-2032 (USD MILLION)
TABLE 207 TAIWAN STORE BASED RETAILER IN EGGS MARKET, BY DISTRIBUTION CHANNEL, 2018-2032 (USD MILLION)
TABLE 208 SINGAPORE EGGS MARKET, BY TYPE, 2018-2032 (USD MILLION)
TABLE 209 SINGAPORE EGGS MARKET, BY TYPE, 2018-2032
TABLE 210 SINGAPORE SHELL EGGS IN EGGS MARKET, BY SUB-TYPE, 2018-2032 (USD MILLION)
TABLE 211 SINGAPORE SHELL EGGS IN EGGS MARKET, BY SUB-TYPE, 2018-2032 (MILLION UNITS)
TABLE 212 SINGAPORE SHELL EGGS IN EGGS MARKET, BY SUB-TYPE, 2018-2032 (USD/UNIT)
TABLE 213 SINGAPORE CAGED IN EGGS MARKET, BY EGG, 2018-2032 (USD MILLION)
TABLE 214 SINGAPORE CAGED-FREE IN EGGS MARKET, BY EGG, 2018-2032 (USD MILLION)
TABLE 215 SINGAPORE PROCESSED EGGS IN EGGS MARKET, BY SUB-TYPE, 2018-2032 (USD MILLION)
TABLE 216 SINGAPORE PROCESSED EGGS IN EGGS MARKET, BY SUB-TYPE, 2018-2032 (KILO TONS)
TABLE 217 SINGAPORE PROCESSED EGGS IN EGGS MARKET, BY SUB-TYPE, 2018-2032 (USD/KG)
TABLE 218 SINGAPORE EGG POWDER/DRIED EGGS IN EGGS MARKET, BY PRODUCT, 2018-2032 (USD MILLION)
TABLE 219 SINGAPORE LIQUID EGGS IN EGGS MARKET, BY PRODUCT, 2018-2032 (USD MILLION)
TABLE 220 SINGAPORE FROZEN EGGS IN EGGS MARKET, BY PRODUCT, 2018-2032 (USD MILLION)
TABLE 221 SINGAPORE SPECIALTY EGGS IN EGGS MARKET, BY PRODUCT, 2018-2032 (USD MILLION)
TABLE 222 SINGAPORE EGGS MARKET, BY END-USER, 2018-2032 (USD MILLION)
TABLE 223 SINGAPORE EGGS MARKET, BY END-USER, 2018-2032 (MILLION UNITS/KILO TONS)
TABLE 224 SINGAPORE FOOD SERVICE SECTOR IN EGGS MARKET, BY TYPE, 2018-2032 (USD MILLION)
TABLE 225 SINGAPORE RESTAURANTS IN EGGS MARKET, BY TYPE, 2018-2032 (USD MILLION)
TABLE 226 SINGAPORE CHAIN RESTAURANT IN EGGS MARKET, BY SERVICE TYPE, 2018-2032 (USD MILLION)
TABLE 227 SINGAPORE FULL SERVICE RESTAURANTS IN EGGS MARKET, BY SERVICE TYPE, 2018-2032 (USD MILLION)
TABLE 228 SINGAPORE EGGS MARKET, BY SOURCE, 2018-2032 (USD MILLION)
TABLE 229 SINGAPORE EGGS MARKET, BY SOURCE, 2018-2032 (MILLION UNITS/KILO TONS)
TABLE 230 SINGAPORE ANIMAL-BASED EGGS IN EGGS MARKET, BY CATEGORY, 2018-2032 (USD MILLION)
TABLE 231 SINGAPORE PLANT-BASED EGGS IN EGGS MARKET, BY CATEGORY, 2018-2032 (USD MILLION)
TABLE 232 SINGAPORE EGGS MARKET, BY NATURE, 2018-2032 (USD MILLION)
TABLE 233 SINGAPORE EGGS MARKET, BY PACKAGING TYPE, 2018-2032 (USD MILLION)
TABLE 234 SINGAPORE EGGS MARKET, BY SPECIALTY, 2018-2032 (USD MILLION)
TABLE 235 SINGAPORE EGGS MARKET, BY DISTRIBUTION CHANNEL, 2018-2032 (USD MILLION)…
TABLE 236 SINGAPORE STORE BASED RETAILER IN EGGS MARKET, BY DISTRIBUTION CHANNEL, 2018-2032 (USD MILLION)
Asia Eggs Market, Supply Chain Analysis and Ecosystem Framework
To support market growth and help clients navigate the impact of geopolitical shifts, DBMR has integrated in-depth supply chain analysis into its Asia Eggs Market research reports. This addition empowers clients to respond effectively to global changes affecting their industries. The supply chain analysis section includes detailed insights such as Asia Eggs Market consumption and production by country, price trend analysis, the impact of tariffs and geopolitical developments, and import and export trends by country and HSN code. It also highlights major suppliers with data on production capacity and company profiles, as well as key importers and exporters. In addition to research, DBMR offers specialized supply chain consulting services backed by over a decade of experience, providing solutions like supplier discovery, supplier risk assessment, price trend analysis, impact evaluation of inflation and trade route changes, and comprehensive market trend analysis.
Data collection and base year analysis are done using data collection modules with large sample sizes. The stage includes obtaining market information or related data through various sources and strategies. It includes examining and planning all the data acquired from the past in advance. It likewise envelops the examination of information inconsistencies seen across different information sources. The market data is analysed and estimated using market statistical and coherent models. Also, market share analysis and key trend analysis are the major success factors in the market report. To know more, please request an analyst call or drop down your inquiry.
The key research methodology used by DBMR research team is data triangulation which involves data mining, analysis of the impact of data variables on the market and primary (industry expert) validation. Data models include Vendor Positioning Grid, Market Time Line Analysis, Market Overview and Guide, Company Positioning Grid, Patent Analysis, Pricing Analysis, Company Market Share Analysis, Standards of Measurement, Global versus Regional and Vendor Share Analysis. To know more about the research methodology, drop in an inquiry to speak to our industry experts.
Data Bridge Market Research is a leader in advanced formative research. We take pride in servicing our existing and new customers with data and analysis that match and suits their goal. The report can be customized to include price trend analysis of target brands understanding the market for additional countries (ask for the list of countries), clinical trial results data, literature review, refurbished market and product base analysis. Market analysis of target competitors can be analyzed from technology-based analysis to market portfolio strategies. We can add as many competitors that you require data about in the format and data style you are looking for. Our team of analysts can also provide you data in crude raw excel files pivot tables (Fact book) or can assist you in creating presentations from the data sets available in the report.


