
Asia-Pacific 2D Display for Defense and Aerospace Market Analysis and Size
The 2D display market for aerospace and defense is a specialized market that provides displays for military and commercial aerospace applications. Displays used in this market must meet stringent reliability, performance, and durability requirements and comply with various regulatory standards. The market for 2D displays for aerospace and defense is expected to experience steady growth in the coming years, driven by increasing demand for advanced display technologies, the growth of the aerospace and defense industry, and the need for improved situational awareness and communication capabilities in military and commercial aviation. The emergence of new technologies, such as high-resolution displays, touch screens, and augmented reality displays, is also expected to drive growth in this market.
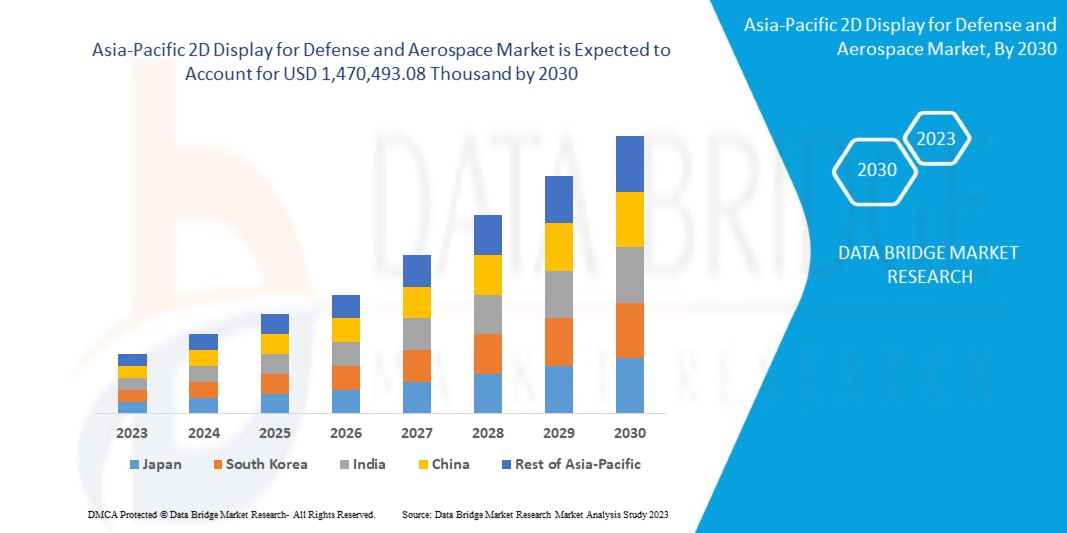
Data Bridge Market Research analyses that the Asia-Pacific 2D display for the defense and aerospace market is expected to reach a value of USD 1,470,493.08 thousand by 2030, at a CAGR of 5.9% during the forecast period. Asia-Pacific 2D display for defense and aerospace market report also comprehensively covers pricing analysis, patent analysis, and technological advancements.
|
Report Metric |
Details |
|
Forecast Period |
2023 to 2030 |
|
Base Year |
2022 |
|
Historic Years |
2021 (Customisable to 2015-2020) |
|
Quantitative Units |
Revenue in USD Thousand, Pricing in USD |
|
Segments Covered |
By Display Technology (Liquid Crystal Displays (LCD), Light Emitting Diode (LED), Organic LED (OLED), Micro-LED, Others), Type (Touch, Non-Touch), Resolution (Full HD, HD, 4K, Others), Panel Size (5 Inches to 10 Inches, Greater Than 10 Inches, Less Than 5 Inches), Display Type (Conventional Display, Smart Display), Sales Channel (OEMS, Retailer), Application (Aerospace, Defense) |
|
Regions Covered |
China, Japan, South Korea, India, Australia, New Zealand, Singapore, Taiwan, Malaysia, Thailand, Indonesia, Philippines, Vietnam, and Rest of Asia-Pacific |
|
Market Players Covered |
Astronautics Corporation of America, FDS Avionics Corp., ScioTeq, Excelitas Technologies Corp., DIEHL STIFTUNG & CO. KG, US Micro Products, Honeywell International Inc., Barco, BAE Systems, Thales, Garmin Ltd., WINMATE INC, Collins Aerospace, D&T Inc, and Elbit Systems Ltd., among others. |
Market Definition
A display device is an output device for presenting information in visual or tactile form. When the supplied input information has an electrical signal, the display is called an electronic display. A 2D-head-mounted display (HMD) is a display device worn on the head or as part of a helmet that has a small display optic in front of one (monocular HMD) or each eye (binocular HMD). An HMD has many uses, including gaming, aviation, engineering, and medicine. Virtual reality headsets are HMDs combined with IMUs. There is also an optical head-mounted display (OHMD), a wearable display that can reflect projected images and allow a user to see through it.
Asia-Pacific 2D Display for Defense and Aerospace Market Dynamics
This section deals with understanding the market drivers, advantages, opportunities, restraints, and challenges. All of this is discussed in detail below:
DRIVERS
- GROWTH IN THE MILITARY MODERNIZATION PROGRAMS ACROSS THE GLOBE
Military modernization is updating and improving a nation's military capabilities and equipment to meet current, and future security challenges better. It involves acquiring new weapons systems, technologies, and infrastructure, as well as the development of new strategies and doctrines. Military modernization is important for a nation as it helps maintain a credible deterrence capability against potential adversaries, enhances military readiness and effectiveness, and ensures the military can perform its assigned roles and missions. As nations across the globe are increasing their respective defense budgets, the number of military modernization programs is also increasing.
- GROWTH IN THE DEMAND FOR ADVANCED DISPLAY TECHNOLOGIES
The defense of government across the globe and the aerospace industry requires advanced displays that can provide high-resolution images, real-time information, and enhanced situational awareness to pilots and soldiers. As such, there is a growing demand for 2D displays that can meet these requirements.
OPPORTUNITY
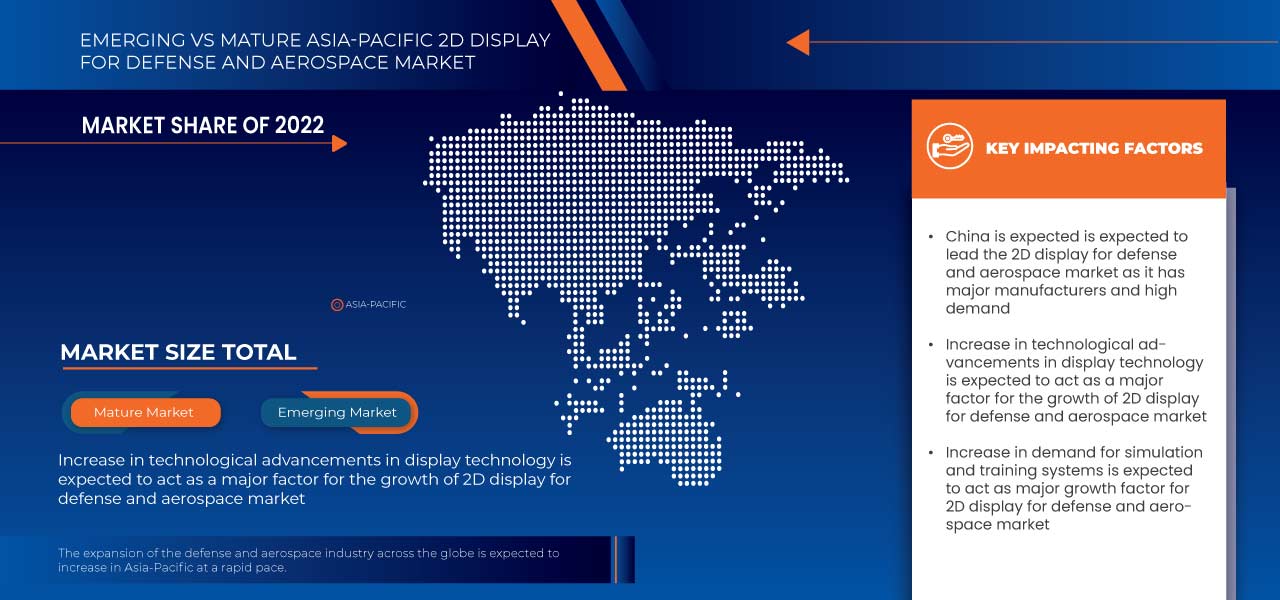
- INCREASE IN DEMAND FOR SIMULATION AND TRAINING SYSTEMS
Simulation and training systems in the defense and aerospace industry are tools and technologies used to simulate real-world scenarios and train military personnel and pilots. These systems can simulate various scenarios, from routine operations to complex battlefield scenarios, and allow military personnel to train and hone their skills in a safe, controlled environment. The importance of simulation and training systems in the defense and aerospace industry cannot be overstated. These systems help to ensure that military personnel is well-trained and prepared for any situation they may encounter. In addition, they help reduce the risk of accidents or mishaps during training exercises or missions.
RESTRAINTS/CHALLENGES
- STRINGENT GOVERNMENT REGULATIONS
Stringent government regulations are expected to restrain the Asia-Pacific 2d display for the defense and aerospace market by creating obstacles in the procurement and use of certain 2d display technologies. These regulations are put in place to ensure that the technologies being used in the defense and aerospace industry meet certain safety and security standards
- HIGH TECHNOLOGICAL OBSOLESCENCE IN THE DEFENSE AND AEROSPACE SECTOR
Technological obsolescence refers to the state of being outdated due to technological advancements. This means that technology, product, or service that was once popular and in high demand may become irrelevant and unusable as newer and more advanced technologies are developed and widely available. In the market context, technological obsolescence can occur when the 2d display technology used in defense and aerospace becomes outdated and is replaced by newer and more advanced technologies, leading to a decline in demand for the older technology. This is a challenge in the defense and aerospace industry, where the technology needs to be constantly updated and improved to keep up with the changing needs and requirements of the military. In the case of 2D displays for defense and aerospace, technological obsolescence can limit the market's growth in several ways.
Post-COVID-19 Impact on Asia-Pacific 2D Display for Defense and Aerospace Market
The COVID-19 pandemic has significantly impacted the aerospace and defense industry, including the market for 2D displays. The pandemic has led to a decline in air travel and a reduction in defense spending, which has impacted demand for 2D displays used in aircraft and defense applications. One of the major impacts of the pandemic has been disruptions in the Asia-Pacific supply chain, which have led to shortages of raw materials and components used in the manufacturing of 2D displays. This has caused delays in the production and delivery of displays, which has impacted the ability of aerospace and defense companies to complete their projects on time. The pandemic has also resulted in a decline in demand for commercial aircraft, which has affected the demand for 2D displays used in cockpit displays and other applications. Additionally, the reduction in defense spending has led to a slowdown in military procurement, which has impacted the demand for displays used in military applications.
Recent Developments
- In March 2022, Nighthawk Flight Systems, Inc. announced that the company had earned AS9100/ISO9001 certificate. This certification has allowed the company to design and manufacture compact integrated display systems. Which is used for general aviation, business aviation, military, air transport, and regional aircraft under Asia-Pacific 2D display for the defense and aerospace market
- In August 2020, Aspen Avionics, Inc. announced that the company has agreed with the AIRO group of aerospace companies. This step has expanded the company's investments and resources and increased its technologies in not only avionics for general aviation but also to offer avionics products for manned and unmanned flight platforms for commercial, military, robotics, and multi-modal aircraft under Asia-Pacific 2D display for defense and aerospace market
Asia-Pacific 2D Display for Defense and Aerospace Market Scope
Asia-Pacific 2D display for defense and aerospace market is segmented based on display technology, type, resolution, panel size, display type, sales channel, and application. The growth amongst these segments will help you analyze meager growth segments in the industries and provide the users with a valuable market overview and insights to help them make strategic decisions for identifying core market applications.
By Display Technology
- Liquid Crystal Displays (LCD)
- Light Emitting Diode (LED)
- Organic LED (OLED)
- Micro-LED
- Others
On the basis of display technology, the Asia-Pacific 2D display for defense and aerospace market is segmented into liquid crystal displays (LCD), light emitting diode (LED), organic LED (OLED), micro-LED, and others.
By Type
- Touch
- Non-Touch
On the basis of type, the Asia-Pacific 2D display for defense and aerospace market is segmented into touch and non-touch.
By Resolution
- Full HD
- HD
- 4K
- Others
On the basis of resolution, the Asia-Pacific 2D display for defense and aerospace market is segmented into full HD, HD, 4K, and others.
By Panel Size
- 5 Inches to 10 Inches
- Greater Than 10 Inches
- Less Than 5 Inches
On the basis of panel size, the Asia-Pacific 2D display for defense and aerospace market is segmented into 5 inches to 10 inches, greater than 10 inches, and less than 5 inches.
By Display Type
- Conventional Display
- Smart Display
On the basis of display type, the Asia-Pacific 2D display for defense and aerospace market is segmented into conventional display and smart display.
By Sales Channel
- OEMS
- Retailer
On the basis of sales channel, the Asia-Pacific 2D display for defense and aerospace market is segmented into OEMS and retailer.
By Application
- Aerospace
- Defense
On the basis of application, the Asia-Pacific 2D display for defense and aerospace market is segmented into aerospace and defense
Asia-Pacific 2D Display for Defense and Aerospace Market Regional Analysis/Insights
Asia-Pacific 2D display for defense and aerospace market is analyzed. As referenced above, market size insights and trends are provided by region, display technology, type, resolution, panel size, display type, sales channel, and application.
The countries covered in the Asia-Pacific 2D display for defense and aerospace market report are China, Japan, South Korea, India, Australia, New Zealand, Singapore, Taiwan, Malaysia, Thailand, Indonesia, Philippines, Vietnam, and the rest of Asia-Pacific.
China dominates in the Asia-Pacific region as it has witnessed increased defense budgets and investments in aerospace and defense technology.
The region section of the report also provides individual market-impacting factors and market regulation changes that impact the market's current and future trends. Data points like downstream and upstream value chain analysis, technical trends, porter's five forces analysis, and case studies are some pointers used to forecast the market scenario for individual countries. Also, the presence and availability of Asia-Pacific brands and their challenges faced due to large or scarce competition from local and domestic brands, the impact of domestic tariffs, and trade routes are considered while providing forecast analysis of the region data.
Competitive Landscape and Asia-Pacific 2D Display for Defense and Aerospace Market Share Analysis
Asia-Pacific 2D display for defense and aerospace market competitive landscape provides details by the competitor. Details included are company overview, company financials, revenue generated, market potential, investment in research and development, new market initiatives, Asia-Pacific presence, production sites and facilities, production capacities, company strengths and weaknesses, product launch, product width and breadth, and application dominance. The above data points only relate to the companies' focus on Asia-Pacific 2D display for defense and aerospace market.
Some of the major players operating in the Asia-Pacific 2D display for defense and aerospace market are Astronautics Corporation of America, FDS Avionics Corp., ScioTeq, Excelitas Technologies Corp., DIEHL STIFTUNG & CO. KG, US Micro Products, Honeywell International Inc., Barco, BAE Systems, Thales, Garmin Ltd., WINMATE INC, Collins Aerospace, D&T Inc, and Elbit Systems Ltd., among others.
SKU-

- Interactive Data Analysis Dashboard
- Company Analysis Dashboard for high growth potential opportunities
- Research Analyst Access for customization & queries
- Competitor Analysis with Interactive dashboard
- Latest News, Updates & Trend analysis
- Harness the Power of Benchmark Analysis for Comprehensive Competitor Tracking
Table of Content
1 INTRODUCTION
1.1 OBJECTIVES OF THE STUDY
1.2 MARKET DEFINITION
1.3 OVERVIEW OF THE ASIA PACIFIC 2D DISPLAY FOR DEFENSE AND AEROSPACE MARKET
1.4 CURRENCY AND PRICING
1.5 LIMITATIONS
1.6 MARKETS COVERED
2 MARKET SEGMENTATION
2.1 MARKETS COVERED
2.2 YEARS CONSIDERED FOR THE STUDY
2.3 GEOGRAPHIC SCOPE
2.4 DBMR TRIPOD DATA VALIDATION MODEL
2.5 PRIMARY INTERVIEWS WITH KEY OPINION LEADERS
2.6 DBMR MARKET POSITION GRID
2.7 VENDOR SHARE ANALYSIS
2.8 MULTIVARIATE MODELLING
2.9 COMPONENT CURVE
2.1 MARKET CHALLENGE MATRIX
2.11 MARKET APPLICATION COVERAGE GRID
2.12 SECONDARY SOURCES
2.13 ASSUMPTIONS
3 EXECUTIVE SUMMARY
4 PREMIUM INSIGHTS
4.1 PORTER’S FIVE FORCES
4.2 TECHNOLOGICAL TRENDS
4.3 COMPANY COMPARATIVE ANALYSIS
4.4 VALUE CHAIN ANALYSIS
4.5 PATENT ANALYSIS
4.6 CASE STUDY
4.7 REGULATORY STANDARDS
5 MARKET OVERVIEW
5.1 DRIVERS
5.1.1 GROWING MILITARY MODERNIZATION PROGRAMS ACROSS THE GLOBE
5.1.2 GROWING DEMAND FOR ADVANCED DISPLAY TECHNOLOGIES
5.1.3 EMERGING REQUIREMENTS OF ENHANCED COMMUNICATION SYSTEMS
5.1.4 INCREASE IN TECHNOLOGICAL ADVANCEMENTS IN DISPLAY TECHNOLOGY
5.2 RESTRAINTS
5.2.1 HIGH DEVELOPMENT AND MANUFACTURING COSTS ASSOCIATED WITH ADVANCED 2D DISPLAYS
5.2.2 STRINGENT GOVERNMENT REGULATIONS
5.3 OPPORTUNITIES
5.3.1 INCREASE IN DEMAND FOR SIMULATION AND TRAINING SYSTEMS
5.3.2 INCREASING PARTNERSHIP, ACQUISITION, AND COLLABORATION AMONG MARKET PLAYERS
5.3.3 RISE IN DEMAND FOR HEAD-MOUNTED DISPLAYS (HMDS)
5.3.4 EXPANSION OF THE DEFENSE AND AEROSPACE INDUSTRY ACROSS THE GLOBE
5.4 CHALLENGES
5.4.1 INTEGRATION CHALLENGES ASSOCIATED WITH ADVANCED 2D DISPLAYS
5.4.2 HIGH TECHNOLOGICAL OBSOLESCENCE IN DEFENCE AND AEROSPACE SECTOR
6 ASIA PACIFIC 2D DISPLAY FOR DEFENSE & AEROSPACE MARKET, BY TYPE
6.1 OVERVIEW
6.2 LIQUID CRYSTAL DISPLAYS (LCD)
6.3 LIGHT EMITTING DIODE (LED)
6.4 ORGANIC LED (OLED)
6.4.1 RIGID
6.4.2 FLEXIBLE
6.4.3 FOLDABLE
6.5 MICRO-LED
6.6 OTHERS
7 ASIA PACIFIC 2D DISPLAY FOR DEFENSE & AEROSPACE MARKET, BY TYPE
7.1 OVERVIEW
7.2 TOUCH
7.3 NON-TOUCH
8 ASIA PACIFIC 2D DISPLAY FOR DEFENSE & AEROSPACE MARKET, BY RESOLUTION
8.1 OVERVIEW
8.2 FULL HD
8.3 HD
8.4 4K
8.5 OTHERS
9 ASIA PACIFIC 2D DISPLAY FOR DEFENSE & AEROSPACE MARKET, BY PANEL SIZE
9.1 OVERVIEW
9.2 5 INCHES TO 10 INCHES
9.3 GREATER THAN 10 INCHES
9.4 LESS THAN 5 INCHES
10 ASIA PACIFIC 2D DISPLAY FOR DEFENSE & AEROSPACE MARKET, BY DISPLAY TYPE
10.1 OVERVIEW
10.2 CONVENTIONAL DISPLAY
10.3 SMART DISPLAY
11 ASIA PACIFIC 2D DISPLAY FOR DEFENSE & AEROSPACE MARKET, BY SALES CHANNEL
11.1 OVERVIEW
11.2 OEMS
11.3 RETAIL
12 ASIA PACIFIC 2D DISPLAY FOR DEFENSE & AEROSPACE MARKET, BY APPLICATION
12.1 OVERVIEW
12.2 AEROSPACE
12.2.1 BY TYPE
12.2.1.1 PRIMARY FLIGHT DISPLAY
12.2.1.2 MULTI-FUNCTIONAL DISPLAY
12.2.1.3 BACKUP DISPLAY
12.2.1.4 MISSION DISPLAY
12.2.2 BY TYPE
12.2.2.1 AIRCRAFT
12.2.2.2 HELICOPTERS
12.2.2.3 OTHERS
12.3 DEFENCE
12.3.1 BY TYPE
12.3.1.1 LAND
12.3.1.2 AIRBORNE
12.3.1.3 NAVAL
13 ASIA PACIFIC 2D DISPLAY FOR DEFENSE AND AEROSPACE MARKET, BY REGION
13.1 ASIA-PACIFIC
13.1.1 CHINA
13.1.2 INDIA
13.1.3 JAPAN
13.1.4 SOUTH KOREA
13.1.5 AUSTRALIA
13.1.6 SINGAPORE
13.1.7 TAIWAN
13.1.8 MALAYSIA
13.1.9 THAILAND
13.1.10 INDONESIA
13.1.11 PHILIPPINES
13.1.12 NEW ZEALAND
13.1.13 VIETNAM
13.1.14 REST OF ASIA-PACIFIC
14 ASIA PACIFIC 2D DISPLAY FOR DEFENSE AND AEROSPACE MARKET: COMPANY LANDSCAPE
14.1 COMPANY SHARE ANALYSIS: ASIA PACIFIC
15 SWOT ANALYSIS
16 COMPANY PROFILE
16.1 HONEYWELL INTERNATIONAL INC.
16.1.1 COMPANY SNAPSHOT
16.1.2 REVENUE ANALYSIS
16.1.3 COMPANY SHARE ANALYSIS
16.1.4 PRODUCTS PORTFOLIO
16.1.5 RECENT DEVELOPMENTS
16.2 THALES
16.2.1 COMPANY SNAPSHOT
16.2.2 REVENUE ANALYSIS
16.2.3 COMPANY SHARE ANALYSIS
16.2.4 SOLUTION PORTFOLIO
16.2.5 RECENT DEVELOPMENT
16.3 COLLINS AEROSPACE
16.3.1 COMPANY SNAPSHOT
16.3.2 REVENUE ANALYSIS
16.3.3 COMPANY SHARE ANALYSIS
16.3.4 SOLUTION PORTFOLIO
16.3.5 RECENT DEVELOPMENTS
16.4 EXCELITAS TECHNOLOGIES CORP.
16.4.1 COMPANY SNAPSHOT
16.4.2 COMPANY SHARE ANALYSIS
16.4.3 PRODUCTS PORTFOLIO
16.4.4 RECENT DEVELOPMENTS
16.5 BAE SYSTEMS
16.5.1 COMPANY SNAPSHOT
16.5.2 REVENUE ANALYSIS
16.5.3 COMPANY SHARE ANALYSIS
16.5.4 PRODUCTS PORTFOLIO
16.5.5 RECENT DEVELOPMENTS
16.6 ASPEN AVIONICS, INC.
16.6.1 COMPANY SNAPSHOT
16.6.2 PRODUCT PORTFOLIO
16.6.3 RECENT DEVELOPMENTS
16.7 ASTRONAUTICS CORPORATION OF AMERICA
16.7.1 COMPANY SNAPSHOT
16.7.2 PRODUCTS PORTFOLIO
16.7.3 RECENT DEVELOPMENTS
16.8 AVMAP SRL
16.8.1 COMPANY SNAPSHOT
16.8.2 PRODUCTS PORTFOLIO
16.8.3 RECENT DEVELOPMENT
16.9 BARCO
16.9.1 COMPANY SNAPSHOT
16.9.2 REVENUE ANALYSIS
16.9.3 SOLUTION PORTFOLIO
16.9.4 RECENT DEVELOPMENTS
16.1 DIEHL STIFTUNG & CO. KG
16.10.1 COMPANY SNAPSHOT
16.10.2 SOLUTION PORTFOLIO
16.10.3 RECENT DEVELOPMENT
16.11 D&T INC
16.11.1 COMPANY SNAPSHOT
16.11.2 SOLUTION PORTFOLIO
16.11.3 RECENT DEVELOPMENT
16.12 ELBIT SYSTEMS LTD.
16.12.1 COMPANY SNAPSHOT
16.12.2 REVENUE ANALYSIS
16.12.3 BUSINESS PORTFOLIO
16.12.4 RECENT DEVELOPMENTS
16.13 FDS AVIONICS CORP.
16.13.1 COMPANY SNAPSHOT
16.13.2 PRODUCTS PORTFOLIO
16.13.3 RECENT DEVELOPMENTS
16.14 GARMIN LTD.
16.14.1 COMPANY SNAPSHOT
16.14.2 REVENUE ANALYSIS
16.14.3 PRODUCT PORTFOLIO
16.14.4 RECENT DEVELOPMENT
16.15 KORRY
16.15.1 COMPANY SNAPSHOT
16.15.2 PRODUCTS PORTFOLIO
16.15.3 RECENT DEVELOPMENTS
16.16 MEGGIT PLC
16.16.1 COMPANY SNAPSHOT
16.16.2 REVENUE ANALYSIS
16.16.3 PRODUCTS PORTFOLIO
16.16.4 RECENT DEVELOPMENTS
16.17 NIGHTHAWK FLIGHT SYSTEMS, INC.
16.17.1 COMPANY SNAPSHOT
16.17.2 PRODUCT PORTFOLIO
16.17.3 RECENT DEVELOPMENT
16.18 ROSEN AVIATION.
16.18.1 COMPANY SNAPSHOT
16.18.2 PRODUCT PORTFOLIO
16.18.3 RECENT DEVELOPMENT
16.19 SCIOTEQ
16.19.1 COMPANY SNAPSHOT
16.19.2 PRODUCT PORTFOLIO
16.19.3 RECENT DEVELOPMENT
16.2 US MICRO PRODUCTS
16.20.1 COMPANY SNAPSHOT
16.20.2 PRODUCT PORTFOLIO
16.20.3 RECENT DEVELOPMENT
16.21 WINMATE INC.
16.21.1 COMPANY SNAPSHOT
16.21.2 REVENUE ANALYSIS
16.21.3 PRODUCT PORTFOLIO
16.21.4 RECENT DEVELOPMENTS
17 QUESTIONNAIRE
18 RELATED REPORTS
List of Table
TABLE 1 PATENT ANALYSIS
TABLE 2 REGULATORY STANDARDS
TABLE 3 ASIA PACIFIC 2D DISPLAY FOR DEFENSE & AEROSPACE MARKET, BY DISPLAY TECHNOLOGY, 2021-2030 (USD THOUSAND)
TABLE 4 ASIA PACIFIC LIQUID CRYSTAL DISPLAYS (LCD) IN 2D DISPLAY FOR DEFENSE AND AEROSPACE MARKET, BY REGION, 2021-2030 (USD THOUSAND)
TABLE 5 ASIA PACIFIC LIGHT EMITTING DIODE (LED) IN 2D DISPLAY FOR DEFENSE AND AEROSPACE MARKET, BY REGION, 2021-2030 (USD THOUSAND)
TABLE 6 ASIA PACIFIC ORGANIC LED (OLED) IN 2D DISPLAY FOR DEFENSE AND AEROSPACE MARKET, BY REGION, 2021-2030 (USD THOUSAND)
TABLE 7 ASIA PACIFIC ORGANIC LED (OLED) IN 2D DISPLAY FOR DEFENSE AND AEROSPACE MARKET, BY TYPE, 2021-2030 (USD THOUSAND)
TABLE 8 ASIA PACIFIC MICRO-LED IN 2D DISPLAY FOR DEFENSE AND AEROSPACE MARKET, BY REGION, 2021-2030 (USD THOUSAND)
TABLE 9 ASIA PACIFIC OTHERS IN 2D DISPLAY FOR DEFENSE AND AEROSPACE MARKET, BY REGION, 2021-2030 (USD THOUSAND)
TABLE 10 ASIA PACIFIC 2D DISPLAY FOR DEFENSE & AEROSPACE MARKET, BY TYPE, 2021-2030 (USD THOUSAND)
TABLE 11 ASIA PACIFIC TOUCH IN 2D DISPLAY FOR DEFENSE AND AEROSPACE MARKET, BY REGION, 2021-2030 (USD THOUSAND)
TABLE 12 ASIA PACIFIC NON-TOUCH IN 2D DISPLAY FOR DEFENSE AND AEROSPACE MARKET, BY REGION, 2021-2030 (USD THOUSAND)
TABLE 13 ASIA PACIFIC 2D DISPLAY FOR DEFENSE & AEROSPACE MARKET, BY RESOLUTION, 2021-2030 (USD THOUSAND)
TABLE 14 ASIA PACIFIC FULL HD IN 2D DISPLAY FOR DEFENSE AND AEROSPACE MARKET, BY REGION, 2021-2030 (USD THOUSAND)
TABLE 15 ASIA PACIFIC HD IN 2D DISPLAY FOR DEFENSE & AEROSPACE MARKET, BY REGION, 2021-2030 (USD THOUSAND)
TABLE 16 ASIA PACIFIC 4K IN 2D DISPLAY FOR DEFENSE & AEROSPACE MARKET, BY REGION, 2021-2030 (USD THOUSAND)
TABLE 17 ASIA PACIFIC OTHERS IN 2D DISPLAY FOR DEFENSE & AEROSPACE MARKET, BY REGION, 2021-2030 (USD THOUSAND)
TABLE 18 ASIA PACIFIC 2D DISPLAY FOR DEFENSE & AEROSPACE MARKET, BY PANEL SIZE, 2021-2030 (USD THOUSAND)
TABLE 19 ASIA PACIFIC 5 INCHES TO 10 INCHES IN 2D DISPLAY FOR DEFENSE AND AEROSPACE MARKET, BY REGION, 2021-2030 (USD THOUSAND)
TABLE 20 ASIA PACIFIC GREATER THAN 10 INCHES IN 2D DISPLAY FOR DEFENSE AND AEROSPACE MARKET, BY REGION, 2021-2030 (USD THOUSAND)
TABLE 21 ASIA PACIFIC LESS THAN 5 INCHES IN 2D DISPLAY FOR DEFENSE AND AEROSPACE MARKET, BY REGION, 2021-2030 (USD THOUSAND)
TABLE 22 ASIA PACIFIC 2D DISPLAY FOR DEFENSE & AEROSPACE MARKET, BY DISPLAY TYPE, 2021-2030 (USD THOUSAND)
TABLE 23 ASIA PACIFIC CONVENTIONAL DISPLAY IN 2D DISPLAY FOR DEFENSE AND AEROSPACE MARKET, BY REGION, 2021-2030 (USD THOUSAND)
TABLE 24 ASIA PACIFIC SMART DISPLAY IN 2D DISPLAY FOR DEFENSE AND AEROSPACE MARKET, BY REGION, 2021-2030 (USD THOUSAND)
TABLE 25 ASIA PACIFIC 2D DISPLAY FOR DEFENSE & AEROSPACE MARKET, BY SALES CHANNEL, 2021-2030 (USD THOUSAND)
TABLE 26 ASIA PACIFIC OEMS IN 2D DISPLAY FOR DEFENSE AND AEROSPACE MARKET, BY REGION, 2021-2030 (USD THOUSAND)
TABLE 27 ASIA PACIFIC RETAIL IN 2D DISPLAY FOR DEFENSE AND AEROSPACE MARKET, BY REGION, 2021-2030 (USD THOUSAND)
TABLE 28 ASIA PACIFIC 2D DISPLAY FOR DEFENSE & AEROSPACE MARKET, BY APPLICATION, 2021-2030 (USD THOUSAND)
TABLE 29 ASIA PACIFIC AEROSPACE IN 2D DISPLAY FOR DEFENSE AND AEROSPACE MARKET, BY REGION, 2021-2030 (USD THOUSAND)
TABLE 30 ASIA PACIFIC AEROSPACE IN 2D DISPLAY FOR DEFENSE AND AEROSPACE MARKET, BY TYPE, 2021-2030 (USD THOUSAND)
TABLE 31 ASIA PACIFIC AEROSPACE IN 2D DISPLAY FOR DEFENSE AND AEROSPACE MARKET, BY TYPE, 2021-2030 (USD THOUSAND)
TABLE 32 ASIA PACIFIC DEFENSE IN 2D DISPLAY FOR DEFENSE AND AEROSPACE MARKET, BY REGION, 2021-2030 (USD THOUSAND)
TABLE 33 ASIA PACIFIC DEFENSE IN 2D DISPLAY FOR DEFENSE AND AEROSPACE MARKET, BY TYPE, 2021-2030 (USD THOUSAND)
TABLE 34 ASIA-PACIFIC 2D DISPLAY FOR DEFENSE AND AEROSPACE MARKET, BY COUNTRY, 2021-2030 (USD THOUSAND)
TABLE 35 ASIA-PACIFIC 2D DISPLAY FOR DEFENSE AND AEROSPACE MARKET, BY DISPLAY TECHNOLOGY, 2021-2030 (USD THOUSAND)
TABLE 36 ASIA-PACIFIC ORGANIC LED (OLED) IN 2D DISPLAY FOR DEFENSE AND AEROSPACE MARKET, BY TYPE, 2021-2030 (USD THOUSAND)
TABLE 37 ASIA-PACIFIC 2D DISPLAY FOR DEFENSE AND AEROSPACE MARKET, BY TYPE, 2021-2030 (USD THOUSAND)
TABLE 38 ASIA-PACIFIC 2D DISPLAY FOR DEFENSE AND AEROSPACE MARKET, BY RESOLUTION, 2021-2030 (USD THOUSAND)
TABLE 39 ASIA-PACIFIC 2D DISPLAY FOR DEFENSE AND AEROSPACE MARKET, BY PANEL SIZE, 2021-2030 (USD THOUSAND)
TABLE 40 ASIA-PACIFIC 2D DISPLAY FOR DEFENSE AND AEROSPACE MARKET, BY DISPLAY TYPE, 2021-2030 (USD THOUSAND)
TABLE 41 ASIA-PACIFIC 2D DISPLAY FOR DEFENSE AND AEROSPACE MARKET, BY SALES CHANNEL, 2021-2030 (USD THOUSAND)
TABLE 42 ASIA-PACIFIC 2D DISPLAY FOR DEFENSE AND AEROSPACE MARKET, BY APPLICATION, 2021-2030 (USD THOUSAND)
TABLE 43 ASIA-PACIFIC AEROSPACE IN 2D DISPLAY FOR DEFENSE AND AEROSPACE MARKET, BY TYPE, 2021-2030 (USD THOUSAND)
TABLE 44 ASIA-PACIFIC AEROSPACE IN 2D DISPLAY FOR DEFENSE AND AEROSPACE MARKET, BY TYPE, 2021-2030 (USD THOUSAND)
TABLE 45 ASIA-PACIFIC DEFENSE IN 2D DISPLAY FOR DEFENSE AND AEROSPACE MARKET, BY TYPE, 2021-2030 (USD THOUSAND)
TABLE 46 CHINA 2D DISPLAY FOR DEFENSE AND AEROSPACE MARKET, BY DISPLAY TECHNOLOGY, 2021-2030 (USD THOUSAND)
TABLE 47 CHINA ORGANIC LED (OLED) IN 2D DISPLAY FOR DEFENSE AND AEROSPACE MARKET, BY TYPE, 2021-2030 (USD THOUSAND)
TABLE 48 CHINA 2D DISPLAY FOR DEFENSE AND AEROSPACE MARKET, BY TYPE, 2021-2030 (USD THOUSAND)
TABLE 49 CHINA 2D DISPLAY FOR DEFENSE AND AEROSPACE MARKET, BY RESOLUTION, 2021-2030 (USD THOUSAND)
TABLE 50 CHINA 2D DISPLAY FOR DEFENSE AND AEROSPACE MARKET, BY PANEL SIZE, 2021-2030 (USD THOUSAND)
TABLE 51 CHINA 2D DISPLAY FOR DEFENSE AND AEROSPACE MARKET, BY DISPLAY TYPE, 2021-2030 (USD THOUSAND)
TABLE 52 CHINA 2D DISPLAY FOR DEFENSE AND AEROSPACE MARKET, BY SALES CHANNEL, 2021-2030 (USD THOUSAND)
TABLE 53 CHINA 2D DISPLAY FOR DEFENSE AND AEROSPACE MARKET, BY APPLICATION, 2021-2030 (USD THOUSAND)
TABLE 54 CHINA AEROSPACE IN 2D DISPLAY FOR DEFENSE AND AEROSPACE MARKET, BY TYPE, 2021-2030 (USD THOUSAND)
TABLE 55 CHINA AEROSPACE IN 2D DISPLAY FOR DEFENSE AND AEROSPACE MARKET, BY TYPE, 2021-2030 (USD THOUSAND)
TABLE 56 CHINA DEFENSE IN 2D DISPLAY FOR DEFENSE AND AEROSPACE MARKET, BY TYPE, 2021-2030 (USD THOUSAND)
TABLE 57 INDIA 2D DISPLAY FOR DEFENSE AND AEROSPACE MARKET, BY DISPLAY TECHNOLOGY, 2021-2030 (USD THOUSAND)
TABLE 58 INDIA ORGANIC LED (OLED) IN 2D DISPLAY FOR DEFENSE AND AEROSPACE MARKET, BY TYPE, 2021-2030 (USD THOUSAND)
TABLE 59 INDIA 2D DISPLAY FOR DEFENSE AND AEROSPACE MARKET, BY TYPE, 2021-2030 (USD THOUSAND)
TABLE 60 INDIA 2D DISPLAY FOR DEFENSE AND AEROSPACE MARKET, BY RESOLUTION, 2021-2030 (USD THOUSAND)
TABLE 61 INDIA 2D DISPLAY FOR DEFENSE AND AEROSPACE MARKET, BY PANEL SIZE, 2021-2030 (USD THOUSAND)
TABLE 62 INDIA 2D DISPLAY FOR DEFENSE AND AEROSPACE MARKET, BY DISPLAY TYPE, 2021-2030 (USD THOUSAND)
TABLE 63 INDIA 2D DISPLAY FOR DEFENSE AND AEROSPACE MARKET, BY SALES CHANNEL, 2021-2030 (USD THOUSAND)
TABLE 64 INDIA 2D DISPLAY FOR DEFENSE AND AEROSPACE MARKET, BY APPLICATION, 2021-2030 (USD THOUSAND)
TABLE 65 INDIA AEROSPACE IN 2D DISPLAY FOR DEFENSE AND AEROSPACE MARKET, BY TYPE, 2021-2030 (USD THOUSAND)
TABLE 66 INDIA AEROSPACE IN 2D DISPLAY FOR DEFENSE AND AEROSPACE MARKET, BY TYPE, 2021-2030 (USD THOUSAND)
TABLE 67 INDIA DEFENSE IN 2D DISPLAY FOR DEFENSE AND AEROSPACE MARKET, BY TYPE, 2021-2030 (USD THOUSAND)
TABLE 68 JAPAN 2D DISPLAY FOR DEFENSE AND AEROSPACE MARKET, BY DISPLAY TECHNOLOGY, 2021-2030 (USD THOUSAND)
TABLE 69 JAPAN ORGANIC LED (OLED) IN 2D DISPLAY FOR DEFENSE AND AEROSPACE MARKET, BY TYPE, 2021-2030 (USD THOUSAND)
TABLE 70 JAPAN 2D DISPLAY FOR DEFENSE AND AEROSPACE MARKET, BY TYPE, 2021-2030 (USD THOUSAND)
TABLE 71 JAPAN 2D DISPLAY FOR DEFENSE AND AEROSPACE MARKET, BY RESOLUTION, 2021-2030 (USD THOUSAND)
TABLE 72 JAPAN 2D DISPLAY FOR DEFENSE AND AEROSPACE MARKET, BY PANEL SIZE, 2021-2030 (USD THOUSAND)
TABLE 73 JAPAN 2D DISPLAY FOR DEFENSE AND AEROSPACE MARKET, BY DISPLAY TYPE, 2021-2030 (USD THOUSAND)
TABLE 74 JAPAN 2D DISPLAY FOR DEFENSE AND AEROSPACE MARKET, BY SALES CHANNEL, 2021-2030 (USD THOUSAND)
TABLE 75 JAPAN 2D DISPLAY FOR DEFENSE AND AEROSPACE MARKET, BY APPLICATION, 2021-2030 (USD THOUSAND)
TABLE 76 JAPAN AEROSPACE IN 2D DISPLAY FOR DEFENSE AND AEROSPACE MARKET, BY TYPE, 2021-2030 (USD THOUSAND)
TABLE 77 JAPAN AEROSPACE IN 2D DISPLAY FOR DEFENSE AND AEROSPACE MARKET, BY TYPE, 2021-2030 (USD THOUSAND)
TABLE 78 JAPAN DEFENSE IN 2D DISPLAY FOR DEFENSE AND AEROSPACE MARKET, BY TYPE, 2021-2030 (USD THOUSAND)
TABLE 79 SOUTH KOREA 2D DISPLAY FOR DEFENSE AND AEROSPACE MARKET, BY DISPLAY TECHNOLOGY, 2021-2030 (USD THOUSAND)
TABLE 80 SOUTH KOREA ORGANIC LED (OLED) IN 2D DISPLAY FOR DEFENSE AND AEROSPACE MARKET, BY TYPE, 2021-2030 (USD THOUSAND)
TABLE 81 SOUTH KOREA 2D DISPLAY FOR DEFENSE AND AEROSPACE MARKET, BY TYPE, 2021-2030 (USD THOUSAND)
TABLE 82 SOUTH KOREA 2D DISPLAY FOR DEFENSE AND AEROSPACE MARKET, BY RESOLUTION, 2021-2030 (USD THOUSAND)
TABLE 83 SOUTH KOREA 2D DISPLAY FOR DEFENSE AND AEROSPACE MARKET, BY PANEL SIZE, 2021-2030 (USD THOUSAND)
TABLE 84 SOUTH KOREA 2D DISPLAY FOR DEFENSE AND AEROSPACE MARKET, BY DISPLAY TYPE, 2021-2030 (USD THOUSAND)
TABLE 85 SOUTH KOREA 2D DISPLAY FOR DEFENSE AND AEROSPACE MARKET, BY SALES CHANNEL, 2021-2030 (USD THOUSAND)
TABLE 86 SOUTH KOREA 2D DISPLAY FOR DEFENSE AND AEROSPACE MARKET, BY APPLICATION, 2021-2030 (USD THOUSAND)
TABLE 87 SOUTH KOREA AEROSPACE IN 2D DISPLAY FOR DEFENSE AND AEROSPACE MARKET, BY TYPE, 2021-2030 (USD THOUSAND)
TABLE 88 SOUTH KOREA AEROSPACE IN 2D DISPLAY FOR DEFENSE AND AEROSPACE MARKET, BY TYPE, 2021-2030 (USD THOUSAND)
TABLE 89 SOUTH KOREA DEFENSE IN 2D DISPLAY FOR DEFENSE AND AEROSPACE MARKET, BY TYPE, 2021-2030 (USD THOUSAND)
TABLE 90 AUSTRALIA 2D DISPLAY FOR DEFENSE AND AEROSPACE MARKET, BY DISPLAY TECHNOLOGY, 2021-2030 (USD THOUSAND)
TABLE 91 AUSTRALIA ORGANIC LED (OLED) IN 2D DISPLAY FOR DEFENSE AND AEROSPACE MARKET, BY TYPE, 2021-2030 (USD THOUSAND)
TABLE 92 AUSTRALIA 2D DISPLAY FOR DEFENSE AND AEROSPACE MARKET, BY TYPE, 2021-2030 (USD THOUSAND)
TABLE 93 AUSTRALIA 2D DISPLAY FOR DEFENSE AND AEROSPACE MARKET, BY RESOLUTION, 2021-2030 (USD THOUSAND)
TABLE 94 AUSTRALIA 2D DISPLAY FOR DEFENSE AND AEROSPACE MARKET, BY PANEL SIZE, 2021-2030 (USD THOUSAND)
TABLE 95 AUSTRALIA 2D DISPLAY FOR DEFENSE AND AEROSPACE MARKET, BY DISPLAY TYPE, 2021-2030 (USD THOUSAND)
TABLE 96 AUSTRALIA 2D DISPLAY FOR DEFENSE AND AEROSPACE MARKET, BY SALES CHANNEL, 2021-2030 (USD THOUSAND)
TABLE 97 AUSTRALIA 2D DISPLAY FOR DEFENSE AND AEROSPACE MARKET, BY APPLICATION, 2021-2030 (USD THOUSAND)
TABLE 98 AUSTRALIA AEROSPACE IN 2D DISPLAY FOR DEFENSE AND AEROSPACE MARKET, BY TYPE, 2021-2030 (USD THOUSAND)
TABLE 99 AUSTRALIA AEROSPACE IN 2D DISPLAY FOR DEFENSE AND AEROSPACE MARKET, BY TYPE, 2021-2030 (USD THOUSAND)
TABLE 100 AUSTRALIA DEFENSE IN 2D DISPLAY FOR DEFENSE AND AEROSPACE MARKET, BY TYPE, 2021-2030 (USD THOUSAND)
TABLE 101 SINGAPORE 2D DISPLAY FOR DEFENSE AND AEROSPACE MARKET, BY DISPLAY TECHNOLOGY, 2021-2030 (USD THOUSAND)
TABLE 102 SINGAPORE ORGANIC LED (OLED) IN 2D DISPLAY FOR DEFENSE AND AEROSPACE MARKET, BY TYPE, 2021-2030 (USD THOUSAND)
TABLE 103 SINGAPORE 2D DISPLAY FOR DEFENSE AND AEROSPACE MARKET, BY TYPE, 2021-2030 (USD THOUSAND)
TABLE 104 SINGAPORE 2D DISPLAY FOR DEFENSE AND AEROSPACE MARKET, BY RESOLUTION, 2021-2030 (USD THOUSAND)
TABLE 105 SINGAPORE 2D DISPLAY FOR DEFENSE AND AEROSPACE MARKET, BY PANEL SIZE, 2021-2030 (USD THOUSAND)
TABLE 106 SINGAPORE 2D DISPLAY FOR DEFENSE AND AEROSPACE MARKET, BY DISPLAY TYPE, 2021-2030 (USD THOUSAND)
TABLE 107 SINGAPORE 2D DISPLAY FOR DEFENSE AND AEROSPACE MARKET, BY SALES CHANNEL, 2021-2030 (USD THOUSAND)
TABLE 108 SINGAPORE 2D DISPLAY FOR DEFENSE AND AEROSPACE MARKET, BY APPLICATION, 2021-2030 (USD THOUSAND)
TABLE 109 SINGAPORE AEROSPACE IN 2D DISPLAY FOR DEFENSE AND AEROSPACE MARKET, BY TYPE, 2021-2030 (USD THOUSAND)
TABLE 110 SINGAPORE AEROSPACE IN 2D DISPLAY FOR DEFENSE AND AEROSPACE MARKET, BY TYPE, 2021-2030 (USD THOUSAND)
TABLE 111 SINGAPORE DEFENSE IN 2D DISPLAY FOR DEFENSE AND AEROSPACE MARKET, BY TYPE, 2021-2030 (USD THOUSAND)
TABLE 112 TAIWAN 2D DISPLAY FOR DEFENSE AND AEROSPACE MARKET, BY DISPLAY TECHNOLOGY, 2021-2030 (USD THOUSAND)
TABLE 113 TAIWAN ORGANIC LED (OLED) IN 2D DISPLAY FOR DEFENSE AND AEROSPACE MARKET, BY TYPE, 2021-2030 (USD THOUSAND)
TABLE 114 TAIWAN 2D DISPLAY FOR DEFENSE AND AEROSPACE MARKET, BY TYPE, 2021-2030 (USD THOUSAND)
TABLE 115 TAIWAN 2D DISPLAY FOR DEFENSE AND AEROSPACE MARKET, BY RESOLUTION, 2021-2030 (USD THOUSAND)
TABLE 116 TAIWAN 2D DISPLAY FOR DEFENSE AND AEROSPACE MARKET, BY PANEL SIZE, 2021-2030 (USD THOUSAND)
TABLE 117 TAIWAN 2D DISPLAY FOR DEFENSE AND AEROSPACE MARKET, BY DISPLAY TYPE, 2021-2030 (USD THOUSAND)
TABLE 118 TAIWAN 2D DISPLAY FOR DEFENSE AND AEROSPACE MARKET, BY SALES CHANNEL, 2021-2030 (USD THOUSAND)
TABLE 119 TAIWAN 2D DISPLAY FOR DEFENSE AND AEROSPACE MARKET, BY APPLICATION, 2021-2030 (USD THOUSAND)
TABLE 120 TAIWAN AEROSPACE IN 2D DISPLAY FOR DEFENSE AND AEROSPACE MARKET, BY TYPE, 2021-2030 (USD THOUSAND)
TABLE 121 TAIWAN AEROSPACE IN 2D DISPLAY FOR DEFENSE AND AEROSPACE MARKET, BY TYPE, 2021-2030 (USD THOUSAND)
TABLE 122 TAIWAN DEFENSE IN 2D DISPLAY FOR DEFENSE AND AEROSPACE MARKET, BY TYPE, 2021-2030 (USD THOUSAND)
TABLE 123 MALAYSIA 2D DISPLAY FOR DEFENSE AND AEROSPACE MARKET, BY DISPLAY TECHNOLOGY, 2021-2030 (USD THOUSAND)
TABLE 124 MALAYSIA ORGANIC LED (OLED) IN 2D DISPLAY FOR DEFENSE AND AEROSPACE MARKET, BY TYPE, 2021-2030 (USD THOUSAND)
TABLE 125 MALAYSIA 2D DISPLAY FOR DEFENSE AND AEROSPACE MARKET, BY TYPE, 2021-2030 (USD THOUSAND)
TABLE 126 MALAYSIA 2D DISPLAY FOR DEFENSE AND AEROSPACE MARKET, BY RESOLUTION, 2021-2030 (USD THOUSAND)
TABLE 127 MALAYSIA 2D DISPLAY FOR DEFENSE AND AEROSPACE MARKET, BY PANEL SIZE, 2021-2030 (USD THOUSAND)
TABLE 128 MALAYSIA 2D DISPLAY FOR DEFENSE AND AEROSPACE MARKET, BY DISPLAY TYPE, 2021-2030 (USD THOUSAND)
TABLE 129 MALAYSIA 2D DISPLAY FOR DEFENSE AND AEROSPACE MARKET, BY SALES CHANNEL, 2021-2030 (USD THOUSAND)
TABLE 130 MALAYSIA 2D DISPLAY FOR DEFENSE AND AEROSPACE MARKET, BY APPLICATION, 2021-2030 (USD THOUSAND)
TABLE 131 MALAYSIA AEROSPACE IN 2D DISPLAY FOR DEFENSE AND AEROSPACE MARKET, BY TYPE, 2021-2030 (USD THOUSAND)
TABLE 132 MALAYSIA AEROSPACE IN 2D DISPLAY FOR DEFENSE AND AEROSPACE MARKET, BY TYPE, 2021-2030 (USD THOUSAND)
TABLE 133 MALAYSIA DEFENSE IN 2D DISPLAY FOR DEFENSE AND AEROSPACE MARKET, BY TYPE, 2021-2030 (USD THOUSAND)
TABLE 134 THAILAND 2D DISPLAY FOR DEFENSE AND AEROSPACE MARKET, BY DISPLAY TECHNOLOGY, 2021-2030 (USD THOUSAND)
TABLE 135 THAILAND ORGANIC LED (OLED) IN 2D DISPLAY FOR DEFENSE AND AEROSPACE MARKET, BY TYPE, 2021-2030 (USD THOUSAND)
TABLE 136 THAILAND 2D DISPLAY FOR DEFENSE AND AEROSPACE MARKET, BY TYPE, 2021-2030 (USD THOUSAND)
TABLE 137 THAILAND 2D DISPLAY FOR DEFENSE AND AEROSPACE MARKET, BY RESOLUTION, 2021-2030 (USD THOUSAND)
TABLE 138 THAILAND 2D DISPLAY FOR DEFENSE AND AEROSPACE MARKET, BY PANEL SIZE, 2021-2030 (USD THOUSAND)
TABLE 139 THAILAND 2D DISPLAY FOR DEFENSE AND AEROSPACE MARKET, BY DISPLAY TYPE, 2021-2030 (USD THOUSAND)
TABLE 140 THAILAND 2D DISPLAY FOR DEFENSE AND AEROSPACE MARKET, BY SALES CHANNEL, 2021-2030 (USD THOUSAND)
TABLE 141 THAILAND 2D DISPLAY FOR DEFENSE AND AEROSPACE MARKET, BY APPLICATION, 2021-2030 (USD THOUSAND)
TABLE 142 THAILAND AEROSPACE IN 2D DISPLAY FOR DEFENSE AND AEROSPACE MARKET, BY TYPE, 2021-2030 (USD THOUSAND)
TABLE 143 THAILAND AEROSPACE IN 2D DISPLAY FOR DEFENSE AND AEROSPACE MARKET, BY TYPE, 2021-2030 (USD THOUSAND)
TABLE 144 THAILAND DEFENSE IN 2D DISPLAY FOR DEFENSE AND AEROSPACE MARKET, BY TYPE, 2021-2030 (USD THOUSAND)
TABLE 145 INDONESIA 2D DISPLAY FOR DEFENSE AND AEROSPACE MARKET, BY DISPLAY TECHNOLOGY, 2021-2030 (USD THOUSAND)
TABLE 146 INDONESIA ORGANIC LED (OLED) IN 2D DISPLAY FOR DEFENSE AND AEROSPACE MARKET, BY TYPE, 2021-2030 (USD THOUSAND)
TABLE 147 INDONESIA 2D DISPLAY FOR DEFENSE AND AEROSPACE MARKET, BY TYPE, 2021-2030 (USD THOUSAND)
TABLE 148 INDONESIA 2D DISPLAY FOR DEFENSE AND AEROSPACE MARKET, BY RESOLUTION, 2021-2030 (USD THOUSAND)
TABLE 149 INDONESIA 2D DISPLAY FOR DEFENSE AND AEROSPACE MARKET, BY PANEL SIZE, 2021-2030 (USD THOUSAND)
TABLE 150 INDONESIA 2D DISPLAY FOR DEFENSE AND AEROSPACE MARKET, BY DISPLAY TYPE, 2021-2030 (USD THOUSAND)
TABLE 151 INDONESIA 2D DISPLAY FOR DEFENSE AND AEROSPACE MARKET, BY SALES CHANNEL, 2021-2030 (USD THOUSAND)
TABLE 152 INDONESIA 2D DISPLAY FOR DEFENSE AND AEROSPACE MARKET, BY APPLICATION, 2021-2030 (USD THOUSAND)
TABLE 153 INDONESIA AEROSPACE IN 2D DISPLAY FOR DEFENSE AND AEROSPACE MARKET, BY TYPE, 2021-2030 (USD THOUSAND)
TABLE 154 INDONESIA AEROSPACE IN 2D DISPLAY FOR DEFENSE AND AEROSPACE MARKET, BY TYPE, 2021-2030 (USD THOUSAND)
TABLE 155 INDONESIA DEFENSE IN 2D DISPLAY FOR DEFENSE AND AEROSPACE MARKET, BY TYPE, 2021-2030 (USD THOUSAND)
TABLE 156 PHILIPPINES 2D DISPLAY FOR DEFENSE AND AEROSPACE MARKET, BY DISPLAY TECHNOLOGY, 2021-2030 (USD THOUSAND)
TABLE 157 PHILIPPINES ORGANIC LED (OLED) IN 2D DISPLAY FOR DEFENSE AND AEROSPACE MARKET, BY TYPE, 2021-2030 (USD THOUSAND)
TABLE 158 PHILIPPINES 2D DISPLAY FOR DEFENSE AND AEROSPACE MARKET, BY TYPE, 2021-2030 (USD THOUSAND)
TABLE 159 PHILIPPINES 2D DISPLAY FOR DEFENSE AND AEROSPACE MARKET, BY RESOLUTION, 2021-2030 (USD THOUSAND)
TABLE 160 PHILIPPINES 2D DISPLAY FOR DEFENSE AND AEROSPACE MARKET, BY PANEL SIZE, 2021-2030 (USD THOUSAND)
TABLE 161 PHILIPPINES 2D DISPLAY FOR DEFENSE AND AEROSPACE MARKET, BY DISPLAY TYPE, 2021-2030 (USD THOUSAND)
TABLE 162 PHILIPPINES 2D DISPLAY FOR DEFENSE AND AEROSPACE MARKET, BY SALES CHANNEL, 2021-2030 (USD THOUSAND)
TABLE 163 PHILIPPINES 2D DISPLAY FOR DEFENSE AND AEROSPACE MARKET, BY APPLICATION, 2021-2030 (USD THOUSAND)
TABLE 164 PHILIPPINES AEROSPACE IN 2D DISPLAY FOR DEFENSE AND AEROSPACE MARKET, BY TYPE, 2021-2030 (USD THOUSAND)
TABLE 165 PHILIPPINES AEROSPACE IN 2D DISPLAY FOR DEFENSE AND AEROSPACE MARKET, BY TYPE, 2021-2030 (USD THOUSAND)
TABLE 166 PHILIPPINES DEFENSE IN 2D DISPLAY FOR DEFENSE AND AEROSPACE MARKET, BY TYPE, 2021-2030 (USD THOUSAND)
TABLE 167 NEW ZEALAND 2D DISPLAY FOR DEFENSE AND AEROSPACE MARKET, BY DISPLAY TECHNOLOGY, 2021-2030 (USD THOUSAND)
TABLE 168 NEW ZEALAND ORGANIC LED (OLED) IN 2D DISPLAY FOR DEFENSE AND AEROSPACE MARKET, BY TYPE, 2021-2030 (USD THOUSAND)
TABLE 169 NEW ZEALAND 2D DISPLAY FOR DEFENSE AND AEROSPACE MARKET, BY TYPE, 2021-2030 (USD THOUSAND)
TABLE 170 NEW ZEALAND 2D DISPLAY FOR DEFENSE AND AEROSPACE MARKET, BY RESOLUTION, 2021-2030 (USD THOUSAND)
TABLE 171 NEW ZEALAND 2D DISPLAY FOR DEFENSE AND AEROSPACE MARKET, BY PANEL SIZE, 2021-2030 (USD THOUSAND)
TABLE 172 NEW ZEALAND 2D DISPLAY FOR DEFENSE AND AEROSPACE MARKET, BY DISPLAY TYPE, 2021-2030 (USD THOUSAND)
TABLE 173 NEW ZEALAND 2D DISPLAY FOR DEFENSE AND AEROSPACE MARKET, BY SALES CHANNEL, 2021-2030 (USD THOUSAND)
TABLE 174 NEW ZEALAND 2D DISPLAY FOR DEFENSE AND AEROSPACE MARKET, BY APPLICATION, 2021-2030 (USD THOUSAND)
TABLE 175 NEW ZEALAND AEROSPACE IN 2D DISPLAY FOR DEFENSE AND AEROSPACE MARKET, BY TYPE, 2021-2030 (USD THOUSAND)
TABLE 176 NEW ZEALAND AEROSPACE IN 2D DISPLAY FOR DEFENSE AND AEROSPACE MARKET, BY TYPE, 2021-2030 (USD THOUSAND)
TABLE 177 NEW ZEALAND DEFENSE IN 2D DISPLAY FOR DEFENSE AND AEROSPACE MARKET, BY TYPE, 2021-2030 (USD THOUSAND)
TABLE 178 VIETNAM 2D DISPLAY FOR DEFENSE AND AEROSPACE MARKET, BY DISPLAY TECHNOLOGY, 2021-2030 (USD THOUSAND)
TABLE 179 VIETNAM ORGANIC LED (OLED) IN 2D DISPLAY FOR DEFENSE AND AEROSPACE MARKET, BY TYPE, 2021-2030 (USD THOUSAND)
TABLE 180 VIETNAM 2D DISPLAY FOR DEFENSE AND AEROSPACE MARKET, BY TYPE, 2021-2030 (USD THOUSAND)
TABLE 181 VIETNAM 2D DISPLAY FOR DEFENSE AND AEROSPACE MARKET, BY RESOLUTION, 2021-2030 (USD THOUSAND)
TABLE 182 VIETNAM 2D DISPLAY FOR DEFENSE AND AEROSPACE MARKET, BY PANEL SIZE, 2021-2030 (USD THOUSAND)
TABLE 183 VIETNAM 2D DISPLAY FOR DEFENSE AND AEROSPACE MARKET, BY DISPLAY TYPE, 2021-2030 (USD THOUSAND)
TABLE 184 VIETNAM 2D DISPLAY FOR DEFENSE AND AEROSPACE MARKET, BY SALES CHANNEL, 2021-2030 (USD THOUSAND)
TABLE 185 VIETNAM 2D DISPLAY FOR DEFENSE AND AEROSPACE MARKET, BY APPLICATION, 2021-2030 (USD THOUSAND)
TABLE 186 VIETNAM AEROSPACE IN 2D DISPLAY FOR DEFENSE AND AEROSPACE MARKET, BY TYPE, 2021-2030 (USD THOUSAND)
TABLE 187 VIETNAM AEROSPACE IN 2D DISPLAY FOR DEFENSE AND AEROSPACE MARKET, BY TYPE, 2021-2030 (USD THOUSAND)
TABLE 188 VIETNAM DEFENSE IN 2D DISPLAY FOR DEFENSE AND AEROSPACE MARKET, BY TYPE, 2021-2030 (USD THOUSAND)
TABLE 189 REST OF ASIA-PACIFIC 2D DISPLAY FOR DEFENSE AND AEROSPACE MARKET, BY DISPLAY TECHNOLOGY, 2021-2030 (USD THOUSAND)
List of Figure
FIGURE 1 ASIA PACIFIC 2D DISPLAY FOR DEFENSE AND AEROSPACE MARKET: SEGMENTATION
FIGURE 2 ASIA PACIFIC 2D DIPLAY FOR DEFENSE AND AEROSPACE MARKET: DBMR TRIPOD DATA VALIDATION MODEL
FIGURE 3 ASIA PACIFIC 2D DISPLAY FOR DEFENSE AND AEROSPACE MARKET: DROC ANALYSIS
FIGURE 4 ASIA PACIFIC 2D DISPLAY FOR DEFENSE AND AEROSPACE MARKET: ASIA PACIFIC VS REGIONAL MARKET ANALYSIS
FIGURE 5 ASIA PACIFIC 2D DISPLAY FOR DEFENSE AND AEROSPACE MARKET: COMPANY RESEARCH ANALYSIS
FIGURE 6 ASIA PACIFIC 2D DISPLAY FOR DEFENSE AND AEROSPACE MARKET: INTERVIEW DEMOGRAPHICS
FIGURE 7 ASIA PACIFIC 2D DISPLAY FOR DEFENSE AND AEROSPACE MARKET: DBMR MARKET POSITION GRID
FIGURE 8 ASIA PACIFIC 2D DISPLAY FOR DEFENSE AND AEROSPACE MARKET: VENDOR SHARE ANALYSIS
FIGURE 9 ASIA PACIFIC 2D DISPLAY FOR DEFENSE AND AEROSPACE MARKET: MULTIVARIATE MODELLING
FIGURE 10 ASIA PACIFIC 2D DISPLAY FOR DEFENSE AND AEROSPACE MARKET: DISPLAY TECHNOLOGY CURVE
FIGURE 11 THE MARKET CHALLENGE MATRIX BY DISPLAY TECHNOLOGY
FIGURE 12 ASIA PACIFIC 2D DISPLAY FOR DEFENSE AND AEROSPACE MARKET: MARKET APPLICATION COVERAGE GRID
FIGURE 13 ASIA PACIFIC 2D DISPLAY FOR DEFENSE AND AEROSPACE MARKET: SEGMENTATION
FIGURE 14 EMERGING REQUIREMENTS OF ENHANCED COMMUNICATION SYSTEMS IS EXPECTED TO BE A KEY DRIVER FOR ASIA PACIFIC 2D DISPLAY FOR DEFENSE AND AEROSPACE MARKET GROWTH IN THE FORECAST PERIOD OF 2023 TO 2030
FIGURE 15 LIQUID CRYSTAL DISPLAYS (LCD) IS EXPECTED TO ACCOUNT FOR THE LARGEST SHARE OF THE ASIA PACIFIC 2D DISPLAY FOR DEFENSE AND AEROSPACE MARKET IN 2023 TO 2030
FIGURE 16 TECHNOLOGY TRENDS IN 2D DISPLAY FOR AEROSPACE AND DEFENSE
FIGURE 17 COMPANY COMPARISON
FIGURE 18 VALUE CHAIN FOR THE ASIA PACIFIC 2D DISPLAY FOR DEFENSE AND AEROSPACE MARKET
FIGURE 19 DRIVERS, RESTRAINTS, OPPORTUNITIES, AND CHALLENGES OF ASIA PACIFIC 2D DISPLAY FOR DEFENSE AND AEROSPACE MARKET
FIGURE 20 TOP 7 DEFENSE BUDGET OF NATION ACROSS THE GLOBE OF 2023 (IN USD)
FIGURE 21 MILITARY EXPENDITURE (% OF GDP) OF U.S., U.K., INDIA, CHINA, AND RUSSIA (2013-2021)
FIGURE 22 ASIA PACIFIC 2D DISPLAY FOR DEFENSE & AEROSPACE MARKET: BY DISPLAY TECHNOLOGY, 2022
FIGURE 23 ASIA PACIFIC 2D DISPLAY FOR DEFENSE & AEROSPACE MARKET: BY TYPE, 2022
FIGURE 24 ASIA PACIFIC 2D DISPLAY FOR DEFENSE & AEROSPACE MARKET: BY RESOLUTION, 2022
FIGURE 25 ASIA PACIFIC 2D DISPLAY FOR DEFENSE & AEROSPACE MARKET: BY PANEL SIZE, 2022
FIGURE 26 ASIA PACIFIC 2D DISPLAY FOR DEFENSE & AEROSPACE MARKET: BY DISPLAY TYPE, 2022
FIGURE 27 ASIA PACIFIC 2D DISPLAY FOR DEFENSE & AEROSPACE MARKET: BY SALES CHANNEL, 2022
FIGURE 28 ASIA PACIFIC 2D DISPLAY FOR DEFENSE & AEROSPACE MARKET: BY APPLICATION, 2022
FIGURE 29 ASIA-PACIFIC 2D DISPLAY FOR DEFENSE AND AEROSPACE MARKET: SNAPSHOT (2022)
FIGURE 30 ASIA-PACIFIC 2D DISPLAY FOR DEFENSE AND AEROSPACE MARKET: BY COUNTRY (2022)
FIGURE 31 ASIA-PACIFIC 2D DISPLAY FOR DEFENSE AND AEROSPACE MARKET: BY COUNTRY (2023 & 2030)
FIGURE 32 ASIA-PACIFIC 2D DISPLAY FOR DEFENSE AND AEROSPACE MARKET: BY COUNTRY (2022 & 2030)
FIGURE 33 ASIA-PACIFIC 2D DISPLAY FOR DEFENSE AND AEROSPACE MARKET: BY DISPLAY TECHNOLOGY (2023-2030)
FIGURE 34 ASIA PACIFIC 2D DISPLAY FOR DEFENSE AND AEROSPACE MARKET: COMPANY SHARE 2022 (%)
Asia Pacific 2d Display For Defense And Aerospace Market, Supply Chain Analysis and Ecosystem Framework
To support market growth and help clients navigate the impact of geopolitical shifts, DBMR has integrated in-depth supply chain analysis into its Asia Pacific 2d Display For Defense And Aerospace Market research reports. This addition empowers clients to respond effectively to global changes affecting their industries. The supply chain analysis section includes detailed insights such as Asia Pacific 2d Display For Defense And Aerospace Market consumption and production by country, price trend analysis, the impact of tariffs and geopolitical developments, and import and export trends by country and HSN code. It also highlights major suppliers with data on production capacity and company profiles, as well as key importers and exporters. In addition to research, DBMR offers specialized supply chain consulting services backed by over a decade of experience, providing solutions like supplier discovery, supplier risk assessment, price trend analysis, impact evaluation of inflation and trade route changes, and comprehensive market trend analysis.
Data collection and base year analysis are done using data collection modules with large sample sizes. The stage includes obtaining market information or related data through various sources and strategies. It includes examining and planning all the data acquired from the past in advance. It likewise envelops the examination of information inconsistencies seen across different information sources. The market data is analysed and estimated using market statistical and coherent models. Also, market share analysis and key trend analysis are the major success factors in the market report. To know more, please request an analyst call or drop down your inquiry.
The key research methodology used by DBMR research team is data triangulation which involves data mining, analysis of the impact of data variables on the market and primary (industry expert) validation. Data models include Vendor Positioning Grid, Market Time Line Analysis, Market Overview and Guide, Company Positioning Grid, Patent Analysis, Pricing Analysis, Company Market Share Analysis, Standards of Measurement, Global versus Regional and Vendor Share Analysis. To know more about the research methodology, drop in an inquiry to speak to our industry experts.
Data Bridge Market Research is a leader in advanced formative research. We take pride in servicing our existing and new customers with data and analysis that match and suits their goal. The report can be customized to include price trend analysis of target brands understanding the market for additional countries (ask for the list of countries), clinical trial results data, literature review, refurbished market and product base analysis. Market analysis of target competitors can be analyzed from technology-based analysis to market portfolio strategies. We can add as many competitors that you require data about in the format and data style you are looking for. Our team of analysts can also provide you data in crude raw excel files pivot tables (Fact book) or can assist you in creating presentations from the data sets available in the report.


