
Asia Pacific Active Smart And Intelligent Packaging Market
Market Size in USD Billion
 USD
7.23 Billion
USD
11.10 Billion
2025
2033
USD
7.23 Billion
USD
11.10 Billion
2025
2033
| 2026 - 2033 | |
| USD 7.23 Billion | |
| USD 11.10 Billion | |
| % | |
|
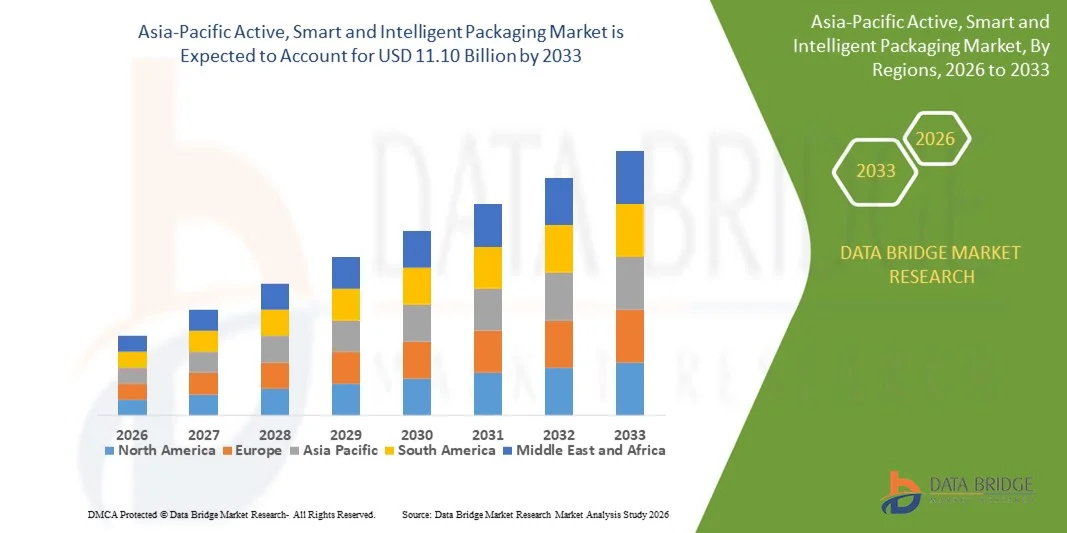
Asia-Pacific Active, Smart and Intelligent Packaging Market Size
- The Asia-Pacific active, smart and intelligent packaging market size was valued at USD 7.23 billion in 2025 and is expected to reach USD 11.10 billion by 2033, at a CAGR of 5.50% during the forecast period
- The market growth is largely fuelled by the rising demand for product traceability, extended shelf life, and enhanced food safety across the food and beverage sector
- Increasing adoption of IoT-enabled packaging solutions and growing consumer preference for convenient and interactive packaging are further driving market expansion
Asia-Pacific Active, Smart and Intelligent Packaging Market Analysis
- The market is witnessing innovation in materials, sensors, and communication technologies to enable real-time monitoring of product quality and condition
- Collaboration between packaging manufacturers and technology providers is enhancing the functionality and adoption of smart packaging solutions
- China dominated the Asia-Pacific active, smart, and intelligent packaging market with the largest revenue share of 38.20% in 2025, driven by the large-scale adoption of packaged food and beverage products and rising demand for product safety and traceability
- Japan is expected to witness the highest compound annual growth rate (CAGR) in the Asia-Pacific active, smart and intelligent packaging market due to increasing consumer demand for fresh, high-quality, and safe packaged products. The rising adoption of smart packaging technologies, including NFC-enabled labels, QR codes, and temperature-sensitive sensors, along with government initiatives promoting sustainable and innovative packaging solutions, is driving rapid market growth
- The Active Packaging segment held the largest market revenue share in 2025, driven by its ability to extend product shelf life and preserve quality, particularly in the food and beverage industry. Active packaging solutions, such as oxygen scavengers and antimicrobial films, are increasingly adopted by manufacturers to reduce spoilage and enhance product safety
Report Scope and Asia-Pacific Active, Smart and Intelligent Packaging Market Segmentation
|
Attributes |
Asia-Pacific Active, Smart and Intelligent Packaging Key Market Insights |
|
Segments Covered |
|
|
Countries Covered |
Asia-Pacific
|
|
Key Market Players |
|
|
Market Opportunities |
|
|
Value Added Data Infosets |
In addition to the insights on market scenarios such as market value, growth rate, segmentation, geographical coverage, and major players, the market reports curated by the Data Bridge Market Research also include in-depth expert analysis, pricing analysis, brand share analysis, consumer survey, demography analysis, supply chain analysis, value chain analysis, raw material/consumables overview, vendor selection criteria, PESTLE Analysis, Porter Analysis, and regulatory framework. |
Asia-Pacific Active, Smart and Intelligent Packaging Market Trends
Rising Demand For Sustainable, Interactive, And Connected Packaging
- The growing focus on sustainability and consumer engagement is significantly shaping the active, smart, and intelligent packaging market, as brands increasingly prefer packaging that extends shelf life, monitors product quality, and enhances consumer interaction. Smart packaging solutions are gaining traction due to their ability to provide real-time information, reduce waste, and improve supply chain visibility. This trend strengthens adoption across food, beverage, pharmaceutical, and personal care industries, encouraging manufacturers to innovate with connected and interactive solutions
- Increasing awareness around product safety, freshness, and traceability has accelerated the demand for active and intelligent packaging. Consumers are actively seeking products that offer tamper-evidence, freshness indicators, and QR-code-enabled interactive content, prompting brands to integrate advanced sensors and digital features. This has led to collaborations between packaging material suppliers, technology providers, and brands to enhance product protection and consumer engagement
- Sustainability, digitalization, and transparency trends are influencing purchasing and adoption decisions, with manufacturers emphasizing eco-friendly materials, recyclable substrates, and digital features. These factors help companies differentiate products in a competitive market, build brand trust, and enhance customer experience while driving adoption of smart and active packaging technologies
- For instance, in 2024, Amcor and Sealed Air expanded their packaging solutions by integrating active freshness indicators and IoT-enabled features in food and beverage packaging. These launches were introduced in response to rising consumer preference for sustainable, interactive, and quality-assured packaging, with applications across retail, e-commerce, and logistics channels. The products also strengthen brand positioning by highlighting innovation and consumer safety
- While the adoption of active, smart, and intelligent packaging is growing, market expansion depends on cost-effective integration, scalable manufacturing, and compatibility with existing production lines. Manufacturers are focusing on technological innovation, supply chain optimization, and developing cost-efficient, eco-friendly solutions to drive broader adoption
Asia-Pacific Active, Smart and Intelligent Packaging Market Dynamics
Driver
Growing Preference For Sustainable, Interactive, And Connected Packaging
- Rising consumer demand for packaging that ensures product quality, extends shelf life, and provides interactive features is a major driver for the active, smart, and intelligent packaging market. Brands are increasingly integrating sensors, freshness indicators, and QR-code-enabled information to meet evolving expectations and regulatory standards. This trend also encourages research into novel active materials and digital solutions, supporting product innovation
- Expanding applications in food, beverages, pharmaceuticals, personal care, and e-commerce industries are influencing market growth. Active and smart packaging helps enhance product safety, quality monitoring, and consumer engagement while maintaining brand trust and sustainability commitments. The increasing use of digital platforms and IoT-enabled solutions further reinforces this trend
- Packaging manufacturers are actively promoting smart and interactive packaging solutions through innovation, strategic partnerships, and technology adoption. These efforts are supported by growing consumer awareness of food safety, traceability, and sustainable consumption, while encouraging collaborations between technology providers, material suppliers, and brands to improve product functionality and reduce environmental impact
- For instance, in 2023, Tetra Pak and WestRock reported expanded use of smart and active packaging solutions across food and beverage applications, driven by higher consumer demand for freshness, traceability, and interactive experiences. Both companies also highlighted environmental sustainability and digitalization in marketing campaigns to enhance brand loyalty and customer engagement
- Although rising demand for sustainable and interactive packaging supports growth, wider adoption depends on cost optimization, integration of digital solutions, and scalable manufacturing processes. Investment in advanced materials, IoT-enabled sensors, and eco-friendly substrates will be critical for meeting global demand and maintaining competitive advantage
Restraint/Challenge
High Cost And Technological Complexity
- The relatively higher cost of active, smart, and intelligent packaging compared to conventional solutions remains a key challenge, limiting adoption among price-sensitive brands. Costs associated with integrating sensors, IoT technology, and advanced materials contribute to elevated pricing. In addition, compatibility with existing production lines can further affect adoption and implementation speed
- Consumer and brand awareness of the benefits and functionalities of smart and active packaging remains uneven, particularly among small- and medium-sized manufacturers. Limited understanding of technological advantages restricts adoption across certain product categories and can slow innovation uptake
- Supply chain and operational challenges also impact market growth, as active and intelligent packaging requires careful handling, specialized equipment, and adherence to strict quality standards. Integration with logistics, e-commerce, and retail channels requires additional investment in infrastructure and training
- For instance, in 2024, mid-size food and beverage companies reported slower adoption of smart packaging solutions due to high implementation costs and limited knowledge of technological benefits. Integration with existing packaging lines and supply chain processes was a critical barrier, impacting visibility and market penetration
- Overcoming these challenges will require cost-efficient technological solutions, enhanced awareness campaigns, and training initiatives for manufacturers and retailers. Collaboration with technology providers, packaging material suppliers, and brands can help unlock the long-term growth potential of the global active, smart, and intelligent packaging market while driving broader adoption of sustainable, interactive, and connected packaging solutions
Asia-Pacific Active, Smart and Intelligent Packaging Market Scope
The market is segmented on the basis of type, function, technology, material, level, and application.
- By Type
On the basis of type, the Asia-Pacific active, smart, and intelligent packaging market is segmented into Active Packaging, Smart Packaging, and Intelligent Packaging. The Active Packaging segment held the largest market revenue share in 2025, driven by its ability to extend product shelf life and preserve quality, particularly in the food and beverage industry. Active packaging solutions, such as oxygen scavengers and antimicrobial films, are increasingly adopted by manufacturers to reduce spoilage and enhance product safety.
The Smart Packaging segment is expected to witness the fastest growth rate from 2026 to 2033, fueled by rising demand for interactive packaging solutions that offer real-time information and consumer engagement. Smart packaging technologies, such as QR codes, NFC tags, and temperature indicators, are gaining traction for their ability to provide traceability, authenticity verification, and personalized experiences.
- By Function
On the basis of function, the market is segmented into Moisture Control, Temperature Indicators, Shelf-Life Sensing, Product Tracking, and Others. The Product Tracking segment held the largest market revenue share in 2025, driven by increasing concerns over counterfeiting and the need for efficient supply chain management. Product tracking solutions, such as barcodes, RFID tags, and QR codes, enable real-time monitoring and traceability across the logistics network. Manufacturers in the region are increasingly adopting these technologies to ensure product authenticity, optimize inventory management, and enhance consumer confidence. The growing regulatory focus on product safety and anti-counterfeiting measures further supports the adoption of product tracking solutions.
The Temperature Indicators segment is expected to witness the fastest growth rate from 2026 to 2033, driven by the growing importance of cold chain monitoring for perishable goods. Temperature-sensitive products, especially in food and pharmaceuticals, require constant monitoring to maintain quality and efficacy. The increasing adoption of smart sensors and indicator labels that alert deviations in temperature is boosting this segment. Rising consumer awareness regarding product safety and compliance with international cold chain standards is further fueling demand.
- By Technology
On the basis of technology, the market is segmented into RFID Tags, QR Codes, NFC Tags, Coding and Markings, Sensors and Output Devices, and Others. The RFID Tags segment held the largest market revenue share in 2025, owing to their robust capabilities in real-time tracking, inventory management, and anti-counterfeiting measures. RFID technology allows seamless scanning without direct line-of-sight, improving efficiency in warehouses and retail environments. Businesses are increasingly integrating RFID solutions with cloud-based platforms to enable data-driven decisions and enhanced supply chain transparency.
The NFC Tags segment is expected to witness the fastest growth rate from 2026 to 2033, fueled by their increasing use in consumer engagement and product authentication applications. NFC-enabled packaging allows users to access product information, verify authenticity, and interact with brands through smartphones. The rising trend of digital engagement and personalized marketing is encouraging manufacturers to invest in NFC technology. In addition, the growth of e-commerce and direct-to-consumer sales is further driving demand for NFC-based packaging solutions.
- By Material
On the basis of material, the market is segmented into Plastic, Paper, Glass, Corrugated Board, Metal, and Others. The Plastic segment held the largest market revenue share in 2025, driven by its versatility, cost-effectiveness, and barrier properties suitable for a wide range of applications. Plastics offer superior protection against moisture, oxygen, and contaminants, making them ideal for food and beverage packaging. The lightweight nature of plastics also reduces transportation costs, while advanced recycling technologies are helping mitigate environmental concerns.
The Paper segment is expected to witness the fastest growth rate from 2026 to 2033, fueled by rising sustainability concerns and increasing adoption of eco-friendly alternatives. Paper-based packaging is widely preferred in the region for its recyclability and biodegradability. Manufacturers are investing in innovative coatings and laminates to enhance durability and moisture resistance. Growing government regulations and consumer demand for environmentally responsible packaging solutions are further supporting this trend.
- By Level
On the basis of level, the market is segmented into Primary, Secondary, and Tertiary packaging. The Primary segment held the largest market revenue share in 2025, as it is directly in contact with products, ensuring protection, freshness, and shelf-life extension. Primary packaging also plays a critical role in branding and consumer appeal through attractive designs and labeling. In addition, the incorporation of smart and active technologies in primary packaging is enhancing product safety and traceability.
The Secondary segment is expected to witness the fastest growth rate from 2026 to 2033, driven by its role in branding, logistics efficiency, and enhancing consumer appeal. Secondary packaging provides additional protection during transportation and storage while enabling efficient stacking and handling. Businesses are increasingly using secondary packaging for marketing communication, QR codes, and tamper-evident features. The rise of e-commerce has further accelerated the demand for durable and functional secondary packaging.
- By Application
On the basis of application, the market is segmented into Food, Beverages, Personal Care, Healthcare, Automotive, Consumer Electronics, and Others. The Food segment held the largest market revenue share in 2025, driven by increasing demand for fresh, safe, and longer-lasting packaged food products. Consumers are seeking convenience, hygiene, and extended shelf life, which is encouraging the adoption of active and smart packaging solutions. The expansion of organized retail and modern trade channels in the region is also supporting market growth.
The Healthcare segment is expected to witness the fastest growth rate from 2026 to 2033, fueled by the rising need for secure, tamper-evident, and traceable packaging solutions for pharmaceuticals and medical devices. Active and intelligent packaging helps ensure drug stability, prevent counterfeiting, and comply with regulatory standards. Increasing investments in advanced healthcare infrastructure and rising awareness about product safety among consumers are key factors driving growth in this segment.
Asia-Pacific Active, Smart and Intelligent Packaging Market Regional Analysis
- China dominated the Asia-Pacific active, smart, and intelligent packaging market with the largest revenue share of 38.20% in 2025, driven by the large-scale adoption of packaged food and beverage products and rising demand for product safety and traceability
- Manufacturers are increasingly leveraging smart and active packaging solutions, such as RFID tags, temperature indicators, and antimicrobial films, to enhance shelf life, prevent counterfeiting, and improve consumer confidence
- This widespread adoption is supported by a rapidly growing retail sector, high population density, and strong regulatory standards, establishing China as a leading market for advanced packaging technologies
Japan Active, Smart and Intelligent Packaging Market Insight
The Japan active, smart, and intelligent packaging market is expected to witness the fastest growth rate from 2026 to 2033, driven by increasing consumer demand for high-quality, fresh, and safe packaged products. The adoption of smart packaging technologies, including NFC-enabled labels, QR codes, and temperature-sensitive sensors, is rising rapidly in food, pharmaceuticals, and healthcare applications. Additionally, strong government initiatives promoting sustainable packaging and digital consumer engagement are further propelling market growth.
Asia-Pacific Active, Smart and Intelligent Packaging Market Share
The Asia-Pacific active, smart and intelligent packaging industry is primarily led by well-established companies, including:
- SCG Packaging PCL (Thailand)
- Oji Holdings Corporation (Japan)
- Nine Dragons Paper (China)
- Manjushree Technopack (India)
- Polyplex Corporation Ltd (India)
- Greatview Aseptic Packaging Company (China)
- Harta Packaging Industries (Malaysia)
- Hong Thai Packaging Co. Ltd (Thailand)
- C&H Paperbox Co. Ltd (Thailand)
- Continental Packaging Co. Ltd (Thailand)
- Sarnti Packaging Co. Ltd (Japan)
- Asia Pacific Resources International Holdings Ltd (APRIL Group) (Indonesia)
- New Asia Industries Co. Ltd (China)
- Jindal Poly Films Ltd (India)
- Nippon Paper Industries Co. Ltd (Japan)
SKU-

- Interactive Data Analysis Dashboard
- Company Analysis Dashboard for high growth potential opportunities
- Research Analyst Access for customization & queries
- Competitor Analysis with Interactive dashboard
- Latest News, Updates & Trend analysis
- Harness the Power of Benchmark Analysis for Comprehensive Competitor Tracking
Asia Pacific Active Smart And Intelligent Packaging Market, Supply Chain Analysis and Ecosystem Framework
To support market growth and help clients navigate the impact of geopolitical shifts, DBMR has integrated in-depth supply chain analysis into its Asia Pacific Active Smart And Intelligent Packaging Market research reports. This addition empowers clients to respond effectively to global changes affecting their industries. The supply chain analysis section includes detailed insights such as Asia Pacific Active Smart And Intelligent Packaging Market consumption and production by country, price trend analysis, the impact of tariffs and geopolitical developments, and import and export trends by country and HSN code. It also highlights major suppliers with data on production capacity and company profiles, as well as key importers and exporters. In addition to research, DBMR offers specialized supply chain consulting services backed by over a decade of experience, providing solutions like supplier discovery, supplier risk assessment, price trend analysis, impact evaluation of inflation and trade route changes, and comprehensive market trend analysis.
Data collection and base year analysis are done using data collection modules with large sample sizes. The stage includes obtaining market information or related data through various sources and strategies. It includes examining and planning all the data acquired from the past in advance. It likewise envelops the examination of information inconsistencies seen across different information sources. The market data is analysed and estimated using market statistical and coherent models. Also, market share analysis and key trend analysis are the major success factors in the market report. To know more, please request an analyst call or drop down your inquiry.
The key research methodology used by DBMR research team is data triangulation which involves data mining, analysis of the impact of data variables on the market and primary (industry expert) validation. Data models include Vendor Positioning Grid, Market Time Line Analysis, Market Overview and Guide, Company Positioning Grid, Patent Analysis, Pricing Analysis, Company Market Share Analysis, Standards of Measurement, Global versus Regional and Vendor Share Analysis. To know more about the research methodology, drop in an inquiry to speak to our industry experts.
Data Bridge Market Research is a leader in advanced formative research. We take pride in servicing our existing and new customers with data and analysis that match and suits their goal. The report can be customized to include price trend analysis of target brands understanding the market for additional countries (ask for the list of countries), clinical trial results data, literature review, refurbished market and product base analysis. Market analysis of target competitors can be analyzed from technology-based analysis to market portfolio strategies. We can add as many competitors that you require data about in the format and data style you are looking for. Our team of analysts can also provide you data in crude raw excel files pivot tables (Fact book) or can assist you in creating presentations from the data sets available in the report.


