
Asia Pacific Biostimulants Market
Market Size in USD Million
 USD
1,252.29 Million
USD
3,285.77 Million
2025
2033
USD
1,252.29 Million
USD
3,285.77 Million
2025
2033
| 2026 - 2033 | |
| USD 1,252.29 Million | |
| USD 3,285.77 Million | |
| % | |
|
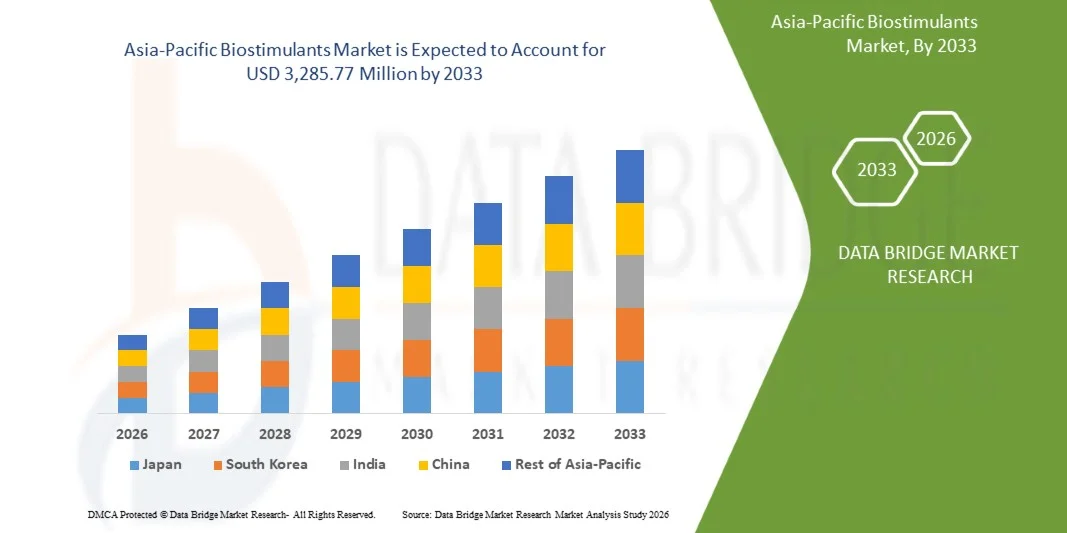
Asia-Pacific Biostimulants Market Size
- The Asia-Pacific Biostimulants Market size was valued at USD 1,252.29 million in 2025 and is expected to reach USD 3,285.77 million by 2033, at a CAGR of 12.5% during the forecast period
- The market growth is primarily driven by the rising demand for natural and sustainable additives across key industries such as food and beverages, leather, pharmaceuticals, and animal feed. Advancements in extraction and processing technologies are improving the efficiency and quality of biostimulant production, while also supporting greater digitalization and innovation within the industry.
- Increasing consumer preference for plant-based and eco-friendly products is strengthening the position of biostimulants as an attractive alternative to synthetic chemicals. Together, these factors are accelerating the adoption of biostimulant-based solutions and substantially contributing to the Asia-Pacific expansion of the Asia-Pacific Biostimulants Market.
Asia-Pacific Biostimulants Market Analysis
- Biostimulants, naturally occurring polyphenolic compounds found in various plants, are becoming increasingly vital across multiple industries—including food and beverages, leather processing, pharmaceuticals, animal feed, and water treatment—due to their multifunctional properties such as astringency, antioxidant activity, antimicrobial effects, and eco-friendliness.
- The escalating demand for biostimulants is primarily fueled by the Asia-Pacific shift toward natural, sustainable, and bio-based products, rising environmental awareness, and increasing regulatory pressure to reduce the use of synthetic additives and chemicals in both industrial and consumer goods.
- The China is the dominant force in the Asia-Pacific Biostimulants Market, accounting for 27.74% of the region’s share in 2026, and is projected to expand at a strong CAGR of 13.9% from 2026 to 2033. This growth is driven by high adoption rates of precision agriculture and digital farming tools, continued expansion of organic and regenerative farming acreage, and the strong presence of leading biostimulant manufacturers and research institutions. Additionally, rising demand for high-quality crop output—particularly in fruits, vegetables, corn, soybeans, and specialty crops—continues to boost market uptake.
- The natural biostimulants segment is projected to dominate the market with a 72.27% share in 2026, owing to its wide applicability in pharmaceuticals, animal feed, and water purification, coupled with rising R&D efforts focused on its medicinal, antioxidant, and functional properties.
Report Scope and Asia-Pacific Biostimulants Market Segmentation
|
Attributes |
Asia-Pacific Biostimulants Key Market Insights |
|
Segments Covered |
|
|
Countries Covered |
Asia-Pacific
|
|
Key Market Players |
|
|
Market Opportunities |
|
|
Value Added Data Infosets |
In addition to the insights on market scenarios such as market value, growth rate, segmentation, geographical coverage, and major players, the market reports curated by the Data Bridge Market Research also include import export analysis, production capacity overview, production consumption analysis, price trend analysis, climate change scenario, supply chain analysis, value chain analysis, raw material/consumables overview, vendor selection criteria, PESTLE Analysis, Porter Analysis, and regulatory framework. |
Asia-Pacific Biostimulants Market Trends
“Integration of Microbial and Nano-Biostimulants for Enhanced Crop Performance”
- A prominent and fast-growing trend in the Asia-Pacific Biostimulants Market is the increasing integration of microbial and nano-biostimulant technologies to enhance crop productivity, nutrient-use efficiency, and resilience to abiotic stress. This trend is driven by rapid advancements in agricultural biotechnology and a Asia-Pacific push toward high-efficiency, low-input, and sustainable farming solutions.
- Leading companies such as UPL, Valagro, and Novozymes are investing heavily in microbial consortia and nano-formulations that deliver targeted benefits—such as improved nitrogen fixation, enhanced root colonization, faster nutrient absorption, and greater stress tolerance under drought, heat, and salinity. These innovations are helping farmers achieve higher yields while reducing dependency on synthetic fertilizers.
- Microbial biostimulants—particularly plant growth-promoting rhizobacteria (PGPR), mycorrhizal fungi, and Bacillus-based solutions—are gaining traction due to their ability to strengthen root architecture, improve soil fertility, and stimulate natural plant defense pathways. Companies are also developing next-generation strains with enhanced survival and compatibility across diverse soil and climate conditions.
- Nano-biostimulants, including nano-silicon, nano-amino acids, and nano-chelated trace elements, are emerging as high-efficiency alternatives to conventional formulations. Their nano-scale structure improves penetration, mobility, and nutrient bioavailability, resulting in faster plant response and reduced application dosages.
- In precision agriculture, these advanced biostimulants are being paired with digital tools such as soil microbiome mapping, remote sensing, and AI-driven crop monitoring to enable tailored application strategies and optimize field-level performance.
- This shift toward next-generation microbial and nano-enabled biostimulants is redefining industry standards, transitioning the market from basic organic inputs to scientifically engineered, high-performance biological solutions.
Asia-Pacific Biostimulants Market Dynamics
Driver
“Increasing frequency of climate-related crop stress such as droughts, floods, and heat waves is driving farmers to adopt biostimulants to maintain crop yield and quality”
- The increasing frequency of climate-related stresses such as droughts, floods, and heat waves has emerged as a critical concern for Asia-Pacific agriculture, directly affecting crop productivity and food security.
- These extreme conditions disrupt plant metabolism, impair nutrient uptake, and reduce overall yield potential. As a result, farmers are increasingly turning to biostimulants—natural substances that enhance plant physiological processes—to strengthen crop resilience against environmental stress.
- The adoption of biostimulants is enabling producers to sustain yield and quality under unpredictable climatic scenarios while supporting long-term soil and ecosystem health.
- For Instance- As presented in an MDPI research article in July 2025, the application of seaweed extract on soybean crops under water-deficit conditions improved photosynthetic efficiency and biomass accumulation, indicating the role of biostimulants in improving drought resilience
- As stated in a BASF and Elicit Plant joint release in October 2024, field trials on sunflower crops demonstrated that seaweed-derived biostimulants improved drought resistance and maintained yield under water-limited conditions, reinforcing confidence in biological stress-mitigation products
- The rising occurrence of extreme climatic events continues to disrupt Asia-Pacific agricultural productivity, compelling farmers to seek sustainable solutions that enhance crop resilience. Biostimulants have emerged as a vital component in mitigating the effects of droughts, floods, and heat waves by improving plant stress tolerance and recovery capacity.
- Supported by increasing field validation and product innovation, their adoption is expected to accelerate further as growers prioritize yield stability and quality in the face of climate uncertainty
Restraint/Challenge
“High cost of biostimulant products compared to conventional fertilizers limits adoption among small-scale and resource-constrained farmers”
- The relatively high cost of biostimulant products compared to conventional chemical fertilizers acts as a significant restraint to market growth, particularly among small-scale and resource-constrained farmers.
- While biostimulants offer long-term benefits in terms of soil health, yield stability, and sustainability, their upfront cost and limited price competitiveness often discourage adoption in cost-sensitive agricultural regions. This price disparity, coupled with lower awareness of long-term economic returns, continues to hinder the widespread use of biostimulants in developing and low-income farming communities
- For Instance- As reported by KNN India in September 2025, the fertiliser sector highlighted that new regulations treating biostimulant under formal fertilizer control have raised compliance and production costs, threatening many small SME manufacturers and indirectly increasing end‐product costs for farmers.
- In 2025, Khoulati et al. in “Harnessing Biostimulants for Sustainable Agriculture” pointed out that one of the major challenges is “economic constraints” — including high product cost relative to conventional inputs — limiting uptake in resource‑constrained settings
- The relatively high cost of biostimulant products compared to conventional fertilizers continues to be a major obstacle to their widespread adoption, particularly among small-scale and resource-constrained farmers.
- Despite their proven benefits for soil health, crop resilience, and long-term sustainability, the higher upfront expenses, limited government subsidies, and lack of affordable formulations make biostimulants less accessible to price-sensitive growers. Unless cost barriers are addressed through policy support, technological innovation, and localized production, their potential to transform sustainable agriculture will remain underutilized in many developing regions.
Opportunity
“Expansion into emerging markets with increasing agricultural modernization and awareness of sustainable practices presents significant growth potential”
- The expansion of biostimulant use into emerging markets presents substantial growth opportunities, driven by accelerating agricultural modernization and rising awareness of sustainable farming practices. As countries in Asia-Pacific, Latin America, and Africa increasingly adopt advanced crop management techniques to enhance productivity and resource efficiency, biostimulants are gaining attention as an eco-friendly solution to improve soil health and crop resilience. Supportive government initiatives, growing investment in agricultural R&D, and farmer education programs are further fostering market penetration, positioning emerging economies as key growth hubs for the global biostimulants industry in the coming years.
- For instance, In August 2025, a GK Today article reported that India’s shift toward sustainable and climate-resilient farming and rising awareness about crop health are boosting biostimulant uptake in the country.
- For instance, In July 2025, Agrithority published that in Latin America, increasing recognition of biostimulants and bio-inputs as sustainable alternatives in tropical farming systems is accelerating investment and uptake across Brazil, Argentina and Peru.
- Although the Biostimulants segment offers a promising shift toward sustainable agriculture by enhancing plant resilience, improving soil health and reducing reliance on conventional agro-chemicals, its path forward is not without challenges. Key issues include a regulatory landscape still evolving to ensure product efficacy and quality, widespread gaps in farmer education and field-level assurance, and the dominance of unverified formulations in the market. Until these obstacles are addressed through standardized testing, improved transparency and farmer-centric extension services, the full potential of biostimulants will be constrained.
Asia-Pacific Biostimulants Market Scope
The Asia-Pacific Biostimulants Market is segmented into six notable segments based on the origin, form, active ingredients, application method, crop, end user.
- By Origin
On the basis of Origin, the Global Asia-Pacific Biostimulants Market is segmented into synthetic biostimulants, natural biostimulants. Dry is sub segment into water dispersible, dry granules, wettable powder and outsourced processing is sub segmented into suspension concentrate, emulsifiable concentrate, soluble liquid concentrate. Natural biostimulants is further sub-segmented on the basis of form into dry and outsourced processing. Dry is sub segment into water dispersible, dry granules, wettable powder. In 2026, the natural biostimulants segment is expected to dominate with market share of 71.94%.
The natural biostimulants segment is also expected to register the highest CAGR of 12.6% due to its increasing adoption among farmers seeking sustainable and environmentally friendly crop management solutions. Natural biostimulants, derived from organic sources such as seaweed extracts, protein hydrolysates, and beneficial microorganisms, enhance plant growth, nutrient uptake, and stress tolerance without the environmental impact associated with synthetic chemicals.
- By Form
On the basis of Form, the Global Asia-Pacific Biostimulants Market is segmented into liquid, dry. Dry are further sub-segmented into water dispersible, dry granules, wettable powder. Liquid is further sub-segmented into suspension concentrate, emulsifiable concentrate, soluble liquid concentrate. In 2026 Liquid segment is expected to dominate the market with 65.45% share.
The liquid segment is also expected to register the highest CAGR of 12.5% due to its ease of application, rapid absorption, and compatibility with modern irrigation and spraying systems. Liquid biostimulants allow uniform distribution of active ingredients, ensuring efficient nutrient uptake and enhanced plant growth, particularly in large-scale farming operations.
- By active ingredients
On the basis of Active Ingredients, the Global Asia-Pacific Biostimulants Market is segmented into b-vitamins, chitosan, chitin, microbial amendments, protein hydrolysates, extract based, acid based, others. In the extract based, the market is further segmented into fungal extract, plant extract, seaweed extracts. in acid based, the market is further segmented to humic acid fulvic acids, amino acid. In 2026, the acid based segment is anticipated to dominate the market with 53.32% share.
The acid based segment is also expected to register the highest CAGR of 12.7% due to the rapid adoption of amino acids, humic acids, and fulvic acids in enhancing crop productivity and stress tolerance. These acid-based biostimulants improve nutrient uptake, stimulate root development, and boost plant resilience against abiotic stresses such as drought, salinity, and extreme temperatures. Their effectiveness across a wide range of crops, coupled with increasing farmer awareness of sustainable and eco-friendly agricultural practices, drives their growing popularity.
- By application
On the basis of Application method, the Global Asia-Pacific Biostimulants Market is segmented into seed treatment, soil treatment, foliar treatment. In 2026, the foliar treatment segment is anticipated to dominate the market with 74.39% share.
The foliar treatment segment is also expected to register the highest CAGR of 12.4% due to its direct and efficient method of delivering nutrients and active compounds to crops. Foliar applications allow rapid absorption through the leaves, leading to faster responses in growth, stress tolerance, and yield improvement compared to soil applications. The increasing adoption of precision agriculture techniques, rising labor efficiency requirements, and the versatility of foliar treatments across a wide range of crops further support market growth
- By crop
On the basis of Crop, the Global Asia-Pacific Biostimulants Market is segmented into turf ornamentals, oilseeds & pulses, cereals & grains, fruits & vegetables, others. The oilseeds & pulses the market is further segmented into soybean, sunflower, rapeseed/canola, groundnut (peanut), sesame, others. In the cereals & grain the market is further segmented into wheat, rice, maize(corn), barley, oats, sorghum, others. In 2026, the fruits & vegetables segment is anticipated to dominate the market with 58.87% share.
The fruit and vegetable segment is also expected to register the highest CAGR of 12.6% due to the increasing demand for high-quality, nutrient-rich, and visually appealing produce. Biostimulants enhance crop yield, improve fruit size, color, taste, and shelf life, and boost resistance to abiotic stresses such as drought, heat, and salinity, making them highly valued in fruit and vegetable cultivation. The rising consumer preference for fresh and organic produce, coupled with stricter regulations on chemical fertilizers and pesticides, is driving farmers to adopt biostimulants
- By end user
On the basis of End User, the Global Asia-Pacific Biostimulants Market is segmented into research institutes, farmers. In 2026, the farmers segment is anticipated to dominate the market with 85.34% market share.
The farmer segment is also expected to register the highest CAGR of 12.6% due the growing recognition of biostimulants as essential tools for sustainable and high-yield agriculture. Farmers are increasingly adopting these products to improve crop growth, enhance nutrient efficiency, and strengthen resistance to environmental stresses such as drought, salinity, and extreme temperatures. The rising demand for organic and high-quality produce, coupled with stricter regulations on synthetic fertilizers and chemical inputs, is encouraging farmers to integrate biostimulants into their crop management practices.
Asia-Pacific Biostimulants Market Regional Analysis
The Asia-Pacific Biostimulants Market is experiencing steady and strong growth, driven by increasing adoption of sustainable agricultural inputs, precision farming technologies, and the rising shift toward organic and residue-free food production. The region continues to invest heavily in biological crop enhancement solutions to improve nutrient efficiency, stress tolerance, and overall plant productivity.
CHINA Asia-Pacific Biostimulants Market Insight
The CHINA is the dominant force in the Asia-Pacific Biostimulants Market. This growth is driven by high adoption rates of precision agriculture and digital farming tools, continued expansion of organic and regenerative farming acreage, and the strong presence of leading biostimulant manufacturers and research institutions. Additionally, rising demand for high-quality crop output—particularly in fruits, vegetables, corn, soybeans, and specialty crops—continues to boost market uptake.
INDIA Biostimulatns Market Insights
India holds significance of the Asia-Pacific Biostimulants Market in 2026. This expansion is driven by the rapid growth of organic and low-chemical-input farming, rising consumer demand for clean-label and bio-based food products, and strong government support for environmentally friendly agricultural practices. Adoption of biostimulants is increasing across key crop categories—including cereals, oilseeds, turf, and horticultural crops—further accelerating market uptake. Additionally, India’s growing investment in soil health improvement programs is reinforcing the shift toward biological crop enhancement solutions, supporting sustained long-term market growth
Asia-Pacific Biostimulants Market Share
The Asia-Pacific Biostimulants Market is primarily led by well-established companies, including:
- Ajinomoto Co., Inc (Japan)
- Syngenta Biologicals (Switzerland)
- Coromandel International Ltd. (India)
- BASF (Germany)
- Bayer AG (Germany)
- UPL (India)
- Biostadt India Limited (India)
- Novozymes (Denmark)
- Agricen (U.S.)
- FMC Corporation (U.S.)
- T. Stanes & Company Limited (TSTANES) (India)
- REKA ( Koppert) (Netherlands)
- Atlántica Agrícola (China)
- Haifa Negev Technologies Ltd. (Israel)
- ILSA S.p.A. (Italy)
- AG Biotech, Inc. (U.S.)
Latest Developments in Asia-Pacific Biostimulants Market
- In 2023 February, ILSA launched new biostimulants based on renewable vegetable sources—soy and algae. The soy-based product contains amino acids, betaines, and triacontanol, while the algae-based biostimulant is extracted using sustainable, non-invasive methods. Both products enhance plant growth, stress tolerance, and fruit quality.
- In 2025 February, Horticoop invested in REKA Group BV, a spin-off from Koppert specializing in regenerative soil improvement. The investment supports REKA’s mission to develop and distribute biostimulants, nutrients, and inoculants that enhance soil health, nutrient efficiency, and plant resilience. This partnership aims to strengthen sustainable agriculture and horticulture Asia-Pacificly.
- In 2024 October, T.Stanes launched and promoted Fytovita, a vitamin-based biostimulant, highlighting its role in enhancing plant growth, mitigating abiotic stress, and improving crop yield and quality.
- In 2025 March, Ajinomoto Co., Inc. announced that it would participate as a partner in the “Recovery of Degraded Pasture Verification Study” project in Brazil under the Japan–Brazil Green Partnership Initiative, providing its amino-acid-based biostimulant products (e.g., AJIFOL and AMINO Arginine) for application on cropland to verify restoration of degraded pasture lands.
- In 2025 November, BASF announced that it “continues its commitment to low-interest grower financing” for the 2026 growing season, offering 0% APR financing on purchases of participating crop protection, seed treatment and seed brands to support farmers with their investment in sustainable agriculture.
SKU-

- Interactive Data Analysis Dashboard
- Company Analysis Dashboard for high growth potential opportunities
- Research Analyst Access for customization & queries
- Competitor Analysis with Interactive dashboard
- Latest News, Updates & Trend analysis
- Harness the Power of Benchmark Analysis for Comprehensive Competitor Tracking
Table of Content
1 INTRODUCTION
1.1 OBJECTIVES OF THE STUDY
1.2 MARKET DEFINITION
1.3 OVERVIEW OF ASIA-PACIFIC BIOSTIMULANTS MARKET
1.4 CURRENCY AND PRICING
1.5 LIMITATIONS
1.6 MARKETS COVERED
2 MARKET SEGMENTATION
2.1 MARKETS COVERED
2.2 GEOGRAPHICAL SCOPE
2.3 YEARS CONSIDERED FOR THE STUDY
2.4 DBMR TRIPOD DATA VALIDATION MODEL
2.5 PRIMARY INTERVIEWS WITH KEY OPINION LEADERS
2.6 DBMR MARKET POSITION GRID
2.7 VENDOR SHARE ANALYSIS
2.8 MULTIVARIATE MODELING
2.9 ORIGIN TIMELINE CURVE
2.1 MARKET END-USER COVERAGE GRID
2.11 SECONDARY SOURCES
2.12 ASSUMPTIONS
3 EXECUTIVE SUMMARY
4 PREMIUM INSIGHTS
4.1 PORTER’S FIVE FORCES ANALYSIS
4.1.1 THREAT OF NEW ENTRANTS
4.1.2 BARGAINING POWER OF SUPPLIERS
4.1.3 BARGAINING POWER OF BUYERS
4.1.4 THREAT OF SUBSTITUTE PRODUCTS
4.1.5 INDUSTRY RIVALRY
4.2 PRICING ANALYSIS
4.3 COMPANY PRODUCTION CAPACITY OUTLOOK
4.3.1 OVERVIEW
4.3.2 CONCLUSION
4.4 INDUSTRY ECO-SYSTEM ANALYSIS
4.4.1 OVERVIEW
4.4.2 PROMINENT COMPANIES
4.4.2.1 ASIA-PACIFIC SCALE AND STRATEGIC ADVANTAGES
4.4.2.2 KEY FUNCTIONS AND VALUE‑CHAIN ROLES
4.4.3 SMALL & MEDIUM‑SIZED COMPANIES
4.4.3.1 INNOVATION‑DRIVEN SMES
4.4.3.2 BUSINESS MODELS AND COMPETITIVE ROLES
4.4.4 END USERS
4.4.4.1 SEGMENTATION OF END USERS
4.4.4.2 ADOPTION DRIVERS, BARRIERS AND VALUE CREATION
4.4.4.3 END‑USER TABLE BY CROP SEGMENT
4.4.5 CONCLUSION
4.5 PATENT ANALYSIS– ASIA-PACIFIC BIOSTIMULANTS MARKET
4.5.1 PATENT QUALITY AND STRENGTH
4.5.2 PATENT FAMILIES
4.5.3 LICENSING AND COLLABORATIONS
4.5.4 REGION PATENT LANDSCAPE
4.5.5 IP STRATEGY AND MANAGEMENT
4.6 RAW MATERIAL SOURCING
4.6.1 SEAWEED EXTRACTS
4.6.2 HUMIC AND FULVIC SUBSTANCES
4.6.3 AMINO ACIDS AND PROTEIN HYDROLYSATES
4.6.4 MICROBIAL STRAINS (BACTERIA, FUNGI, AND YEAST)
4.6.5 ORGANIC ACIDS AND POLYSACCHARIDES
4.6.6 INORGANIC NUTRIENTS AND CHELATING AGENTS
4.6.7 CARRIERS AND FORMULATION ADDITIVES
4.7 FACTORS AFFECTING BUYING DECISIONS IN THE ASIA-PACIFIC BIOSTIMULANTS MARKET
4.7.1 INTRODUCTION:
4.7.2 PROVEN TECHNICAL EFFICACY AND DEMONSTRATED PERFORMANCE
4.7.3 CROP, SOIL, AND ENVIRONMENTAL FIT
4.7.4 ECONOMIC VIABILITY AND RETURN ON INVESTMENT (ROI)
4.7.5 TRUST, TRANSPARENCY, AND BRAND REPUTATION
4.7.6 REGULATORY COMPLIANCE AND SUSTAINABILITY CREDENTIALS
4.7.7 KNOWLEDGE, AWARENESS, AND RISK PERCEPTION
4.7.8 CONCLUSION
4.8 PRODUCTION CONSUMPTION ANALYSIS
4.8.1 PRODUCTION DATASET
4.8.2 CONSUMPTION DATASET
4.9 IMPORT EXPORT SCENARIO
4.9.1 IMPORT DATASET
4.9.2 EXPORT DATASET
4.1 INNOVATION TRACKER AND STRATEGIC ANALYSIS
4.10.1 MAJOR DEALS AND STRATEGIC ALLIANCES ANALYSIS
4.10.1.1 JOINT VENTURES
4.10.1.2 MERGERS & ACQUISITIONS
4.10.1.3 LICENSING & PARTNERSHIP AGREEMENTS
4.10.1.4 TECHNOLOGY COLLABORATIONS
4.10.1.5 STRATEGIC DIVESTMENTS / PORTFOLIO RESTRUCTURING
4.10.2 NUMBER OF PRODUCTS IN DEVELOPMENT
4.10.3 STAGE OF DEVELOPMENT
4.10.4 TIMELINES AND MILESTONES
4.10.5 INNOVATION STRATEGIES AND METHODOLOGIES
4.10.6 RISK ASSESSMENT AND MITIGATION
4.11 PRODUCT ADOPTION SCENARIO IN THE ASIA-PACIFIC BIOSTIMULANTS MARKET
4.11.1 INTRODUCTION
4.11.2 CURRENT STAGE OF ADOPTION
4.11.3 REGIONAL AND CROP-SPECIFIC ADOPTION PATTERNS
4.11.4 DRIVERS OF ADOPTION
4.11.5 BARRIERS TO ADOPTION
4.11.6 ADOPTION CURVE AND OUTLOOK
4.11.7 FARMER-CENTRIC PERSPECTIVE
4.11.8 IMPLICATIONS FOR STAKEHOLDERS
4.11.9 CONCLUSION
4.12 COMPANY EVALUATION QUADRANT
4.13 COST ANALYSIS BREAKDOWN
4.13.1 OVERVIEW
4.13.2 CAPITAL INVESTMENT AND PRODUCTION SCALE
4.13.2.1 PLANT SCALE, INFRASTRUCTURE AND AUTOMATION
4.13.2.2 EQUIPMENT AND PROCESS COMPLEXITY
4.13.3 RAW MATERIAL, FORMULATION AND OPERATING COSTS
4.13.3.1 RAW MATERIAL SOURCING AND VARIABILITY
4.13.3.2 PROCESSING INTENSITY AND FORMULATION COMPLEXITY
4.13.3.3 VARIABILITY AND RISK PREMIUMS
4.13.4 REGULATORY, COMPLIANCE AND REGISTRATION COSTS
4.13.4.1 REGULATORY LANDSCAPE AND ASSOCIATED COSTS
4.13.4.2 IMPLICATIONS FOR MANUFACTURING COST BASE
4.13.5 LOGISTICS, DISTRIBUTION AND APPLICATION COSTS
4.13.5.1 PACKAGING, STORAGE AND TRANSPORTATION
4.13.5.2 CHANNEL STRUCTURE AND END‑USER APPLICATION
4.13.6 COST‑BENEFIT CONSIDERATIONS AND MARGIN IMPLICATIONS
4.13.6.1 RETURN‑ON‑INVESTMENT FOR GROWERS
4.13.6.2 MANUFACTURER AND DISTRIBUTOR MARGINS
4.13.7 COST‑REDUCTION OPPORTUNITIES AND INDUSTRY TRENDS
4.13.7.1 USE OF AGRO‑WASTE FEEDSTOCKS AND CIRCULAR ECONOMY
4.13.7.2 SCALE‑UPS, PROCESS EFFICIENCY AND STANDARDISATION
4.13.7.3 REGULATORY HARMONISATION AND ASIA-PACIFIC MARKET ACCESS
4.13.8 CONCLUSION
4.14 PROFIT MARGINS SCENARIO
4.14.1 OVERVIEW
4.14.2 VALUE‑CHAIN MARGIN STRUCTURE
4.14.2.1 MANUFACTURER GROSS MARGIN
4.14.2.2 DISTRIBUTOR / DEALER MARGIN
4.14.2.3 FARMER VALUE‑CAPTURE AND MARGIN REALISATION
4.14.3 MARGIN DRIVERS AND CONSTRAINTS
4.14.3.1 NOVEL ACTIVES AND PREMIUM PRICING
4.14.3.2 COST BASED PRESSURES
4.14.3.3 SCALE AND ADOPTION RATE
4.14.3.4 COMPETITIVE PRESSURE AND SUBSTITUTION
4.14.3.5 FARMER ROI AND WILLINGNESS TO PAY
4.14.4 ESTIMATED PROFIT MARGIN RANGES
4.14.5 MARGIN IMPROVEMENT STRATEGIES
4.14.5.1 VALUE‑BASED PRICING
4.14.5.2 COST BASE OPTIMISATION
4.14.5.3 PREMIUM SEGMENT FOCUS
4.14.5.4 SCALE EXPANSION
4.14.5.5 FARMER ENGAGEMENT AND DEMONSTRATION
4.14.6 REGIONAL AND CROP‑SEGMENT CONSIDERATIONS
4.14.7 CONCLUSION
4.15 IMPACT OF ECONOMIC SLOWDOWN ON MARKET
4.15.1 IMPACT ON PRICE
4.15.2 IMPACT ON SUPPLY CHAIN
4.15.3 IMPACT ON SHIPMENT
4.15.4 IMPACT ON COMPANY’S STRATEGIC DECISIONS
4.15.5 IMPACT ON DEMAND
4.15.6 IMPACT ON STRATEGIC DECISIONS
4.16 SUPPLY CHAIN ANALYSIS
4.16.1 OVERVIEW
4.16.2 LOGISTICS COST SCENARIO
4.16.3 IMPORTANCE OF LOGISTICS SERVICE PROVIDERS
5 TARIFFS & IMPACT ON THE MARKET
5.1 CURRENT TARIFF RATE
5.1.1 OUTLOOK: LOCAL PRODUCTION VS IMPORT RELIANCE
5.2 VENDOR SELECTION CRITERIA DYNAMICS
5.3 IMPACT ON SUPPLY CHAIN
5.3.1 RAW MATERIAL PROCUREMENT
5.3.2 MANUFACTURING AND PRODUCTION
5.3.3 LOGISTICS AND DISTRIBUTION
5.3.4 PRICE PITCHING AND POSITION OF MARKET
5.4 INDUSTRY PARTICIPANTS: PROACTIVE MOVES
5.4.1 SUPPLY CHAIN OPTIMIZATION
5.4.2 JOINT VENTURE ESTABLISHMENTS
5.5 IMPACT ON PRICES
5.6 REGULATORY INCLINATION
5.6.1 GEOPOLITICAL SITUATION
5.6.2 TRADE PARTNERSHIPS BETWEEN THE COUNTRIES
5.6.2.1 FREE TRADE AGREEMENTS
5.6.2.2 ALLIANCES ESTABLISHMENTS
5.6.3 STATUS ACCREDITATION (INCLUDING MFN)
5.6.4 DOMESTIC COURSE OF CORRECTION
5.6.4.1 INCENTIVE SCHEMES TO BOOST PRODUCTION OUTPUTS
5.6.4.2 ESTABLISHMENT OF SPECIAL ECONOMIC ZONES / INDUSTRIAL PARKS
6 REGULATION COVERAGE IN THE ASIA-PACIFIC BIOSTIMULANTS MARKET
6.1 OVERVIEW
6.2 REGULATORY DEFINITIONS AND CLASSIFICATION
6.3 COMPLIANCE AND REGISTRATION REQUIREMENTS
6.4 REGIONAL REGULATORY HIGHLIGHTS
6.5 IMPLICATIONS FOR STAKEHOLDERS
6.6 CHALLENGES IN REGULATORY COVERAGE
6.7 OUTLOOK
7 MARKET OVERVIEW
7.1 DRIVERS
7.1.1 INCREASING FREQUENCY OF CLIMATE-RELATED CROP STRESS SUCH AS DROUGHTS, FLOODS, AND HEAT WAVES IS DRIVING FARMERS TO ADOPT BIOSTIMULANTS TO MAINTAIN CROP YIELD AND QUALITY.
7.1.2 RISING ASIA-PACIFIC DEMAND FOR ORGANIC AND SUSTAINABLY PRODUCED FOOD IS ENCOURAGING THE USE OF BIOSTIMULANTS AS A NATURAL ALTERNATIVE TO CHEMICAL FERTILIZERS.
7.1.3 DECLINING SOIL FERTILITY DUE TO OVERUSE OF SYNTHETIC FERTILIZERS AND INTENSIVE FARMING PRACTICES IS PROMPTING FARMERS TO USE BIOSTIMULANTS TO ENHANCE NUTRIENT ABSORPTION AND SOIL MICROBIAL ACTIVITY.
7.1.4 GROWING AWARENESS AMONG FARMERS ABOUT LONG-TERM SOIL HEALTH AND SUSTAINABLE AGRICULTURE IS INCREASING THE ADOPTION OF BIOSTIMULANTS TO IMPROVE PLANT RESILIENCE AND PRODUCTIVITY.
7.2 RESTRAINTS
7.2.1 HIGH COST OF BIOSTIMULANT PRODUCTS COMPARED TO CONVENTIONAL FERTILIZERS LIMITS ADOPTION AMONG SMALL-SCALE AND RESOURCE-CONSTRAINED FARMERS
7.2.2 INCONSISTENT PERFORMANCE ACROSS DIFFERENT CROPS, SOILS, AND CLIMATES CREATES UNCERTAINTY FOR FARMERS, SLOWING WIDESPREAD ADOPTION.
7.3 OPPORTUNITY
7.3.1 EXPANSION INTO EMERGING MARKETS WITH INCREASING AGRICULTURAL MODERNIZATION AND AWARENESS OF SUSTAINABLE PRACTICES PRESENTS SIGNIFICANT GROWTH POTENTIAL
7.3.2 DEVELOPMENT OF NEXT-GENERATION BIOSTIMULANTS (MICROBIAL, SEAWEED, OR AMINO ACID-BASED) TAILORED TO SPECIFIC CROPS AND STRESS CONDITIONS OFFERS OPPORTUNITIES FOR PRODUCT DIFFERENTIATION.
7.3.3 INTEGRATION OF BIOSTIMULANTS WITH PRECISION AGRICULTURE TECHNIQUES (LIKE SENSOR-BASED NUTRIENT MANAGEMENT AND TARGETED APPLICATION) CAN OPTIMIZE EFFICACY AND REDUCE INPUT COSTS
7.4 CHALLENGES
7.4.1 LACK OF STANDARDIZED QUALITY BENCHMARKS AND REGULATIONS GLOBALLY MAKES IT DIFFICULT TO ENSURE CONSISTENT PRODUCT EFFECTIVENESS, IMPACTING FARMER TRUST.
7.4.2 FRAGMENTED DISTRIBUTION NETWORKS AND LIMITED AVAILABILITY IN REMOTE AGRICULTURAL REGIONS RESTRICT MARKET PENETRATION AND CONSISTENT USAGE
8 ASIA-PACIFIC BIOSTIMULANTS MARKET, BY ORIGIN
8.1 OVERVIEW
8.2 NATURAL BIOSTIMULANTS
8.2.1 LIQUID
8.2.2 DRY
8.3 SYNTHETIC BIOSTIMULANTS
8.3.1 LIQUID
8.3.2 DRY
9 ASIA-PACIFIC BIOSTIMULANTS MARKET, BY FORM
9.1 OVERVIEW
9.2 LIQUID
9.3 DRY
10 ASIA-PACIFIC BIOSTIMULANTS MARKET, BY ACTIVE INGREDIENTS
10.1 OVERVIEW
10.2 ACID BASED
10.3 EXTRACT BASED
10.4 PROTEIN HYDROLYSATES
10.5 MICROBIAL AMENDMENTS
10.6 CHITIN
10.7 CHITOSAN
10.8 B- VITAMINS
10.9 OTHERS
11 ASIA-PACIFIC BIOSTIMULANTS MARKET, BY CROP
11.1 OVERVIEW
11.2 FRUITS & VEGETABLES
11.3 CEREALS & GRAINS
11.4 OILSEEDS & PULSES
11.5 TURF & ORNAMENTALS
11.6 OTHER CROPS
12 ASIA-PACIFIC BIOSTIMULANTS MARKET, BY APPLICATION METHOD
12.1 OVERVIEW
12.2 FOLIAR TREATMENT
12.3 SOIL TREATMENT
12.4 SEED TREATMENT
13 ASIA-PACIFIC BIOSTIMULANTS MARKET, BY END USER
13.1 OVERVIEW
13.2 FARMERS
13.3 RESEARCH INSTITUTES
14 ASIA-PACIFIC BIOSTIMULANTS MARKET, BY REGION
14.1 ASIA PACIFIC
14.1.1 CHINA
14.1.2 INDIA
14.1.3 AUSTRALIA
14.1.4 JAPAN
14.1.5 INDONESIA
14.1.6 SOUTH KOREA
14.1.7 THAILAND
14.1.8 MALAYSIA
14.1.9 PHILIPPINES
14.1.10 SINGAPORE
14.1.11 NEW ZEALAND
14.1.12 REST OF ASIA-PACIFIC
15 ASIA-PACIFIC BIOSTIMULANTS MARKET: COMPANY LANDSCAPE
15.1 MANUFACTURER COMPANY SHARE ANALYSIS: GLOBAL
16 SWOT ANALYSIS
17 COMPANY PROFILE
17.1 NOVOZYMES A/S
17.1.1 COMPANY SNAPSHOT
17.1.2 REVENUE ANALYSIS
17.1.3 COMPANY SHARE ANALYSIS
17.1.4 PRODUCT PORTFOLIO
17.1.5 RECENT DEVELOPMENT
17.2 AJINOMOTO CO., INC.
17.2.1 COMPANY SNAPSHOT
17.2.2 REVENUE ANALYSIS
17.2.3 COMPANY SHARE ANALYSIS
17.2.4 PRODUCT PORTFOLIO
17.2.5 RECENT DEVELOPMENT
17.3 UPL
17.3.1 COMPANY SNAPSHOT
17.3.2 REVENUE ANALYSIS
17.3.3 COMPANY SHARE ANALYSIS
17.3.4 PRODUCT PORTFOLIO
17.3.5 RECENT DEVELOPMENT
17.4 SYNGENTA
17.4.1 COMPANY SNAPSHOT
17.4.2 COMPANY SHARE ANALYSIS
17.4.3 PRODUCT PORTFOLIO
17.4.4 RECENT DEVELOPMENT
17.5 BASF
17.5.1 COMPANY SNAPSHOT
17.5.2 REVENUE ANALYSIS
17.5.3 COMPANY SHARE ANALYSIS
17.5.4 PRODUCT PORTFOLIO
17.5.5 RECENT DEVELOPMENT
17.6 AG BIOTECH, INC.
17.6.1 COMPANY SNAPSHOT
17.6.2 PRODUCT PORTFOLIO
17.6.3 RECENT DEVELOPMENT
17.7 AGRICEN
17.7.1 COMPANY SNAPSHOT
17.7.2 PRODUCT PORTFOLIO
17.7.3 RECENT DEVELOPMENT
17.8 ATLÁNTICA AGRÍCOLA
17.8.1 COMPANY SNAPSHOT
17.8.2 PRODUCT PORTFOLIO
17.8.3 RECENT DEVELOPMENT
17.9 BAYER AG
17.9.1 COMPANY SNAPSHOT
17.9.2 REVENUE ANALYSIS
17.9.3 PRODUCT PORTFOLIO
17.9.4 RECENT DEVELOPMENT
17.1 BIOSTADT.
17.10.1 COMPANY SNAPSHOT
17.10.2 PRODUCT PORTFOLIO
17.10.3 RECENT DEVELOPMENT
17.11 COROMANDEL INTERNATIONAL LTD.
17.11.1 COMPANY SNAPSHOT
17.11.2 REVENUE ANALYSIS
17.11.3 PRODUCT PORTFOLIO
17.11.4 RECENT DEVELOPMENT
17.12 FMC CORPORATION
17.12.1 COMPANY SNAPSHOT
17.12.2 REVENUE ANALYSIS
17.12.3 PRODUCT PORTFOLIO
17.12.4 RECENT DEVELOPMENT
17.13 HAIFA NEGEV TECHNOLOGIES LTD.
17.13.1 COMPANY SNAPSHOT
17.13.2 PRODUCT PORTFOLIO
17.13.3 RECENT DEVELOPMENT
17.14 ILSA S.P.A.
17.14.1 COMPANY SNAPSHOT
17.14.2 PRODUCT PORTFOLIO
17.14.3 RECENT DEVELOPMENT
17.15 REKA
17.15.1 COMPANY SNAPSHOT
17.15.2 PRODUCT PORTFOLIO
17.15.3 RECENT DEVELOPMENT
17.16 TSTANES.
17.16.1 COMPANY SNAPSHOT
17.16.2 REVENUE ANALYSIS
17.16.3 PRODUCT PORTFOLIO
17.16.4 RECENT DEVELOPMENT
18 QUESTIONNAIRE
List of Table
TABLE 1 COMPANY PRODUCTION CAPACITY
TABLE 2 ASIA-PACIFIC BIOSTIMULANTS MARKET, BY ORIGIN, 2018-2033 (USD THOUSAND)
TABLE 3 ASIA-PACIFIC BIOSTIMULANTS MARKET, BY ORIGIN, 2018-2033 (TONS)
TABLE 4 ASIA-PACIFIC NATURAL BIOSTIMULANTS IN BIOSTIMULANTS MARKET, BY REGION, 2018-2033 (USD THOUSAND)
TABLE 5 ASIA-PACIFIC NATURAL BIOSTIMULANTS IN BIOSTIMULANTS MARKET, BY FORM, 2018-2033 (USD THOUSAND)
TABLE 6 ASIA-PACIFIC LIQUID IN BIOSTIMULANTS MARKET, BY TYPE, 2018-2033 (USD THOUSAND)
TABLE 7 ASIA-PACIFIC DRY IN BIOSTIMULANTS MARKET, BY TYPE, 2018-2033 (USD THOUSAND)
TABLE 8 ASIA-PACIFIC SYNTHETIC BIOSTIMULANTS IN BIOSTIMULANTS MARKET, BY REGION, 2018-2033 (USD THOUSAND)
TABLE 9 ASIA-PACIFIC SYNTHETIC BIOSTIMULANTS IN BIOSTIMULANTS MARKET, BY FORM, 2018-2033 (USD THOUSAND)
TABLE 10 ASIA-PACIFIC LIQUID IN BIOSTIMULANTS MARKET, BY TYPE, 2018-2033 (USD THOUSAND)
TABLE 11 ASIA-PACIFIC DRY IN BIOSTIMULANTS MARKET, BY TYPE, 2018-2033 (USD THOUSAND)
TABLE 12 ASIA-PACIFIC BIOSTIMULANTS MARKET, BY FORM, 2018-2033 (USD THOUSAND)
TABLE 13 ASIA-PACIFIC LIQUID IN BIOSTIMULANTS MARKET, BY REGION, 2018-2033 (USD THOUSAND)
TABLE 14 ASIA-PACIFIC LIQUID IN BIOSTIMULANTS MARKET, BY TYPE, 2018-2033 (USD THOUSAND)
TABLE 15 ASIA-PACIFIC DRY IN BIOSTIMULANTS MARKET, BY REGION, 2018-2033 (USD THOUSAND)
TABLE 16 ASIA-PACIFIC DRY IN BIOSTIMULANTS MARKET, BY TYPE, 2018-2033 (USD THOUSAND)
TABLE 17 ASIA-PACIFIC BIOSTIMULANTS MARKET, BY ORIGIN, 2018-2033 (USD THOUSAND)
TABLE 18 ASIA-PACIFIC ACID BASED IN BIOSTIMULANTS MARKET, BY REGION, 2018-2033 (USD THOUSAND)
TABLE 19 ASIA-PACIFIC ACID BASED IN BIOSTIMULANTS MARKET, BY TYPE, 2018-2033 (USD THOUSAND)
TABLE 20 ASIA-PACIFIC EXTRACT BASED IN BIOSTIMULANTS MARKET, BY REGION, 2018-2033 (USD THOUSAND)
TABLE 21 ASIA-PACIFIC EXTRACT BASED IN BIOSTIMULANTS MARKET, BY TYPE, 2018-2033 (USD THOUSAND)
TABLE 22 ASIA-PACIFIC PROTEIN HYDROLYSATES IN BIOSTIMULANTS MARKET, BY REGION, 2018-2033 (USD THOUSAND)
TABLE 23 ASIA-PACIFIC MICROBIAL AMENDMENTS IN BIOSTIMULANTS MARKET, BY REGION, 2018-2033 (USD THOUSAND)
TABLE 24 ASIA-PACIFIC CHITIN IN BIOSTIMULANTS MARKET, BY REGION, 2018-2033 (USD THOUSAND)
TABLE 25 ASIA-PACIFIC CHITOSAN IN BIOSTIMULANTS MARKET, BY REGION, 2018-2033 (USD THOUSAND)
TABLE 26 ASIA-PACIFIC B-VITAMINS IN BIOSTIMULANTS MARKET, BY REGION, 2018-2033 (USD THOUSAND)
TABLE 27 ASIA-PACIFIC OTHERS IN BIOSTIMULANTS MARKET, BY REGION, 2018-2033 (USD THOUSAND)
TABLE 28 ASIA-PACIFIC BIOSTIMULANTS MARKET, BY CROP, 2018-2033 (USD THOUSAND)
TABLE 29 ASIA-PACIFIC FRUITS & VEGETABLES IN BIOSTIMULANTS MARKET, BY REGION, 2018-2033 (USD THOUSAND)
TABLE 30 ASIA-PACIFIC FRUITS & VEGETABLES IN BIOSTIMULANTS MARKET, BY FRUITS, 2018-2033 (USD THOUSAND)
TABLE 31 ASIA-PACIFIC FRUITS & VEGETABLES IN BIOSTIMULANTS MARKET, BY VEGETABLE, 2018-2033 (USD THOUSAND)
TABLE 32 ASIA-PACIFIC CEREALS & GRAINS IN BIOSTIMULANTS MARKET, BY REGION, 2018-2033 (USD THOUSAND)
TABLE 33 ASIA-PACIFIC CEREALS & GRAINS IN BIOSTIMULANTS MARKET, BY TYPE, 2018-2033 (USD THOUSAND)
TABLE 34 ASIA-PACIFIC OILSEEDS & PULSES IN BIOSTIMULANTS MARKET, BY REGION, 2018-2033 (USD THOUSAND)
TABLE 35 ASIA-PACIFIC OILSEEDS & PULSES IN BIOSTIMULANTS MARKET, BY TYPE, 2018-2033 (USD THOUSAND)
TABLE 36 ASIA-PACIFIC TURF & ORNAMENTALS IN BIOSTIMULANTS MARKET, BY REGION, 2018-2033 (USD THOUSAND)
TABLE 37 ASIA-PACIFIC OTHER CROPS IN BIOSTIMULANTS MARKET, BY REGION, 2018-2033 (USD THOUSAND)
TABLE 38 ASIA-PACIFIC BIOSTIMULANTS MARKET, BY APPLICATION METHOD, 2018-2033 (USD THOUSAND)
TABLE 39 ASIA-PACIFIC FOLIAR TREATMENT IN BIOSTIMULANTS MARKET, BY REGION, 2018-2033 (USD THOUSAND)
TABLE 40 ASIA-PACIFIC SOIL TREATMENT IN BIOSTIMULANTS MARKET, BY REGION, 2018-2033 (USD THOUSAND)
TABLE 41 ASIA-PACIFIC SEED TREATMENT IN BIOSTIMULANTS MARKET, BY REGION, 2018-2033 (USD THOUSAND)
TABLE 42 ASIA-PACIFIC BIOSTIMULANTS MARKET, BY END USER, 2018-2033 (USD THOUSAND)
TABLE 43 ASIA-PACIFIC FARMERS IN BIOSTIMULANTS MARKET, BY REGION, 2018-2033 (USD THOUSAND)
TABLE 44 ASIA-PACIFIC RESEARCH INSTITUTES IN BIOSTIMULANTS MARKET, BY REGION, 2018-2033 (USD THOUSAND)
TABLE 45 ASIA-PACIFIC BIOSTIMULANTS MARKET, BY COUNTRY, 2018-2033 (USD THOUSAND)
TABLE 46 ASIA-PACIFIC BIOSTIMULANTS MARKET, BY COUNTRY, 2018-2033 (USD THOUSAND)
TABLE 47 ASIA-PACIFIC BIOSTIMULANTS MARKET, BY COUNTRY, 2018-2033 (TONS)
TABLE 48 ASIA-PACIFIC
TABLE 49 ASIA-PACIFIC BIOSTIMULANTS MARKET, BY ORIGIN, 2018-2033 (USD THOUSAND)
TABLE 50 ASIA-PACIFIC BIOSTIMULANTS MARKET, BY ORIGIN, 2018-2033 (TONS)
TABLE 51 ASIA-PACIFIC NATURAL BIOSTIMULANTS IN BIOSTIMULANTS MARKET, BY FORM, 2018-2033 (USD THOUSAND)
TABLE 52 ASIA-PACIFIC LIQUID IN BIOSTIMULANTS MARKET, BY TYPE, 2018-2033 (USD THOUSAND)
TABLE 53 ASIA-PACIFIC DRY IN BIOSTIMULANTS MARKET, BY TYPE, 2018-2033 (USD THOUSAND)
TABLE 54 ASIA-PACIFIC SYNTHETIC BIOSTIMULANTS IN BIOSTIMULANTS MARKET, BY FORM, 2018-2033 (USD THOUSAND)
TABLE 55 ASIA-PACIFIC LIQUID IN BIOSTIMULANTS MARKET, BY TYPE, 2018-2033 (USD THOUSAND)
TABLE 56 ASIA-PACIFIC DRY IN BIOSTIMULANTS MARKET, BY TYPE, 2018-2033 (USD THOUSAND)
TABLE 57 ASIA-PACIFIC BIOSTIMULANTS MARKET, BY FORM, 2018-2033 (USD THOUSAND)
TABLE 58 ASIA-PACIFIC LIQUID IN BIOSTIMULANTS MARKET, BY TYPE, 2018-2033 (USD THOUSAND)
TABLE 59 ASIA-PACIFIC DRY IN BIOSTIMULANTS MARKET, BY TYPE, 2018-2033 (USD THOUSAND)
TABLE 60 ASIA-PACIFIC BIOSTIMULANTS MARKET, BY ACTIVE INGREDIENTS, 2018-2033 (USD THOUSAND)
TABLE 61 ASIA-PACIFIC ACID BASED IN BIOSTIMULANTS MARKET, BY TYPE, 2018-2033 (USD THOUSAND)
TABLE 62 ASIA-PACIFIC EXTRACT BASED IN BIOSTIMULANTS MARKET, BY TYPE, 2018-2033 (USD THOUSAND)
TABLE 63 ASIA-PACIFIC BIOSTIMULANTS MARKET, BY APPLICATION METHOD, 2018-2032 (USD THOUSAND)
TABLE 64 ASIA-PACIFIC BIOSTIMULANTS MARKET, BY CROP, 2018-2033 (USD THOUSAND)
TABLE 65 ASIA-PACIFIC FRUITS & VEGETABLES IN BIOSTIMULANTS MARKET, BY FRUITS, 2018-2033 (USD THOUSAND)
TABLE 66 ASIA-PACIFIC FRUITS & VEGETABLES IN BIOSTIMULANTS MARKET, BY VEGETABLE, 2018-2033 (USD THOUSAND)
TABLE 67 ASIA-PACIFIC CEREALS & GRAINS IN BIOSTIMULANTS MARKET, BY TYPE, 2018-2033 (USD THOUSAND)
TABLE 68 ASIA-PACIFIC OILSEEDS & PULSES IN BIOSTIMULANTS MARKET, BY TYPE, 2018-2033 (USD THOUSAND)
TABLE 69 ASIA-PACIFIC BIOSTIMULANTS MARKET, BY END USER, 2018-2033 (USD THOUSAND)
TABLE 70 CHINA BIOSTIMULANTS MARKET, BY ORIGIN, 2018-2033 (USD THOUSAND)
TABLE 71 CHINA BIOSTIMULANTS MARKET, BY ORIGIN, 2018-2033 (TONS)
TABLE 72 CHINA NATURAL BIOSTIMULANTS IN BIOSTIMULANTS MARKET, BY FORM, 2018-2033 (USD THOUSAND)
TABLE 73 CHINA LIQUID IN BIOSTIMULANTS MARKET, BY TYPE, 2018-2033 (USD THOUSAND)
TABLE 74 CHINA DRY IN BIOSTIMULANTS MARKET, BY TYPE, 2018-2033 (USD THOUSAND)
TABLE 75 CHINA SYNTHETIC BIOSTIMULANTS IN BIOSTIMULANTS MARKET, BY FORM, 2018-2033 (USD THOUSAND)
TABLE 76 CHINA LIQUID IN BIOSTIMULANTS MARKET, BY TYPE, 2018-2033 (USD THOUSAND)
TABLE 77 CHINA DRY IN BIOSTIMULANTS MARKET, BY TYPE, 2018-2033 (USD THOUSAND)
TABLE 78 CHINA BIOSTIMULANTS MARKET, BY FORM, 2018-2033 (USD THOUSAND)
TABLE 79 CHINA LIQUID IN BIOSTIMULANTS MARKET, BY TYPE, 2018-2033 (USD THOUSAND)
TABLE 80 CHINA DRY IN BIOSTIMULANTS MARKET, BY TYPE, 2018-2033 (USD THOUSAND)
TABLE 81 CHINA BIOSTIMULANTS MARKET, BY ACTIVE INGREDIENTS, 2018-2033 (USD THOUSAND)
TABLE 82 CHINA ACID BASED IN BIOSTIMULANTS MARKET, BY TYPE, 2018-2033 (USD THOUSAND)
TABLE 83 CHINA EXTRACT BASED IN BIOSTIMULANTS MARKET, BY TYPE, 2018-2033 (USD THOUSAND)
TABLE 84 CHINA BIOSTIMULANTS MARKET, BY APPLICATION METHOD, 2018-2032 (USD THOUSAND)
TABLE 85 CHINA BIOSTIMULANTS MARKET, BY CROP, 2018-2033 (USD THOUSAND)
TABLE 86 CHINA FRUITS & VEGETABLES IN BIOSTIMULANTS MARKET, BY FRUITS, 2018-2033 (USD THOUSAND)
TABLE 87 CHINA FRUITS & VEGETABLES IN BIOSTIMULANTS MARKET, BY VEGETABLE, 2018-2033 (USD THOUSAND)
TABLE 88 CHINA CEREALS & GRAINS IN BIOSTIMULANTS MARKET, BY TYPE, 2018-2033 (USD THOUSAND)
TABLE 89 CHINA OILSEEDS & PULSES IN BIOSTIMULANTS MARKET, BY TYPE, 2018-2033 (USD THOUSAND)
TABLE 90 CHINA BIOSTIMULANTS MARKET, BY END USER, 2018-2033 (USD THOUSAND)
TABLE 91 INDIA BIOSTIMULANTS MARKET, BY ORIGIN, 2018-2033 (USD THOUSAND)
TABLE 92 INDIA BIOSTIMULANTS MARKET, BY ORIGIN, 2018-2033 (TONS)
TABLE 93 INDIA NATURAL BIOSTIMULANTS IN BIOSTIMULANTS MARKET, BY FORM, 2018-2033 (USD THOUSAND)
TABLE 94 INDIA LIQUID IN BIOSTIMULANTS MARKET, BY TYPE, 2018-2033 (USD THOUSAND)
TABLE 95 INDIA DRY IN BIOSTIMULANTS MARKET, BY TYPE, 2018-2033 (USD THOUSAND)
TABLE 96 INDIA SYNTHETIC BIOSTIMULANTS IN BIOSTIMULANTS MARKET, BY FORM, 2018-2033 (USD THOUSAND)
TABLE 97 INDIA LIQUID IN BIOSTIMULANTS MARKET, BY TYPE, 2018-2033 (USD THOUSAND)
TABLE 98 INDIA DRY IN BIOSTIMULANTS MARKET, BY TYPE, 2018-2033 (USD THOUSAND)
TABLE 99 INDIA BIOSTIMULANTS MARKET, BY FORM, 2018-2033 (USD THOUSAND)
TABLE 100 INDIA LIQUID IN BIOSTIMULANTS MARKET, BY TYPE, 2018-2033 (USD THOUSAND)
TABLE 101 INDIA DRY IN BIOSTIMULANTS MARKET, BY TYPE, 2018-2033 (USD THOUSAND)
TABLE 102 INDIA BIOSTIMULANTS MARKET, BY ACTIVE INGREDIENTS, 2018-2033 (USD THOUSAND)
TABLE 103 INDIA ACID BASED IN BIOSTIMULANTS MARKET, BY TYPE, 2018-2033 (USD THOUSAND)
TABLE 104 INDIA EXTRACT BASED IN BIOSTIMULANTS MARKET, BY TYPE, 2018-2033 (USD THOUSAND)
TABLE 105 INDIA BIOSTIMULANTS MARKET, BY APPLICATION METHOD, 2018-2032 (USD THOUSAND)
TABLE 106 INDIA BIOSTIMULANTS MARKET, BY CROP, 2018-2033 (USD THOUSAND)
TABLE 107 INDIA FRUITS & VEGETABLES IN BIOSTIMULANTS MARKET, BY FRUITS, 2018-2033 (USD THOUSAND)
TABLE 108 INDIA FRUITS & VEGETABLES IN BIOSTIMULANTS MARKET, BY VEGETABLE, 2018-2033 (USD THOUSAND)
TABLE 109 INDIA CEREALS & GRAINS IN BIOSTIMULANTS MARKET, BY TYPE, 2018-2033 (USD THOUSAND)
TABLE 110 INDIA OILSEEDS & PULSES IN BIOSTIMULANTS MARKET, BY TYPE, 2018-2033 (USD THOUSAND)
TABLE 111 INDIA BIOSTIMULANTS MARKET, BY END USER, 2018-2033 (USD THOUSAND)
TABLE 112 AUSTRALIA BIOSTIMULANTS MARKET, BY ORIGIN, 2018-2033 (USD THOUSAND)
TABLE 113 AUSTRALIA BIOSTIMULANTS MARKET, BY ORIGIN, 2018-2033 (TONS)
TABLE 114 AUSTRALIA NATURAL BIOSTIMULANTS IN BIOSTIMULANTS MARKET, BY FORM, 2018-2033 (USD THOUSAND)
TABLE 115 AUSTRALIA LIQUID IN BIOSTIMULANTS MARKET, BY TYPE, 2018-2033 (USD THOUSAND)
TABLE 116 AUSTRALIA DRY IN BIOSTIMULANTS MARKET, BY TYPE, 2018-2033 (USD THOUSAND)
TABLE 117 AUSTRALIA SYNTHETIC BIOSTIMULANTS IN BIOSTIMULANTS MARKET, BY FORM, 2018-2033 (USD THOUSAND)
TABLE 118 AUSTRALIA LIQUID IN BIOSTIMULANTS MARKET, BY TYPE, 2018-2033 (USD THOUSAND)
TABLE 119 AUSTRALIA DRY IN BIOSTIMULANTS MARKET, BY TYPE, 2018-2033 (USD THOUSAND)
TABLE 120 AUSTRALIA BIOSTIMULANTS MARKET, BY FORM, 2018-2033 (USD THOUSAND)
TABLE 121 AUSTRALIA LIQUID IN BIOSTIMULANTS MARKET, BY TYPE, 2018-2033 (USD THOUSAND)
TABLE 122 AUSTRALIA DRY IN BIOSTIMULANTS MARKET, BY TYPE, 2018-2033 (USD THOUSAND)
TABLE 123 AUSTRALIA BIOSTIMULANTS MARKET, BY ACTIVE INGREDIENTS, 2018-2033 (USD THOUSAND)
TABLE 124 AUSTRALIA ACID BASED IN BIOSTIMULANTS MARKET, BY TYPE, 2018-2033 (USD THOUSAND)
TABLE 125 AUSTRALIA EXTRACT BASED IN BIOSTIMULANTS MARKET, BY TYPE, 2018-2033 (USD THOUSAND)
TABLE 126 AUSTRALIA BIOSTIMULANTS MARKET, BY APPLICATION METHOD, 2018-2032 (USD THOUSAND)
TABLE 127 AUSTRALIA BIOSTIMULANTS MARKET, BY CROP, 2018-2033 (USD THOUSAND)
TABLE 128 AUSTRALIA FRUITS & VEGETABLES IN BIOSTIMULANTS MARKET, BY FRUITS, 2018-2033 (USD THOUSAND)
TABLE 129 AUSTRALIA FRUITS & VEGETABLES IN BIOSTIMULANTS MARKET, BY VEGETABLE, 2018-2033 (USD THOUSAND)
TABLE 130 AUSTRALIA CEREALS & GRAINS IN BIOSTIMULANTS MARKET, BY TYPE, 2018-2033 (USD THOUSAND)
TABLE 131 AUSTRALIA OILSEEDS & PULSES IN BIOSTIMULANTS MARKET, BY TYPE, 2018-2033 (USD THOUSAND)
TABLE 132 AUSTRALIA BIOSTIMULANTS MARKET, BY END USER, 2018-2033 (USD THOUSAND)
TABLE 133 JAPAN BIOSTIMULANTS MARKET, BY ORIGIN, 2018-2033 (USD THOUSAND)
TABLE 134 JAPAN BIOSTIMULANTS MARKET, BY ORIGIN, 2018-2033 (TONS)
TABLE 135 JAPAN NATURAL BIOSTIMULANTS IN BIOSTIMULANTS MARKET, BY FORM, 2018-2033 (USD THOUSAND)
TABLE 136 JAPAN LIQUID IN BIOSTIMULANTS MARKET, BY TYPE, 2018-2033 (USD THOUSAND)
TABLE 137 JAPAN DRY IN BIOSTIMULANTS MARKET, BY TYPE, 2018-2033 (USD THOUSAND)
TABLE 138 JAPAN SYNTHETIC BIOSTIMULANTS IN BIOSTIMULANTS MARKET, BY FORM, 2018-2033 (USD THOUSAND)
TABLE 139 JAPAN LIQUID IN BIOSTIMULANTS MARKET, BY TYPE, 2018-2033 (USD THOUSAND)
TABLE 140 JAPAN DRY IN BIOSTIMULANTS MARKET, BY TYPE, 2018-2033 (USD THOUSAND)
TABLE 141 JAPAN BIOSTIMULANTS MARKET, BY FORM, 2018-2033 (USD THOUSAND)
TABLE 142 JAPAN LIQUID IN BIOSTIMULANTS MARKET, BY TYPE, 2018-2033 (USD THOUSAND)
TABLE 143 JAPAN DRY IN BIOSTIMULANTS MARKET, BY TYPE, 2018-2033 (USD THOUSAND)
TABLE 144 JAPAN BIOSTIMULANTS MARKET, BY ACTIVE INGREDIENTS, 2018-2033 (USD THOUSAND)
TABLE 145 JAPAN ACID BASED IN BIOSTIMULANTS MARKET, BY TYPE, 2018-2033 (USD THOUSAND)
TABLE 146 JAPAN EXTRACT BASED IN BIOSTIMULANTS MARKET, BY TYPE, 2018-2033 (USD THOUSAND)
TABLE 147 JAPAN BIOSTIMULANTS MARKET, BY APPLICATION METHOD, 2018-2032 (USD THOUSAND)
TABLE 148 JAPAN BIOSTIMULANTS MARKET, BY CROP, 2018-2033 (USD THOUSAND)
TABLE 149 JAPAN FRUITS & VEGETABLES IN BIOSTIMULANTS MARKET, BY FRUITS, 2018-2033 (USD THOUSAND)
TABLE 150 JAPAN FRUITS & VEGETABLES IN BIOSTIMULANTS MARKET, BY VEGETABLE, 2018-2033 (USD THOUSAND)
TABLE 151 JAPAN CEREALS & GRAINS IN BIOSTIMULANTS MARKET, BY TYPE, 2018-2033 (USD THOUSAND)
TABLE 152 JAPAN OILSEEDS & PULSES IN BIOSTIMULANTS MARKET, BY TYPE, 2018-2033 (USD THOUSAND)
TABLE 153 JAPAN BIOSTIMULANTS MARKET, BY END USER, 2018-2033 (USD THOUSAND)
TABLE 154 INDONESIA BIOSTIMULANTS MARKET, BY ORIGIN, 2018-2033 (USD THOUSAND)
TABLE 155 INDONESIA BIOSTIMULANTS MARKET, BY ORIGIN, 2018-2033 (TONS)
TABLE 156 INDONESIA NATURAL BIOSTIMULANTS IN BIOSTIMULANTS MARKET, BY FORM, 2018-2033 (USD THOUSAND)
TABLE 157 INDONESIA LIQUID IN BIOSTIMULANTS MARKET, BY TYPE, 2018-2033 (USD THOUSAND)
TABLE 158 INDONESIA DRY IN BIOSTIMULANTS MARKET, BY TYPE, 2018-2033 (USD THOUSAND)
TABLE 159 INDONESIA SYNTHETIC BIOSTIMULANTS IN BIOSTIMULANTS MARKET, BY FORM, 2018-2033 (USD THOUSAND)
TABLE 160 INDONESIA LIQUID IN BIOSTIMULANTS MARKET, BY TYPE, 2018-2033 (USD THOUSAND)
TABLE 161 INDONESIA DRY IN BIOSTIMULANTS MARKET, BY TYPE, 2018-2033 (USD THOUSAND)
TABLE 162 INDONESIA BIOSTIMULANTS MARKET, BY FORM, 2018-2033 (USD THOUSAND)
TABLE 163 INDONESIA LIQUID IN BIOSTIMULANTS MARKET, BY TYPE, 2018-2033 (USD THOUSAND)
TABLE 164 INDONESIA DRY IN BIOSTIMULANTS MARKET, BY TYPE, 2018-2033 (USD THOUSAND)
TABLE 165 INDONESIA BIOSTIMULANTS MARKET, BY ACTIVE INGREDIENTS, 2018-2033 (USD THOUSAND)
TABLE 166 INDONESIA ACID BASED IN BIOSTIMULANTS MARKET, BY TYPE, 2018-2033 (USD THOUSAND)
TABLE 167 INDONESIA EXTRACT BASED IN BIOSTIMULANTS MARKET, BY TYPE, 2018-2033 (USD THOUSAND)
TABLE 168 INDONESIA BIOSTIMULANTS MARKET, BY APPLICATION METHOD, 2018-2032 (USD THOUSAND)
TABLE 169 INDONESIA BIOSTIMULANTS MARKET, BY CROP, 2018-2033 (USD THOUSAND)
TABLE 170 INDONESIA FRUITS & VEGETABLES IN BIOSTIMULANTS MARKET, BY FRUITS, 2018-2033 (USD THOUSAND)
TABLE 171 INDONESIA FRUITS & VEGETABLES IN BIOSTIMULANTS MARKET, BY VEGETABLE, 2018-2033 (USD THOUSAND)
TABLE 172 INDONESIA CEREALS & GRAINS IN BIOSTIMULANTS MARKET, BY TYPE, 2018-2033 (USD THOUSAND)
TABLE 173 INDONESIA OILSEEDS & PULSES IN BIOSTIMULANTS MARKET, BY TYPE, 2018-2033 (USD THOUSAND)
TABLE 174 INDONESIA BIOSTIMULANTS MARKET, BY END USER, 2018-2033 (USD THOUSAND)
TABLE 175 SOUTH KOREA BIOSTIMULANTS MARKET, BY ORIGIN, 2018-2033 (USD THOUSAND)
TABLE 176 SOUTH KOREA BIOSTIMULANTS MARKET, BY ORIGIN, 2018-2033 (TONS)
TABLE 177 SOUTH KOREA NATURAL BIOSTIMULANTS IN BIOSTIMULANTS MARKET, BY FORM, 2018-2033 (USD THOUSAND)
TABLE 178 SOUTH KOREA LIQUID IN BIOSTIMULANTS MARKET, BY TYPE, 2018-2033 (USD THOUSAND)
TABLE 179 SOUTH KOREA DRY IN BIOSTIMULANTS MARKET, BY TYPE, 2018-2033 (USD THOUSAND)
TABLE 180 SOUTH KOREA SYNTHETIC BIOSTIMULANTS IN BIOSTIMULANTS MARKET, BY FORM, 2018-2033 (USD THOUSAND)
TABLE 181 SOUTH KOREA LIQUID IN BIOSTIMULANTS MARKET, BY TYPE, 2018-2033 (USD THOUSAND)
TABLE 182 SOUTH KOREA DRY IN BIOSTIMULANTS MARKET, BY TYPE, 2018-2033 (USD THOUSAND)
TABLE 183 SOUTH KOREA BIOSTIMULANTS MARKET, BY FORM, 2018-2033 (USD THOUSAND)
TABLE 184 SOUTH KOREA LIQUID IN BIOSTIMULANTS MARKET, BY TYPE, 2018-2033 (USD THOUSAND)
TABLE 185 SOUTH KOREA DRY IN BIOSTIMULANTS MARKET, BY TYPE, 2018-2033 (USD THOUSAND)
TABLE 186 SOUTH KOREA BIOSTIMULANTS MARKET, BY ACTIVE INGREDIENTS, 2018-2033 (USD THOUSAND)
TABLE 187 SOUTH KOREA ACID BASED IN BIOSTIMULANTS MARKET, BY TYPE, 2018-2033 (USD THOUSAND)
TABLE 188 SOUTH KOREA EXTRACT BASED IN BIOSTIMULANTS MARKET, BY TYPE, 2018-2033 (USD THOUSAND)
TABLE 189 SOUTH KOREA BIOSTIMULANTS MARKET, BY APPLICATION METHOD, 2018-2032 (USD THOUSAND)
TABLE 190 SOUTH KOREA BIOSTIMULANTS MARKET, BY CROP, 2018-2033 (USD THOUSAND)
TABLE 191 SOUTH KOREA FRUITS & VEGETABLES IN BIOSTIMULANTS MARKET, BY FRUITS, 2018-2033 (USD THOUSAND)
TABLE 192 SOUTH KOREA FRUITS & VEGETABLES IN BIOSTIMULANTS MARKET, BY VEGETABLE, 2018-2033 (USD THOUSAND)
TABLE 193 SOUTH KOREA CEREALS & GRAINS IN BIOSTIMULANTS MARKET, BY TYPE, 2018-2033 (USD THOUSAND)
TABLE 194 SOUTH KOREA OILSEEDS & PULSES IN BIOSTIMULANTS MARKET, BY TYPE, 2018-2033 (USD THOUSAND)
TABLE 195 SOUTH KOREA BIOSTIMULANTS MARKET, BY END USER, 2018-2033 (USD THOUSAND)
TABLE 196 THAILAND BIOSTIMULANTS MARKET, BY ORIGIN, 2018-2033 (USD THOUSAND)
TABLE 197 THAILAND BIOSTIMULANTS MARKET, BY ORIGIN, 2018-2033 (TONS)
TABLE 198 THAILAND NATURAL BIOSTIMULANTS IN BIOSTIMULANTS MARKET, BY FORM, 2018-2033 (USD THOUSAND)
TABLE 199 THAILAND LIQUID IN BIOSTIMULANTS MARKET, BY TYPE, 2018-2033 (USD THOUSAND)
TABLE 200 THAILAND DRY IN BIOSTIMULANTS MARKET, BY TYPE, 2018-2033 (USD THOUSAND)
TABLE 201 THAILAND SYNTHETIC BIOSTIMULANTS IN BIOSTIMULANTS MARKET, BY FORM, 2018-2033 (USD THOUSAND)
TABLE 202 THAILAND LIQUID IN BIOSTIMULANTS MARKET, BY TYPE, 2018-2033 (USD THOUSAND)
TABLE 203 THAILAND DRY IN BIOSTIMULANTS MARKET, BY TYPE, 2018-2033 (USD THOUSAND)
TABLE 204 THAILAND BIOSTIMULANTS MARKET, BY FORM, 2018-2033 (USD THOUSAND)
TABLE 205 THAILAND LIQUID IN BIOSTIMULANTS MARKET, BY TYPE, 2018-2033 (USD THOUSAND)
TABLE 206 THAILAND DRY IN BIOSTIMULANTS MARKET, BY TYPE, 2018-2033 (USD THOUSAND)
TABLE 207 THAILAND BIOSTIMULANTS MARKET, BY ACTIVE INGREDIENTS, 2018-2033 (USD THOUSAND)
TABLE 208 THAILAND ACID BASED IN BIOSTIMULANTS MARKET, BY TYPE, 2018-2033 (USD THOUSAND)
TABLE 209 THAILAND EXTRACT BASED IN BIOSTIMULANTS MARKET, BY TYPE, 2018-2033 (USD THOUSAND)
TABLE 210 THAILAND BIOSTIMULANTS MARKET, BY APPLICATION METHOD, 2018-2032 (USD THOUSAND)
TABLE 211 THAILAND BIOSTIMULANTS MARKET, BY CROP, 2018-2033 (USD THOUSAND)
TABLE 212 THAILAND FRUITS & VEGETABLES IN BIOSTIMULANTS MARKET, BY FRUITS, 2018-2033 (USD THOUSAND)
TABLE 213 THAILAND FRUITS & VEGETABLES IN BIOSTIMULANTS MARKET, BY VEGETABLE, 2018-2033 (USD THOUSAND)
TABLE 214 THAILAND CEREALS & GRAINS IN BIOSTIMULANTS MARKET, BY TYPE, 2018-2033 (USD THOUSAND)
TABLE 215 THAILAND OILSEEDS & PULSES IN BIOSTIMULANTS MARKET, BY TYPE, 2018-2033 (USD THOUSAND)
TABLE 216 THAILAND BIOSTIMULANTS MARKET, BY END USER, 2018-2033 (USD THOUSAND)
TABLE 217 MALAYSIA BIOSTIMULANTS MARKET, BY ORIGIN, 2018-2033 (USD THOUSAND)
TABLE 218 MALAYSIA BIOSTIMULANTS MARKET, BY ORIGIN, 2018-2033 (TONS)
TABLE 219 MALAYSIA NATURAL BIOSTIMULANTS IN BIOSTIMULANTS MARKET, BY FORM, 2018-2033 (USD THOUSAND)
TABLE 220 MALAYSIA LIQUID IN BIOSTIMULANTS MARKET, BY TYPE, 2018-2033 (USD THOUSAND)
TABLE 221 MALAYSIA DRY IN BIOSTIMULANTS MARKET, BY TYPE, 2018-2033 (USD THOUSAND)
TABLE 222 MALAYSIA SYNTHETIC BIOSTIMULANTS IN BIOSTIMULANTS MARKET, BY FORM, 2018-2033 (USD THOUSAND)
TABLE 223 MALAYSIA LIQUID IN BIOSTIMULANTS MARKET, BY TYPE, 2018-2033 (USD THOUSAND)
TABLE 224 MALAYSIA DRY IN BIOSTIMULANTS MARKET, BY TYPE, 2018-2033 (USD THOUSAND)
TABLE 225 MALAYSIA BIOSTIMULANTS MARKET, BY FORM, 2018-2033 (USD THOUSAND)
TABLE 226 MALAYSIA LIQUID IN BIOSTIMULANTS MARKET, BY TYPE, 2018-2033 (USD THOUSAND)
TABLE 227 MALAYSIA DRY IN BIOSTIMULANTS MARKET, BY TYPE, 2018-2033 (USD THOUSAND)
TABLE 228 MALAYSIA BIOSTIMULANTS MARKET, BY ACTIVE INGREDIENTS, 2018-2033 (USD THOUSAND)
TABLE 229 MALAYSIA ACID BASED IN BIOSTIMULANTS MARKET, BY TYPE, 2018-2033 (USD THOUSAND)
TABLE 230 MALAYSIA EXTRACT BASED IN BIOSTIMULANTS MARKET, BY TYPE, 2018-2033 (USD THOUSAND)
TABLE 231 MALAYSIA BIOSTIMULANTS MARKET, BY APPLICATION METHOD, 2018-2032 (USD THOUSAND)
TABLE 232 MALAYSIA BIOSTIMULANTS MARKET, BY CROP, 2018-2033 (USD THOUSAND)
TABLE 233 MALAYSIA FRUITS & VEGETABLES IN BIOSTIMULANTS MARKET, BY FRUITS, 2018-2033 (USD THOUSAND)
TABLE 234 MALAYSIA FRUITS & VEGETABLES IN BIOSTIMULANTS MARKET, BY VEGETABLE, 2018-2033 (USD THOUSAND)
TABLE 235 MALAYSIA CEREALS & GRAINS IN BIOSTIMULANTS MARKET, BY TYPE, 2018-2033 (USD THOUSAND)
MALAYSIA OILSEEDS & PULSES IN BIOSTIMULANTS MARKET, BY TYPE, 2018-2033 (USD THOUSAND) 231
TABLE 236 MALAYSIA BIOSTIMULANTS MARKET, BY END USER, 2018-2033 (USD THOUSAND)
TABLE 237 PHILIPPINES BIOSTIMULANTS MARKET, BY ORIGIN, 2018-2033 (USD THOUSAND)
TABLE 238 PHILIPPINES BIOSTIMULANTS MARKET, BY ORIGIN, 2018-2033 (TONS)
TABLE 239 PHILIPPINES NATURAL BIOSTIMULANTS IN BIOSTIMULANTS MARKET, BY FORM, 2018-2033 (USD THOUSAND)
TABLE 240 PHILIPPINES LIQUID IN BIOSTIMULANTS MARKET, BY TYPE, 2018-2033 (USD THOUSAND)
TABLE 241 PHILIPPINES DRY IN BIOSTIMULANTS MARKET, BY TYPE, 2018-2033 (USD THOUSAND)
TABLE 242 PHILIPPINES SYNTHETIC BIOSTIMULANTS IN BIOSTIMULANTS MARKET, BY FORM, 2018-2033 (USD THOUSAND)
TABLE 243 PHILIPPINES LIQUID IN BIOSTIMULANTS MARKET, BY TYPE, 2018-2033 (USD THOUSAND)
TABLE 244 PHILIPPINES DRY IN BIOSTIMULANTS MARKET, BY TYPE, 2018-2033 (USD THOUSAND)
TABLE 245 PHILIPPINES BIOSTIMULANTS MARKET, BY FORM, 2018-2033 (USD THOUSAND)
TABLE 246 PHILIPPINES LIQUID IN BIOSTIMULANTS MARKET, BY TYPE, 2018-2033 (USD THOUSAND)
TABLE 247 PHILIPPINES DRY IN BIOSTIMULANTS MARKET, BY TYPE, 2018-2033 (USD THOUSAND)
TABLE 248 PHILIPPINES BIOSTIMULANTS MARKET, BY ACTIVE INGREDIENTS, 2018-2033 (USD THOUSAND)
TABLE 249 PHILIPPINES ACID BASED IN BIOSTIMULANTS MARKET, BY TYPE, 2018-2033 (USD THOUSAND)
TABLE 250 PHILIPPINES EXTRACT BASED IN BIOSTIMULANTS MARKET, BY TYPE, 2018-2033 (USD THOUSAND)
TABLE 251 PHILIPPINES BIOSTIMULANTS MARKET, BY APPLICATION METHOD, 2018-2032 (USD THOUSAND)
TABLE 252 PHILIPPINES BIOSTIMULANTS MARKET, BY CROP, 2018-2033 (USD THOUSAND)
TABLE 253 PHILIPPINES FRUITS & VEGETABLES IN BIOSTIMULANTS MARKET, BY FRUITS, 2018-2033 (USD THOUSAND)
TABLE 254 PHILIPPINES FRUITS & VEGETABLES IN BIOSTIMULANTS MARKET, BY VEGETABLE, 2018-2033 (USD THOUSAND)
TABLE 255 PHILIPPINES CEREALS & GRAINS IN BIOSTIMULANTS MARKET, BY TYPE, 2018-2033 (USD THOUSAND)
TABLE 256 PHILIPPINES OILSEEDS & PULSES IN BIOSTIMULANTS MARKET, BY TYPE, 2018-2033 (USD THOUSAND)
TABLE 257 PHILIPPINES BIOSTIMULANTS MARKET, BY END USER, 2018-2033 (USD THOUSAND)
TABLE 258 SINGAPORE BIOSTIMULANTS MARKET, BY ORIGIN, 2018-2033 (USD THOUSAND)
TABLE 259 SINGAPORE BIOSTIMULANTS MARKET, BY ORIGIN, 2018-2033 (TONS)
TABLE 260 SINGAPORE NATURAL BIOSTIMULANTS IN BIOSTIMULANTS MARKET, BY FORM, 2018-2033 (USD THOUSAND)
TABLE 261 SINGAPORE LIQUID IN BIOSTIMULANTS MARKET, BY TYPE, 2018-2033 (USD THOUSAND)
TABLE 262 SINGAPORE DRY IN BIOSTIMULANTS MARKET, BY TYPE, 2018-2033 (USD THOUSAND)
TABLE 263 SINGAPORE SYNTHETIC BIOSTIMULANTS IN BIOSTIMULANTS MARKET, BY FORM, 2018-2033 (USD THOUSAND)
TABLE 264 SINGAPORE LIQUID IN BIOSTIMULANTS MARKET, BY TYPE, 2018-2033 (USD THOUSAND)
TABLE 265 SINGAPORE DRY IN BIOSTIMULANTS MARKET, BY TYPE, 2018-2033 (USD THOUSAND)
TABLE 266 SINGAPORE BIOSTIMULANTS MARKET, BY FORM, 2018-2033 (USD THOUSAND)
TABLE 267 SINGAPORE LIQUID IN BIOSTIMULANTS MARKET, BY TYPE, 2018-2033 (USD THOUSAND)
TABLE 268 SINGAPORE DRY IN BIOSTIMULANTS MARKET, BY TYPE, 2018-2033 (USD THOUSAND)
TABLE 269 SINGAPORE BIOSTIMULANTS MARKET, BY ACTIVE INGREDIENTS, 2018-2033 (USD THOUSAND)
TABLE 270 SINGAPORE ACID BASED IN BIOSTIMULANTS MARKET, BY TYPE, 2018-2033 (USD THOUSAND)
TABLE 271 SINGAPORE EXTRACT BASED IN BIOSTIMULANTS MARKET, BY TYPE, 2018-2033 (USD THOUSAND)
TABLE 272 SINGAPORE BIOSTIMULANTS MARKET, BY APPLICATION METHOD, 2018-2032 (USD THOUSAND)
TABLE 273 SINGAPORE BIOSTIMULANTS MARKET, BY CROP, 2018-2033 (USD THOUSAND)
TABLE 274 SINGAPORE FRUITS & VEGETABLES IN BIOSTIMULANTS MARKET, BY FRUITS, 2018-2033 (USD THOUSAND)
TABLE 275 SINGAPORE FRUITS & VEGETABLES IN BIOSTIMULANTS MARKET, BY VEGETABLE, 2018-2033 (USD THOUSAND)
TABLE 276 SINGAPORE CEREALS & GRAINS IN BIOSTIMULANTS MARKET, BY TYPE, 2018-2033 (USD THOUSAND)
TABLE 277 SINGAPORE OILSEEDS & PULSES IN BIOSTIMULANTS MARKET, BY TYPE, 2018-2033 (USD THOUSAND)
TABLE 278 SINGAPORE BIOSTIMULANTS MARKET, BY END USER, 2018-2033 (USD THOUSAND)
TABLE 279 NEW ZEALAND BIOSTIMULANTS MARKET, BY ORIGIN, 2018-2033 (USD THOUSAND)
TABLE 280 NEW ZEALAND BIOSTIMULANTS MARKET, BY ORIGIN, 2018-2033 (TONS)
TABLE 281 NEW ZEALAND NATURAL BIOSTIMULANTS IN BIOSTIMULANTS MARKET, BY FORM, 2018-2033 (USD THOUSAND)
TABLE 282 NEW ZEALAND LIQUID IN BIOSTIMULANTS MARKET, BY TYPE, 2018-2033 (USD THOUSAND)
TABLE 283 NEW ZEALAND DRY IN BIOSTIMULANTS MARKET, BY TYPE, 2018-2033 (USD THOUSAND)
TABLE 284 NEW ZEALAND SYNTHETIC BIOSTIMULANTS IN BIOSTIMULANTS MARKET, BY FORM, 2018-2033 (USD THOUSAND)
TABLE 285 NEW ZEALAND LIQUID IN BIOSTIMULANTS MARKET, BY TYPE, 2018-2033 (USD THOUSAND)
TABLE 286 NEW ZEALAND DRY IN BIOSTIMULANTS MARKET, BY TYPE, 2018-2033 (USD THOUSAND)
TABLE 287 NEW ZEALAND BIOSTIMULANTS MARKET, BY FORM, 2018-2033 (USD THOUSAND)
TABLE 288 NEW ZEALAND LIQUID IN BIOSTIMULANTS MARKET, BY TYPE, 2018-2033 (USD THOUSAND)
TABLE 289 NEW ZEALAND DRY IN BIOSTIMULANTS MARKET, BY TYPE, 2018-2033 (USD THOUSAND)
TABLE 290 NEW ZEALAND BIOSTIMULANTS MARKET, BY ACTIVE INGREDIENTS, 2018-2033 (USD THOUSAND)
TABLE 291 NEW ZEALAND ACID BASED IN BIOSTIMULANTS MARKET, BY TYPE, 2018-2033 (USD THOUSAND)
TABLE 292 NEW ZEALAND EXTRACT BASED IN BIOSTIMULANTS MARKET, BY TYPE, 2018-2033 (USD THOUSAND)
TABLE 293 NEW ZEALAND BIOSTIMULANTS MARKET, BY APPLICATION METHOD, 2018-2032 (USD THOUSAND)
TABLE 294 NEW ZEALAND BIOSTIMULANTS MARKET, BY CROP, 2018-2033 (USD THOUSAND)
TABLE 295 NEW ZEALAND FRUITS & VEGETABLES IN BIOSTIMULANTS MARKET, BY FRUITS, 2018-2033 (USD THOUSAND)
TABLE 296 NEW ZEALAND FRUITS & VEGETABLES IN BIOSTIMULANTS MARKET, BY VEGETABLE, 2018-2033 (USD THOUSAND)
TABLE 297 NEW ZEALAND CEREALS & GRAINS IN BIOSTIMULANTS MARKET, BY TYPE, 2018-2033 (USD THOUSAND)
TABLE 298 NEW ZEALAND OILSEEDS & PULSES IN BIOSTIMULANTS MARKET, BY TYPE, 2018-2033 (USD THOUSAND)
TABLE 299 NEW ZEALAND BIOSTIMULANTS MARKET, BY END USER, 2018-2033 (USD THOUSAND)
TABLE 300 REST OF ASIA-PACIFIC BIOSTIMULANTS MARKET, BY ORIGIN, 2018-2033 (USD THOUSAND)
TABLE 301 REST OF ASIA-PACIFIC BIOSTIMULANTS MARKET, BY ORIGIN, 2018-2033 (TONS)
TABLE 302 REST OF ASIA-PACIFIC NATURAL BIOSTIMULANTS IN BIOSTIMULANTS MARKET, BY FORM, 2018-2033 (USD THOUSAND)
TABLE 303 REST OF ASIA-PACIFIC LIQUID IN BIOSTIMULANTS MARKET, BY TYPE, 2018-2033 (USD THOUSAND)
TABLE 304 REST OF ASIA-PACIFIC DRY IN BIOSTIMULANTS MARKET, BY TYPE, 2018-2033 (USD THOUSAND)
TABLE 305 REST OF ASIA-PACIFIC SYNTHETIC BIOSTIMULANTS IN BIOSTIMULANTS MARKET, BY FORM, 2018-2033 (USD THOUSAND)
TABLE 306 REST OF ASIA-PACIFIC LIQUID IN BIOSTIMULANTS MARKET, BY TYPE, 2018-2033 (USD THOUSAND)
TABLE 307 REST OF ASIA-PACIFIC DRY IN BIOSTIMULANTS MARKET, BY TYPE, 2018-2033 (USD THOUSAND)
TABLE 308 REST OF ASIA-PACIFIC BIOSTIMULANTS MARKET, BY FORM, 2018-2033 (USD THOUSAND)
TABLE 309 REST OF ASIA-PACIFIC LIQUID IN BIOSTIMULANTS MARKET, BY TYPE, 2018-2033 (USD THOUSAND)
TABLE 310 REST OF ASIA-PACIFIC DRY IN BIOSTIMULANTS MARKET, BY TYPE, 2018-2033 (USD THOUSAND)
TABLE 311 REST OF ASIA-PACIFIC BIOSTIMULANTS MARKET, BY ACTIVE INGREDIENTS, 2018-2033 (USD THOUSAND)
TABLE 312 REST OF ASIA-PACIFIC ACID BASED IN BIOSTIMULANTS MARKET, BY TYPE, 2018-2033 (USD THOUSAND)
TABLE 313 REST OF ASIA-PACIFIC EXTRACT BASED IN BIOSTIMULANTS MARKET, BY TYPE, 2018-2033 (USD THOUSAND)
TABLE 314 REST OF ASIA-PACIFIC BIOSTIMULANTS MARKET, BY APPLICATION METHOD, 2018-2032 (USD THOUSAND)
TABLE 315 REST OF ASIA-PACIFIC BIOSTIMULANTS MARKET, BY CROP, 2018-2033 (USD THOUSAND)
TABLE 316 REST OF ASIA-PACIFIC FRUITS & VEGETABLES IN BIOSTIMULANTS MARKET, BY FRUITS, 2018-2033 (USD THOUSAND)
TABLE 317 REST OF ASIA-PACIFIC FRUITS & VEGETABLES IN BIOSTIMULANTS MARKET, BY VEGETABLE, 2018-2033 (USD THOUSAND)
TABLE 318 REST OF ASIA-PACIFIC CEREALS & GRAINS IN BIOSTIMULANTS MARKET, BY TYPE, 2018-2033 (USD THOUSAND)
TABLE 319 REST OF ASIA-PACIFIC OILSEEDS & PULSES IN BIOSTIMULANTS MARKET, BY TYPE, 2018-2033 (USD THOUSAND)
TABLE 320 REST OF ASIA-PACIFIC BIOSTIMULANTS MARKET, BY END USER, 2018-2033 (USD THOUSAND)
List of Figure
FIGURE 1 ASIA-PACIFIC BIOSTIMULANTS MARKET: SEGMENTATION
FIGURE 2 ASIA-PACIFIC BIOSTIMULANTS MARKET: DATA TRIANGULATION
FIGURE 3 ASIA-PACIFIC BIOSTIMULANTS MARKET: DROC ANALYSIS
FIGURE 4 ASIA-PACIFIC BIOSTIMULANTS MARKET: ASIA-PACIFIC VS REGIONAL MARKET ANALYSIS
FIGURE 5 ASIA-PACIFIC BIOSTIMULANTS MARKET: COMPANY RESEARCH ANALYSIS
FIGURE 6 ASIA-PACIFIC BIOSTIMULANTS MARKET: INTERVIEW DEMOGRAPHICS
FIGURE 7 ASIA-PACIFIC BIOSTIMULANTS MARKET: DBMR MARKET POSITION GRID
FIGURE 8 ASIA-PACIFIC BIOSTIMULANTS MARKET: VENDOR SHARE ANALYSIS
FIGURE 9 ASIA-PACIFIC BIOSTIMULANTS MARKET: MULTIVARIATE MODELING
FIGURE 10 ASIA-PACIFIC BIOSTIMULANTS MARKET: TYPE TIMELINE CURVE
FIGURE 11 ASIA-PACIFIC BIOSTIMULANTS MARKET: END-USER COVERAGE GRID
FIGURE 12 ASIA-PACIFIC BIOSTIMULANTS MARKET: SEGMENTATION
FIGURE 13 TWO SEGMENTS COMPRISE THE ASIA-PACIFIC BIOSTIMULANTS MARKET, BY ORIGIN (2025)
FIGURE 14 ASIA-PACIFIC BIOSTIMULANTS MARKET: EXECUTIVE SUMMARY
FIGURE 15 STRATEGIC DECISIONS
FIGURE 16 INCREASING FREQUENCY OF CLIMATE-RELATED CROP STRESS SUCH AS DROUGHTS, FLOODS, AND HEAT WAVES IS DRIVING FARMERS TO ADOPT BIOSTIMULANTS TO MAINTAIN CROP YIELD AND QUALITY IS EXPECTED TO DRIVE THE ASIA-PACIFIC BIOSTIMULANTS MARKET DURING THE FORECAST PERIOD OF 2026 TO 2033
FIGURE 17 ORIGIN SEGMENT IS EXPECTED TO ACCOUNT FOR THE LARGEST SHARE OF THE ASIA-PACIFIC BIOSTIMULANTS MARKET IN 2026 & 2033
FIGURE 18 PORTER’S FIVE FORCES ANALYSIS
FIGURE 19 PRICING ANALYSIS (2018-2033)
FIGURE 20 PATENT ANALYSIS BY APPLICANTS
FIGURE 21 PATENT ANALYSIS BY COUNTRY
FIGURE 22 PATENT ANALYSIS BY YEAR
FIGURE 23 COMPANY EVALUATION QUADRANT
FIGURE 24 DRIVERS, RESTRAINTS, OPPORTUNITIES AND CHALLENGES OF ASIA-PACIFIC BIOSTIMULANTS MARKET
FIGURE 25 ASIA-PACIFIC BIOSTIMULANTS MARKET: BY ORIGIN, 2025
FIGURE 26 ASIA-PACIFIC BIOSTIMULANTS MARKET: BY FORM, 2025
FIGURE 27 ASIA-PACIFIC BIOSTIMULANTS MARKET: BY ACTIVE INGREDIENTS, 2025
FIGURE 28 ASIA-PACIFIC BIOSTIMULANTS MARKET: BY CROP, 2025
FIGURE 29 ASIA-PACIFIC BIOSTIMULANTS MARKET: BY APPLICATION METHOD, 2024
FIGURE 30 ASIA-PACIFIC BIOSTIMULANTS MARKET: BY END USER, 2025
FIGURE 31 ASIA PACIFIC BIOSTIMULANTS MARKET, SNAPSHOT (2025)
FIGURE 32 ASIA-PACIFIC BIOSTIMULANTS MARKET: COMPANY SHARE 2025 (%)
Data collection and base year analysis are done using data collection modules with large sample sizes. The stage includes obtaining market information or related data through various sources and strategies. It includes examining and planning all the data acquired from the past in advance. It likewise envelops the examination of information inconsistencies seen across different information sources. The market data is analysed and estimated using market statistical and coherent models. Also, market share analysis and key trend analysis are the major success factors in the market report. To know more, please request an analyst call or drop down your inquiry.
The key research methodology used by DBMR research team is data triangulation which involves data mining, analysis of the impact of data variables on the market and primary (industry expert) validation. Data models include Vendor Positioning Grid, Market Time Line Analysis, Market Overview and Guide, Company Positioning Grid, Patent Analysis, Pricing Analysis, Company Market Share Analysis, Standards of Measurement, Global versus Regional and Vendor Share Analysis. To know more about the research methodology, drop in an inquiry to speak to our industry experts.
Data Bridge Market Research is a leader in advanced formative research. We take pride in servicing our existing and new customers with data and analysis that match and suits their goal. The report can be customized to include price trend analysis of target brands understanding the market for additional countries (ask for the list of countries), clinical trial results data, literature review, refurbished market and product base analysis. Market analysis of target competitors can be analyzed from technology-based analysis to market portfolio strategies. We can add as many competitors that you require data about in the format and data style you are looking for. Our team of analysts can also provide you data in crude raw excel files pivot tables (Fact book) or can assist you in creating presentations from the data sets available in the report.


