
Asia Pacific Cleanroom Particle Counters Market
Market Size in USD Million
 USD
113.07 Million
USD
173.52 Million
2025
2033
USD
113.07 Million
USD
173.52 Million
2025
2033
| 2026 - 2033 | |
| USD 113.07 Million | |
| USD 173.52 Million | |
| % | |
|
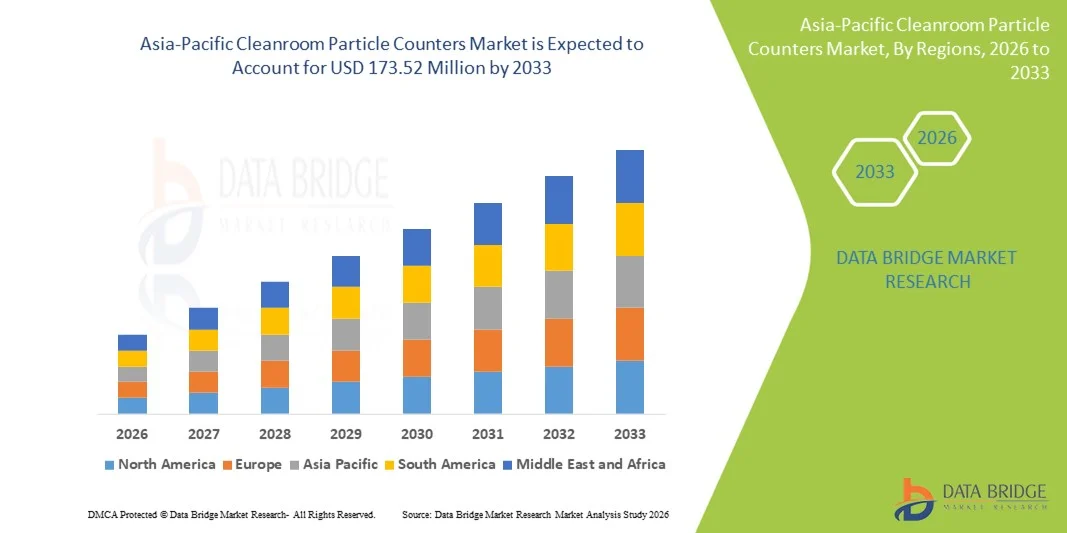
Asia-Pacific Cleanroom Particle Counters Market Size
- The Asia-Pacific cleanroom particle counters market size was valued at USD 113.07 million in 2025 and is expected to reach USD 173.52 million by 2033, at a CAGR of 5.50% during the forecast period
- The market growth is largely driven by the rapid expansion of pharmaceutical, biotechnology, semiconductor, and electronics manufacturing industries across key economies such as China, Japan, South Korea, and India, resulting in increased demand for contamination control and regulatory compliance
- Furthermore, stringent cleanroom standards, growing investments in advanced manufacturing facilities, and rising focus on product quality and safety are positioning cleanroom particle counters as essential monitoring solutions. These converging factors are accelerating the adoption of advanced airborne particle monitoring systems, thereby significantly boosting the region’s market growth
Asia-Pacific Cleanroom Particle Counters Market Analysis
- Cleanroom particle counters, designed to detect and measure airborne particles in controlled environments, are increasingly critical components in pharmaceutical, biotechnology, semiconductor, and electronics manufacturing facilities across Asia-Pacific due to their role in ensuring contamination control, regulatory compliance, and product quality assurance
- The escalating demand for cleanroom particle counters is primarily fueled by the rapid expansion of pharmaceutical and semiconductor production, stringent regulatory requirements for cleanroom validation, and a growing emphasis on maintaining high manufacturing standards and minimizing product recalls
- China dominated the Asia-Pacific cleanroom particle counters market with the largest revenue share of 38.4% in 2025, characterized by strong investments in semiconductor fabrication plants, expanding pharmaceutical manufacturing capacity, and supportive government initiatives, with significant adoption of advanced real-time monitoring systems across large-scale industrial facilities
- India is expected to be the fastest growing country in the Asia-Pacific cleanroom particle counters market during the forecast period due to rising pharmaceutical exports, increasing establishment of biologics and vaccine manufacturing units, and strengthening regulatory frameworks for cleanroom compliance
- Portable particle counters segment dominated the Asia-Pacific cleanroom particle counters market with a market share of 46.7% in 2025, driven by their flexibility, ease of use in routine monitoring and validation processes, and growing preference for cost-effective and mobile contamination monitoring solutions
Report Scope and Asia-Pacific Cleanroom Particle Counters Market Segmentation
|
Attributes |
Asia-Pacific Cleanroom Particle Counters Key Market Insights |
|
Segments Covered |
|
|
Countries Covered |
Asia-Pacific
|
|
Key Market Players |
|
|
Market Opportunities |
|
|
Value Added Data Infosets |
In addition to the insights on market scenarios such as market value, growth rate, segmentation, geographical coverage, and major players, the market reports curated by the Data Bridge Market Research also include in-depth expert analysis, patient epidemiology, pipeline analysis, pricing analysis, and regulatory framework |
Asia-Pacific Cleanroom Particle Counters Market Trends
Real-Time Monitoring and Industry 4.0 Integration in Controlled Environments
- A significant and accelerating trend in the Asia-Pacific cleanroom particle counters market is the increasing integration of real-time environmental monitoring systems with Industry 4.0 frameworks and automated manufacturing ecosystems. This convergence of digital technologies is significantly enhancing contamination control, traceability, and operational efficiency across regulated industries
- For instance, advanced cleanroom monitoring platforms deployed in semiconductor fabs across Taiwan and South Korea integrate particle counters with centralized manufacturing execution systems (MES), enabling continuous data logging and automated compliance reporting. Similarly, pharmaceutical facilities in Japan are adopting remote monitoring dashboards to streamline audits and validation processes
- Digital integration in particle counters enables features such as continuous remote surveillance, predictive maintenance alerts, and automated deviation notifications based on threshold breaches. For instance, several manufacturers now offer IoT-enabled airborne particle counters that provide intelligent alerts when abnormal particle spikes are detected. Furthermore, cloud connectivity capabilities allow quality teams to access real-time cleanroom performance data from centralized control centers
- The seamless integration of particle counters with broader environmental monitoring systems facilitates centralized control over cleanroom parameters such as temperature, humidity, and differential pressure. Through a unified interface, facility managers can oversee contamination metrics alongside other critical variables, creating a synchronized and automated compliance environment
- This trend toward smarter, network-connected, and compliance-driven monitoring solutions is fundamentally reshaping operational standards in regulated manufacturing sectors. Consequently, companies across Asia-Pacific are developing advanced laser-based particle counters with enhanced data analytics, remote calibration support, and compatibility with GMP and ISO cleanroom standards
- The demand for intelligent cleanroom particle counters with seamless digital integration is growing rapidly across pharmaceutical, biotechnology, and semiconductor industries, as manufacturers increasingly prioritize regulatory transparency, product integrity, and automated quality assurance systems
Asia-Pacific Cleanroom Particle Counters Market Dynamics
Driver
Growing Demand Due to Expanding Pharmaceutical and Semiconductor Manufacturing
- The increasing expansion of pharmaceutical production facilities and semiconductor fabrication plants across Asia-Pacific, coupled with stricter regulatory enforcement for contamination control, is a significant driver for the heightened demand for cleanroom particle counters
- For instance, in recent years, multiple governments in the region have announced investments in domestic chip manufacturing and pharmaceutical self-sufficiency initiatives, encouraging installation of advanced cleanroom monitoring infrastructure. Such strategic industrial developments by regional authorities are expected to drive the cleanroom particle counters market growth during the forecast period
- As manufacturers aim to comply with stringent GMP, ISO 14644, and other cleanroom classification standards, particle counters provide accurate airborne contamination measurement, continuous validation support, and documented audit trails, offering a compelling upgrade over manual sampling methods
- Furthermore, the rapid growth of biologics, vaccine production, and precision electronics manufacturing is making advanced environmental monitoring systems an integral component of modern cleanroom facilities, ensuring consistent product quality and reduced risk of batch rejection
- The expansion of contract manufacturing organizations (CMOs) and outsourced semiconductor assembly and testing (OSAT) providers is further stimulating demand for standardized and scalable particle counting solutions across multi-client production environments
- The need for portable, remote-access, and automated particle monitoring solutions, along with increasing awareness regarding contamination-related product losses, is a key factor propelling adoption across pharmaceutical and semiconductor sectors. The transition toward high-value manufacturing and export-oriented production further contributes to sustained regional market growth
Restraint/Challenge
High Capital Investment and Calibration Compliance Requirements
- Concerns surrounding the high initial capital investment and ongoing calibration requirements of advanced cleanroom particle counters pose a significant challenge to broader market adoption, particularly among small and mid-sized manufacturers
- For instance, high-precision laser particle counters require periodic validation, specialized calibration services, and skilled technical oversight, which can increase total cost of ownership and operational complexity for facilities with limited technical infrastructure
- Addressing these cost and maintenance challenges through modular system designs, extended calibration intervals, and localized service support is crucial for expanding accessibility. Leading manufacturers emphasize service contracts, technical training programs, and remote diagnostics capabilities to reassure buyers about long-term reliability and compliance sustainability. In addition, integration complexity with legacy cleanroom infrastructure can act as a barrier for facilities undergoing gradual modernization
- While digital monitoring solutions improve compliance efficiency, the need for adherence to evolving regulatory documentation standards and audit preparedness can increase administrative burden for manufacturers operating in multiple countries within Asia-Pacific
- Furthermore, intense price competition from regional manufacturers offering lower-cost monitoring devices may pressure margins of established global players, potentially affecting investment in innovation and service expansion
- Overcoming these challenges through cost optimization strategies, enhanced after-sales service networks, simplified integration frameworks, and regulatory harmonization efforts will be vital for ensuring sustained growth in the Asia-Pacific cleanroom particle counters market
Asia-Pacific Cleanroom Particle Counters Market Scope
The market is segmented on the basis of type, particle size, flow rate capacity, facility, end user, and distribution channel.
- By Type
On the basis of type, the Asia-Pacific cleanroom particle counters market is segmented into portable particle counter, handheld particle counter, and remote particle counter. The portable particle counter segment dominated the market with the largest revenue share of 46.7% in 2025, driven by its flexibility, ease of transportation across cleanroom zones, and suitability for routine monitoring and validation processes. Pharmaceutical and semiconductor facilities prefer portable systems for periodic certification, troubleshooting contamination events, and compliance documentation. Their compatibility with GMP and ISO standards and cost-effectiveness compared to fully integrated systems further strengthens demand. In addition, portable units offer high accuracy and multi-channel particle size detection, making them suitable for diverse applications. The growing expansion of mid-sized cleanroom facilities across India and Southeast Asia also supports this segment’s dominance.
The remote particle counter segment is anticipated to witness the fastest growth rate from 2026 to 2033, fueled by rising adoption of continuous monitoring systems in large semiconductor fabs and biologics manufacturing plants. Remote systems enable real-time data transmission to centralized monitoring platforms, ensuring uninterrupted surveillance and automated compliance reporting. Increasing integration with Industry 4.0 infrastructure and manufacturing execution systems is accelerating adoption. These systems reduce manual intervention and improve audit readiness through automated data logging. The demand for 24/7 contamination monitoring in high-value production environments is further contributing to rapid segment growth.
- By Particle Size
On the basis of particle size, the market is segmented into 0.1 µm–0.2 µm, 0.2 µm–0.3 µm, 0.3 µm–0.5 µm, 0.5 µm–5 µm, and more than 5 µm. The 0.3 µm–0.5 µm segment dominated the market in 2025, primarily due to its critical relevance in ISO cleanroom classifications and pharmaceutical manufacturing standards. This particle size range is widely monitored for aseptic processing environments and semiconductor fabrication. Regulatory frameworks frequently specify monitoring thresholds at 0.5 µm, increasing demand for accurate detection within this range. Manufacturers prioritize this size channel for compliance validation and contamination control. The segment benefits from standardized testing procedures across Asia-Pacific markets.
The 0.1 µm–0.2 µm segment is expected to witness the fastest growth during the forecast period, driven by advancements in semiconductor node technologies and high-precision electronics manufacturing. As chip fabrication moves toward smaller geometries, ultra-fine particle detection becomes increasingly critical. High-sensitivity laser-based counters capable of detecting submicron particles are gaining adoption. Increased investment in advanced fabs across Taiwan and South Korea is accelerating demand. The need for tighter contamination thresholds in nanotechnology applications further supports growth.
- By Flow Rate Capacity
On the basis of flow rate capacity, the market is segmented into low flow, standard flow, and high flow. The standard flow segment dominated the market in 2025, as it offers a balanced combination of sampling efficiency and operational cost, making it suitable for routine cleanroom classification and monitoring. Most pharmaceutical and biotechnology facilities rely on standard flow systems for daily environmental monitoring. These systems provide sufficient sampling volume while maintaining manageable equipment size and energy consumption. Their compatibility with portable and remote configurations further strengthens adoption.
The high flow segment is projected to witness the fastest growth from 2026 to 2033, supported by increasing demand for rapid cleanroom certification in large manufacturing environments. High flow particle counters enable faster sampling of larger air volumes, reducing validation time. Semiconductor fabs and large-scale biologics plants prefer high flow systems for critical zones requiring enhanced sensitivity. The growing emphasis on minimizing production downtime is also encouraging adoption. Technological advancements improving efficiency and reducing equipment footprint are further boosting segment expansion.
- By Facility
On the basis of facility, the market is segmented into small and large facilities. The large facility segment dominated the market in 2025, owing to substantial investments in semiconductor fabrication plants and large pharmaceutical manufacturing units across China, Japan, and South Korea. Large facilities require continuous and multi-point monitoring systems to ensure regulatory compliance across multiple cleanroom zones. Higher production volumes and stricter validation protocols drive demand for advanced particle counting systems. These facilities also allocate higher budgets for automated environmental monitoring infrastructure.
The small facility segment is expected to witness the fastest growth during the forecast period, driven by the expansion of emerging biotech startups and contract manufacturing organizations across India and Southeast Asia. Smaller facilities increasingly adopt cost-effective and portable particle counters to meet compliance standards. Government support for local pharmaceutical production is encouraging new facility setups. Affordable monitoring solutions and modular system designs are further facilitating adoption in this segment.
- By End User
On the basis of end user, the market is segmented into pharmaceutical and biotechnology industry, semiconductor and electronics industry, chemical industry, and others. The pharmaceutical and biotechnology industry segment dominated the market in 2025 due to stringent GMP requirements and growing vaccine and biologics production. Regulatory authorities mandate routine airborne particle monitoring in sterile manufacturing environments. The rising export of pharmaceutical products from Asia-Pacific further strengthens compliance requirements. Continuous validation and audit preparedness drive sustained demand.
The semiconductor and electronics industry segment is anticipated to witness the fastest growth rate from 2026 to 2033, fueled by increasing investment in advanced chip manufacturing and electronics assembly plants. Cleanroom classification standards in semiconductor fabs require ultra-low particle concentration levels. Expansion of domestic chip manufacturing initiatives across the region is accelerating equipment installations. The push toward high-performance computing and AI chips further supports rapid segment growth.
- By Distribution Channel
On the basis of distribution channel, the market is segmented into direct tenders and third party distributors. The direct tenders segment dominated the market in 2025, as large pharmaceutical and semiconductor companies prefer direct procurement from manufacturers to ensure customized configurations, technical support, and compliance documentation. Direct engagement ensures better pricing transparency and long-term service agreements. Large-scale projects often involve integrated monitoring solutions requiring manufacturer-level expertise.
The third party distributors segment is projected to witness the fastest growth during the forecast period, supported by increasing penetration into emerging markets and smaller facilities. Distributors provide localized support, faster delivery timelines, and access to multiple brands. Small and mid-sized enterprises often rely on distributors for cost-effective procurement and maintenance services. Expanding regional distribution networks are further enhancing market accessibility across Asia-Pacific.
Asia-Pacific Cleanroom Particle Counters Market Regional Analysis
- China dominated the Asia-Pacific cleanroom particle counters market with the largest revenue share of 38.4% in 2025, characterized by strong investments in semiconductor fabrication plants, expanding pharmaceutical manufacturing capacity, and supportive government initiatives, with significant adoption of advanced real-time monitoring systems across large-scale industrial facilities
- Manufacturers across the region highly prioritize contamination control, regulatory compliance with GMP and ISO standards, and integration of advanced monitoring systems within automated cleanroom environments
- This widespread adoption is further supported by rising investments in biologics and vaccine production, strong growth in electronics and chip manufacturing, and the increasing emphasis on quality assurance and export-oriented production, establishing cleanroom particle counters as essential monitoring solutions across pharmaceutical and semiconductor industries
The China Cleanroom Particle Counters Market Insight
The China cleanroom particle counters market captured the largest revenue share in 2025 within Asia-Pacific, fueled by large-scale investments in semiconductor fabrication plants and the rapid expansion of domestic pharmaceutical manufacturing. Manufacturers are increasingly prioritizing contamination control and regulatory compliance with ISO 14644 and GMP standards. The country’s strategic push toward semiconductor self-sufficiency and biologics production is accelerating demand for advanced airborne particle monitoring systems. Moreover, the integration of real-time monitoring technologies within automated production environments is significantly contributing to market expansion.
Japan Cleanroom Particle Counters Market Insight
The Japan cleanroom particle counters market is projected to expand at a substantial CAGR throughout the forecast period, primarily driven by the country’s advanced electronics industry and strong regulatory framework for pharmaceutical manufacturing. The presence of high-precision semiconductor facilities fosters the adoption of ultra-sensitive particle detection systems. Japanese manufacturers emphasize quality assurance and continuous monitoring to maintain global export standards. Increasing automation and digital integration within cleanroom facilities are further supporting sustained market growth.
India Cleanroom Particle Counters Market Insight
The India cleanroom particle counters market is anticipated to grow at a noteworthy CAGR during the forecast period, driven by rapid expansion in pharmaceutical production, vaccine manufacturing, and contract research organizations. Growing regulatory scrutiny and export compliance requirements are encouraging installation of validated monitoring systems. Government initiatives supporting domestic API and biologics manufacturing are further stimulating demand. The increasing establishment of GMP-certified facilities across emerging industrial clusters is expected to continue driving adoption.
South Korea Cleanroom Particle Counters Market Insight
The South Korea cleanroom particle counters market is expected to expand at a considerable CAGR during the forecast period, fueled by strong investments in advanced semiconductor and display panel manufacturing. The country’s focus on innovation and next-generation chip technologies requires stringent contamination control standards. Integration of particle counters with automated environmental monitoring systems is becoming increasingly prevalent. Continuous upgrades in fabrication facilities are further accelerating demand for high-precision monitoring equipment.
Asia-Pacific Cleanroom Particle Counters Market Share
The Asia-Pacific Cleanroom Particle Counters industry is primarily led by well-established companies, including:
- Particle Measuring Systems, Inc. (U.S.)
- Beckman Coulter, Inc. (U.S.)
- TSI Incorporated (U.S.)
- RION Co., Ltd. (Japan)
- Setra Systems (U.S.)
- IQAir AG (Switzerland)
- Lighthouse Worldwide Solutions, Inc. (U.S.)
- Kanomax USA, Inc. (U.S.)
- Climet Instruments Company (U.S.)
- Met One Instruments, Inc. (U.S.)
- Particles Plus, Inc. (U.S.)
- Suzhou Sujing Automation Instrument Equipment Co., Ltd. (China)
- Honri Airclean Technology Co., Ltd. (China)
- Zhejiang FUXIA Medical Technology Co., Ltd. (China)
- PCE Deutschland GmbH (Germany)
- GRIMM Aerosol Technik Ainring GmbH & Co. KG (Germany)
- TOPAS GmbH (Germany)
- HIYI (China)
- Veltek Associates, Inc. (U.S.)
What are the Recent Developments in Asia-Pacific Cleanroom Particle Counters Market?
- In August 2024, Junray showcased its 0.1 µm Particle Counter (ZR-1650) at the Asia-Pacific Cleanroom Technology & Equipment Exhibition in Guangzhou, unveiling the product to industry professionals and highlighting its adoption among cleanroom testers focused on ultra-fine particle detection
- In October 2023, Particle Measuring Systems launched the Lasair Pro Airborne Particle Counter to support cleanroom monitoring and classification, offering advanced airborne particle detection suitable for portable and remote applications a development that aligns with growing contamination control needs in critical environments such as pharmaceutical and semiconductor facilities in Asia-Pacific
- In June 2023, HORIBA introduced the SPCS-ONE solid particle counting system, a new device with advanced data management capabilities supporting cleanroom compliance, signaling continued product development in instrumentation that benefits clean environments such as those in electronics and biotech sectors
- In February 2023, TSI teased the release of its next-generation AeroTrak+ portable particle counters, designed to support cleanroom classification, monitoring, and root-cause analysis aligning with evolving cleanroom compliance standards such as ISO and GMP that are crucial for Asia-Pacific industries
- In July 2022, Climet announced the final lifetime buy of its CI-x56 Wi-Fi Portable Particle Counter, notifying customers of product phase-out an industry shift that influences Asia-Pacific cleanroom users to transition to newer, more capable monitoring solutions
SKU-

- Interactive Data Analysis Dashboard
- Company Analysis Dashboard for high growth potential opportunities
- Research Analyst Access for customization & queries
- Competitor Analysis with Interactive dashboard
- Latest News, Updates & Trend analysis
- Harness the Power of Benchmark Analysis for Comprehensive Competitor Tracking
Data collection and base year analysis are done using data collection modules with large sample sizes. The stage includes obtaining market information or related data through various sources and strategies. It includes examining and planning all the data acquired from the past in advance. It likewise envelops the examination of information inconsistencies seen across different information sources. The market data is analysed and estimated using market statistical and coherent models. Also, market share analysis and key trend analysis are the major success factors in the market report. To know more, please request an analyst call or drop down your inquiry.
The key research methodology used by DBMR research team is data triangulation which involves data mining, analysis of the impact of data variables on the market and primary (industry expert) validation. Data models include Vendor Positioning Grid, Market Time Line Analysis, Market Overview and Guide, Company Positioning Grid, Patent Analysis, Pricing Analysis, Company Market Share Analysis, Standards of Measurement, Global versus Regional and Vendor Share Analysis. To know more about the research methodology, drop in an inquiry to speak to our industry experts.
Data Bridge Market Research is a leader in advanced formative research. We take pride in servicing our existing and new customers with data and analysis that match and suits their goal. The report can be customized to include price trend analysis of target brands understanding the market for additional countries (ask for the list of countries), clinical trial results data, literature review, refurbished market and product base analysis. Market analysis of target competitors can be analyzed from technology-based analysis to market portfolio strategies. We can add as many competitors that you require data about in the format and data style you are looking for. Our team of analysts can also provide you data in crude raw excel files pivot tables (Fact book) or can assist you in creating presentations from the data sets available in the report.


