
Asia Pacific Cleanroom Technology Market
Market Size in USD Billion
 USD
1.02 Billion
USD
1.88 Billion
2024
2032
USD
1.02 Billion
USD
1.88 Billion
2024
2032
| 2025 - 2032 | |
| USD 1.02 Billion | |
| USD 1.88 Billion | |
| % | |
|
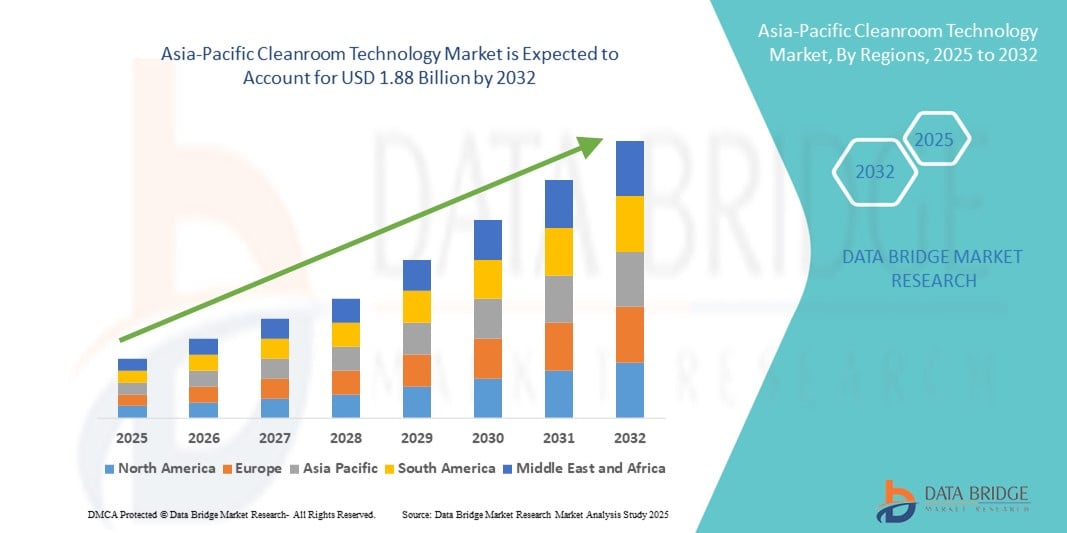
Asia-Pacific Cleanroom Technology Market Size
- The Asia-Pacific cleanroom technology market size was valued at USD 1.02 billion in 2024 and is expected to reach USD 1.88 billion by 2032, at a CAGR of 7.90% during the forecast period
- The market growth is largely fueled by the rapid expansion of pharmaceutical manufacturing, biotechnology research, and semiconductor fabrication across key regional economies, driving increased demand for contamination-controlled environments
- Furthermore, rising regulatory standards, growing investments in healthcare infrastructure, and the integration of advanced cleanroom solutions in electronics and medical device production are positioning cleanroom technology as a critical enabler of high-quality manufacturing. These factors are accelerating adoption across industries, thereby significantly boosting the market’s growth
Asia-Pacific Cleanroom Technology Market Analysis
- Cleanroom technology, comprising controlled environments that regulate airborne particles, temperature, humidity, and pressure, is becoming an indispensable component in pharmaceuticals, biotechnology, electronics, and medical device manufacturing across Asia-Pacific due to its role in safeguarding product integrity, ensuring regulatory compliance, and enabling advanced manufacturing processes
- The accelerating demand for cleanroom technology in the region is primarily driven by rapid pharmaceutical production expansion, robust growth in semiconductor and electronics fabrication, and increased investment in high-quality healthcare infrastructure
- China dominated the Asia-Pacific cleanroom technology market with the largest revenue share of 45.5% in 2024, underpinned by its expansive manufacturing base, stringent contamination control regulations, and large-scale investments in biopharmaceutical and high-tech sectors, with notable adoption of modular and energy-efficient cleanroom systems across industrial parks and research hubs
- India is expected to be the fastest-growing country in the Asia-Pacific cleanroom technology market during the forecast period, supported by increasing pharmaceutical exports, government incentives for domestic electronics production, and the expansion of hospitals and diagnostic centers that demand advanced contamination control facilities
- The equipment segment dominated the Asia-Pacific cleanroom technology market with a market share of 55.5% in 2024, driven by strong demand for HVAC systems, HEPA/ULPA filtration, and other air-handling solutions, alongside rising replacement and upgrade cycles in established facilities
Report Scope and Asia-Pacific Cleanroom Technology Market Segmentation
|
Attributes |
Asia-Pacific Cleanroom Technology Key Market Insights |
|
Segments Covered |
|
|
Countries Covered |
Asia-Pacific
|
|
Key Market Players |
|
|
Market Opportunities |
|
|
Value Added Data Infosets |
In addition to the insights on market scenarios such as market value, growth rate, segmentation, geographical coverage, and major players, the market reports curated by the Data Bridge Market Research also include in-depth expert analysis, pricing analysis, brand share analysis, consumer survey, demography analysis, supply chain analysis, value chain analysis, raw material/consumables overview, vendor selection criteria, PESTLE Analysis, Porter Analysis, and regulatory framework. |
Asia-Pacific Cleanroom Technology Market Trends
Rising Adoption of Modular and Energy-Efficient Cleanroom Solutions
- A significant and accelerating trend in the Asia-Pacific cleanroom technology market is the growing shift towards modular cleanroom designs and energy-efficient systems. These solutions offer faster installation, scalability, and lower operational costs while meeting stringent contamination control standards in pharmaceuticals, biotechnology, and electronics manufacturing
- For instance, companies such as Terra Universal and Clean Air Products are providing modular cleanroom units equipped with advanced HVAC systems and low-energy HEPA filtration to reduce power consumption while maintaining Class 100 to Class 10,000 cleanliness level
- Modular cleanrooms also enable manufacturers to quickly expand capacity in response to surging demand a crucial advantage for biopharmaceutical firms scaling vaccine and biologics production or semiconductor fabs adapting to new process nodes
- Energy efficiency innovations, such as variable-speed air handling units, demand-based lighting, and smart airflow monitoring, are helping facilities comply with environmental regulations and sustainability goals while lowering utility expenses
- The ability to rapidly deploy, customize, and upgrade cleanroom environments without major structural modifications is appealing to both established manufacturers and emerging biotech startups in the region
- This trend towards modular, flexible, and eco-conscious cleanroom solutions is redefining project timelines, operational efficiency, and cost structures, driving adoption across industries from life sciences to advanced electronics
Asia-Pacific Cleanroom Technology Market Dynamics
Driver
Expanding Pharmaceutical, Biotechnology, and Semiconductor Manufacturing
- The rapid expansion of pharmaceutical and biotech production facilities, alongside the growth of advanced semiconductor manufacturing in Asia-Pacific, is a major driver fueling demand for cleanroom technology
- For instance, in May 2024, Samsung Electronics announced a multi-billion-dollar expansion of its semiconductor fab in South Korea, including the installation of next-generation ISO Class 1 cleanroom spaces. Such investments significantly boost the regional demand for high-performance cleanroom systems
- Pharmaceutical hubs in India, China, and Singapore are also increasing their GMP-compliant cleanroom installations to support vaccine production, biologics manufacturing, and R&D activities
- The combination of strict regulatory compliance requirements, rising export demand, and the need for contamination-free production environments is accelerating cleanroom adoption in both life sciences and electronics sectors
- Increasing government incentives for high-tech manufacturing and domestic healthcare production further reinforce the demand for modern cleanroom facilities across the region
Restraint/Challenge
High Setup Costs and Skilled Workforce Shortage
- One of the key challenges facing the Asia-Pacific cleanroom technology market is the high initial investment required for construction, equipment procurement, and commissioning of advanced cleanroom facilities
- For instance, establishing a semiconductor-grade ISO Class 1 cleanroom can cost several million dollars, making it a significant barrier for smaller manufacturers or startups
- In addition, the shortage of skilled technicians and engineers with expertise in cleanroom design, validation, and maintenance poses operational challenges, particularly in emerging economies where training programs are limited
- The need for ongoing compliance with international standards such as ISO 14644 and GMP adds to operational costs, while deviations or contamination incidents can result in costly shutdowns
- Overcoming these hurdles will require greater investment in workforce training, the adoption of cost-optimized modular systems, and collaboration between cleanroom technology providers and government bodies to support infrastructure development in high-growth sectors
Asia-Pacific Cleanroom Technology Market Scope
The market is segmented on the basis of type, construction type, and industry.
- By Type
On the basis of type, the Asia-Pacific cleanroom technology market is segmented into equipment and consumables. The equipment segment dominated the market with the largest market revenue share of 55.5% in 2024, driven by the rising demand for advanced HVAC systems, air showers, pass-through cabinets, and high-efficiency filtration units. Industries such as pharmaceuticals, semiconductors, and biotechnology prioritize equipment upgrades to meet stringent contamination control regulations and improve operational efficiency. In addition, the long-term durability and integration of automation and energy-saving technologies in modern equipment further enhance its adoption.
The consumables segment is anticipated to witness the fastest growth rate of 7.8% from 2025 to 2032, fueled by continuous demand for disposable gloves, gowns, masks, disinfectants, and wipes across cleanroom facilities. The growth is reinforced by the recurring replacement cycles and increasing awareness regarding contamination control in medical devices manufacturing, optical industries, and healthcare facilities.
- By Construction Type
On the basis of construction type, the Asia-Pacific cleanroom technology market is segmented into material and design. The material segment held the largest market share in 2024 due to high demand for durable, corrosion-resistant, and easy-to-clean construction materials such as stainless steel, aluminum, and coated panels. These materials are crucial for maintaining controlled environments in industries such as pharmaceuticals and electronics manufacturing.
The design segment is expected to register the fastest CAGR during the forecast period, driven by the adoption of modular cleanroom designs that allow scalability, faster installation, and flexibility in configuration. The growing popularity of modular solutions in emerging economies such as India and Vietnam is due to their cost-effectiveness and shorter project timelines compared to conventional cleanroom construction.
- By Industry
On the basis of industry, the Asia-Pacific cleanroom technology market is segmented into pharmaceutical industry, semiconductor & electronic industry, biotechnology industry, foods & beverage industry, medical devices manufacturers, hospital & healthcare industry, plastic industry, optical industry, and others. The pharmaceutical industry segment dominated with a revenue share of 32.4% in 2024, attributed to the expansion of vaccine manufacturing, biologics production, and stringent GMP compliance requirements across the region.
The semiconductor & electronic industry segment is projected to be the fastest-growing at a CAGR of 8.5% from 2025 to 2032, fueled by rising investment in high-performance chip manufacturing in countries such as China, Taiwan, and South Korea. The biotechnology industry also represents a strong growth area, driven by advances in cell and gene therapy research requiring ultra-clean environments.
Asia-Pacific Cleanroom Technology Market Regional Analysis
- China dominated the Asia-Pacific cleanroom technology market with the largest revenue share of 45.5% in 2024, underpinned by its expansive manufacturing base, stringent contamination control regulations, and large-scale investments in biopharmaceutical and high-tech sectors, with notable adoption of modular and energy-efficient cleanroom systems across industrial parks and research hubs
- Manufacturers in China place strong emphasis on meeting strict contamination control standards, leveraging advanced cleanroom equipment and modular designs to support large-scale, high-precision production
- This leadership position is further reinforced by government-backed initiatives to strengthen domestic high-tech manufacturing, rising healthcare infrastructure investments, and the country’s role as a global export hub for pharmaceuticals, electronics, and medical devices, cementing China’s status as the key driver of cleanroom technology adoption in the region
The China Cleanroom Technology Market Insight
The China cleanroom technology market captured the largest revenue share in Asia-Pacific in 2024, driven by the country’s vast pharmaceutical manufacturing capacity, rapidly expanding semiconductor and electronics sectors, and strong investments in biotechnology. Government-backed initiatives such as “Made in China 2025” are promoting advanced manufacturing capabilities, encouraging the adoption of high-spec cleanroom environments. The presence of numerous global and domestic cleanroom solution providers, along with increasing R&D spending, is reinforcing China’s leadership position in the regional market.
India Cleanroom Technology Market Insight
The India cleanroom technology market is projected to expand at one of the fastest CAGRs during the forecast period, fueled by the rapid growth of pharmaceutical exports, medical device manufacturing, and biotechnology R&D. Initiatives such as “Make in India” and the establishment of new vaccine and biologics production facilities are significantly increasing demand for contamination-controlled environments. The country’s rising electronics assembly sector and expanding hospital infrastructure are further contributing to market growth.
Japan Cleanroom Technology Market Insight
The Japan cleanroom technology market is gaining momentum due to the nation’s strong semiconductor fabrication base, precision optical manufacturing, and advanced pharmaceutical production capabilities. The Japanese market values high-performance, energy-efficient cleanroom systems that align with its strict quality and environmental standards. In addition, the country’s emphasis on innovation and its leadership in next-generation chip production are driving investments in cutting-edge cleanroom facilities.
South Korea Cleanroom Technology Market Insight
The South Korea cleanroom technology market is experiencing robust growth, supported by its dominance in semiconductor manufacturing and the expansion of biopharmaceutical production. Leading technology companies are investing heavily in new fab facilities, incorporating state-of-the-art ISO Class 1 cleanroom spaces. The government’s focus on becoming a global biotech hub, combined with private sector innovation in electronics and healthcare, is fueling sustained demand for cleanroom solutions.
Asia-Pacific Cleanroom Technology Market Share
The Asia-Pacific Cleanroom Technology industry is primarily led by well-established companies, including:
- Azbil Corporation (Japan)
- Daikin Industries, Ltd. (Japan)
- Terasaki Electric Co., Ltd. (Japan)
- Taikisha Ltd. (Japan)
- Nippon Muki Co., Ltd. (Japan)
- Fuji Electric Co., Ltd. (Japan)
- Camfil AB (Sweden)
- M+W Group GmbH (Germany)
- Royal Imtech N.V. (Netherlands)
- Kimberly-Clark Corporation (U.S.)
- E.I. du Pont de Nemours and Company (U.S.)
- Illinois Tool Works Inc. (U.S.)
- Clean Air Products (U.S.)
- Alpiq Holding Ltd. (Switzerland)
- COLANDIS GmbH (Germany)
- Labconco Corporation (U.S.)
- Terra Universal, Inc. (U.S.)
- Exyte Group GmbH (Germany)
- ACMAS Technologies Pvt. Ltd. (India)
- Cleatech, LLC (U.S.)
What are the Recent Developments in Asia-Pacific Cleanroom Technology Market?
- In June 2025, Ansell launched its KIMTECH lab and cleanroom personal protective equipment (PPE) range in Japan, marking its expansion into the Asia-Pacific cleanroom sector. The launch follows Ansell's acquisition of the Kimberly-Clark PPE business in 2024 and includes the KIMTECH and BioClean lines
- In August 2024, Junray unveiled its 0.1 µm Particle Counter ZR-1650 (1 LPM) during the Asia-Pacific Cleanroom Technology & Equipment Exhibition in Guangzhou. The new device, part of Junray’s cleanroom testing portfolio, was showcased for the first time at the event
- In April 2024, Telstar significantly expanded its production capacity in Shanghai, China, moving to a new 5,200 m² facility dedicated to manufacturing freeze-drying equipment and related lab systems for the Asia-Pacific pharmaceutical market
- In April 2024, AES Clean Technology introduced the CleanLock Module, an advanced airlock system engineered to enhance contamination control, speed, and efficiency in cleanroom environments. The module features proprietary finishes, patented lighting, precise airflow control, and seamless integration capabilities
- In September 2023, Officine Ceccacci (OC Group), an Italy-based cleanroom design and build firm, officially opened its OC Asia Pacific business unit in Singapore to serve the pharmaceutical and food industries across the region. The new unit offers comprehensive turnkey solutions, from walls and ceilings to industrial cleanroom components, customized for Asia-Pacific clients
SKU-

- Interactive Data Analysis Dashboard
- Company Analysis Dashboard for high growth potential opportunities
- Research Analyst Access for customization & queries
- Competitor Analysis with Interactive dashboard
- Latest News, Updates & Trend analysis
- Harness the Power of Benchmark Analysis for Comprehensive Competitor Tracking
Data collection and base year analysis are done using data collection modules with large sample sizes. The stage includes obtaining market information or related data through various sources and strategies. It includes examining and planning all the data acquired from the past in advance. It likewise envelops the examination of information inconsistencies seen across different information sources. The market data is analysed and estimated using market statistical and coherent models. Also, market share analysis and key trend analysis are the major success factors in the market report. To know more, please request an analyst call or drop down your inquiry.
The key research methodology used by DBMR research team is data triangulation which involves data mining, analysis of the impact of data variables on the market and primary (industry expert) validation. Data models include Vendor Positioning Grid, Market Time Line Analysis, Market Overview and Guide, Company Positioning Grid, Patent Analysis, Pricing Analysis, Company Market Share Analysis, Standards of Measurement, Global versus Regional and Vendor Share Analysis. To know more about the research methodology, drop in an inquiry to speak to our industry experts.
Data Bridge Market Research is a leader in advanced formative research. We take pride in servicing our existing and new customers with data and analysis that match and suits their goal. The report can be customized to include price trend analysis of target brands understanding the market for additional countries (ask for the list of countries), clinical trial results data, literature review, refurbished market and product base analysis. Market analysis of target competitors can be analyzed from technology-based analysis to market portfolio strategies. We can add as many competitors that you require data about in the format and data style you are looking for. Our team of analysts can also provide you data in crude raw excel files pivot tables (Fact book) or can assist you in creating presentations from the data sets available in the report.


