
Asia Pacific Clinical Trial Imaging Market
Market Size in USD Billion
 USD
1.41 Billion
USD
2.76 Billion
2025
2033
USD
1.41 Billion
USD
2.76 Billion
2025
2033
| 2026 - 2033 | |
| USD 1.41 Billion | |
| USD 2.76 Billion | |
| % | |
|
Asia-Pacific Clinical Trial Imaging Market Size
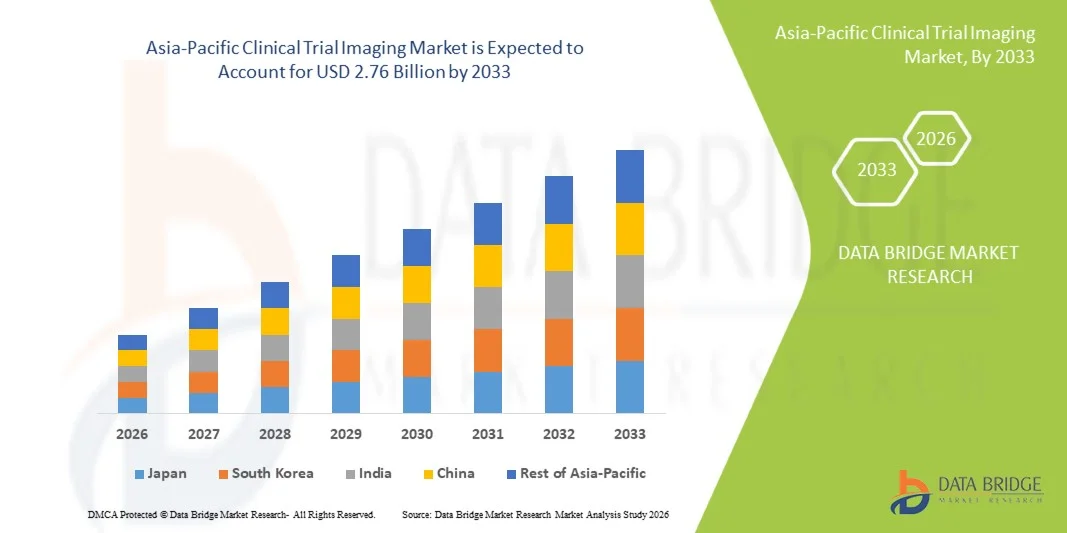
- The Asia-Pacific Clinical Trial Imaging Market size was valued at USD 1.41 billion in 2025 and is expected to reach USD 2.76 billion by 2033, at a CAGR of 8.80% during the forecast period
- The market growth is largely fueled by the increasing adoption of advanced imaging technologies and digital tools in clinical research, leading to more accurate, efficient, and high-quality imaging data collection in both hospital and research settings
- Furthermore, rising demand for real-time monitoring, non-invasive diagnostic techniques, and high-resolution imaging solutions is establishing clinical trial imaging systems as essential tools in modern drug development and clinical research. These converging factors are accelerating the uptake of clinical trial imaging solutions, thereby significantly boosting the market growth
Asia-Pacific Clinical Trial Imaging Market Analysis
- Clinical trial imaging solutions, including MRI, CT, PET, and digital imaging technologies, are increasingly vital in modern drug development and clinical research due to their ability to provide precise, non-invasive, and high-resolution imaging for monitoring treatment efficacy and patient safety
- The escalating demand for clinical trial imaging is primarily driven by the growing need for advanced diagnostic tools, increasing adoption of non-invasive imaging techniques, and rising investments in clinical research and pharmaceutical development
- China dominated the Asia-Pacific Clinical Trial Imaging Market with the largest revenue share of approximately 39.8% in 2025, supported by substantial government investment in healthcare infrastructure, advanced imaging facilities, and strong adoption of innovative imaging technologies in clinical trials
- India is expected to be the fastest-growing region in the Asia-Pacific Clinical Trial Imaging Market during the forecast period, with a projected growth rate of 9.1% CAGR, driven by increasing clinical research activities, rising pharmaceutical outsourcing, and expanding healthcare infrastructure
- The Services segment dominated the largest market revenue share of 61.5% in 2025, driven by the increasing reliance of pharmaceutical and biotechnology companies on outsourced imaging services for clinical trials
Report Scope and Asia-Pacific Clinical Trial Imaging Market Segmentation
|
Attributes |
Clinical Trial Imaging Key Market Insights |
|
Segments Covered |
|
|
Countries Covered |
Asia-Pacific
|
|
Key Market Players |
• GE Healthcare (U.S.) |
|
Market Opportunities |
|
|
Value Added Data Infosets |
In addition to the insights on market scenarios such as market value, growth rate, segmentation, geographical coverage, and major players, the market reports curated by the Data Bridge Market Research also include in-depth expert analysis, patient epidemiology, pipeline analysis, pricing analysis, and regulatory framework. |
Asia-Pacific Clinical Trial Imaging Market Trends
“Enhanced Adoption Through Technological Advancements and Research Expansion”
- A significant and accelerating trend in the global Asia-Pacific Clinical Trial Imaging Market is the increased adoption of advanced imaging modalities such as PET, MRI, CT, and hybrid systems in clinical trials. Researchers are increasingly relying on high-resolution imaging and quantitative analytics to monitor disease progression, evaluate therapeutic efficacy, and enhance endpoint accuracy
- Globally, hybrid imaging systems accounted for approximately 27% of market share in 2025, reflecting their growing relevance in complex trials
- For instance, in 2024, Siemens Healthineers launched its Biograph Vision Quadra PET/CT system across multiple continents, enabling ultra-high-resolution imaging and higher patient throughput. Similarly, GE Healthcare introduced the SIGNA Premier MRI system in North America and Europe, allowing for advanced neuroimaging in clinical trials. Such innovations highlight a global shift toward precision-driven trial methodologies
- Another global trend is the expansion of imaging capabilities within contract research organizations (CROs) and multi-center trial networks. Companies are investing in centralized imaging core labs to standardize image acquisition and analysis, which is helping reduce variability and increase trial reliability. Approximately 35% of new multi-center oncology trials in 2025 leveraged such core labs
- In addition, integration of imaging biomarkers and quantitative imaging analytics is emerging as a standard in cardiovascular, oncology, and neurology trials, enhancing patient stratification and outcome measurement on a global scale
Asia-Pacific Clinical Trial Imaging Market Dynamics
Driver
“Increasing Clinical Research Activities and Chronic Disease Burden”
- The market growth is primarily driven by the rising prevalence of chronic diseases worldwide, including cancer, cardiovascular disorders, and neurological conditions, which require frequent and precise imaging to evaluate therapeutic responses
- In 2025, oncology trials represented approximately 42% of total clinical trial imaging demand globally
- For instance, in North America, ICON plc implemented PET/CT imaging protocols across multiple oncology trials in 2025, reducing data variability and providing consistent monitoring of tumor progression. Similarly, in Europe, MRI-based imaging biomarkers were adopted in neurology trials to detect subtle treatment effects
- Furthermore, increasing investment by pharmaceutical companies in clinical trials, particularly for innovative therapies such as immunotherapy and gene therapy, is driving the adoption of advanced imaging technologies. Global clinical trial spending grew by 7.5% in 2025, directly impacting imaging demand
- Expanding partnerships between CROs and imaging technology providers worldwide are enhancing access to high-end imaging modalities, supporting the launch of multi-regional clinical trials efficiently
Restraint/Challenge
“High Costs, Regulatory Barriers, and Operational Complexity”
- High capital expenditure for advanced imaging systems, such as PET/MRI, CT-PET, or 7T MRI scanners, continues to pose a barrier to adoption in several regions. In 2025, the upfront cost of these systems accounted for nearly 60% of the total expenditure in new imaging sites globally
- Regulatory and compliance challenges across different countries slow down the deployment of imaging systems for multi-regional clinical trials. Navigating approvals from bodies such as the FDA (U.S.), EMA (Europe), and NMPA (China) often leads to delays in trial initiation
- Operational complexities, including the need for trained imaging personnel and standardized protocols, limit access in emerging markets
- For instance, about 25% of emerging market sites reported challenges in maintaining consistent imaging quality in multi-center trials in 2025
- Variability in imaging protocols and lack of harmonization between trial sites can reduce the reliability of outcome measures, pushing organizations to invest in quality assurance and centralized imaging facilities
- Overcoming these challenges requires the development of cost-effective imaging systems, streamlined regulatory frameworks, global standardization of imaging protocols, and expanded training programs to support workforce readiness for clinical trials
Asia-Pacific Clinical Trial Imaging Market Scope
The market is segmented on the basis of product and services, modality, application, end-user, and distributor.
• By Product and Services
On the basis of product and services, the Asia-Pacific Clinical Trial Imaging Market is segmented into Services and Software. The Services segment dominated the largest market revenue share of 61.5% in 2025, driven by the increasing reliance of pharmaceutical and biotechnology companies on outsourced imaging services for clinical trials. Services include imaging acquisition, centralized reading, data analysis, and quality assurance, providing comprehensive support for multi-center trials. Global adoption is fueled by the need for standardized protocols, regulatory compliance, and cost efficiency. CROs and hospitals play a critical role in delivering imaging services. The segment benefits from technological advancements in imaging platforms, cloud-based data management, and AI-assisted analysis. Increasing oncology, cardiology, and neurology trials globally boosts demand. Collaborations between imaging service providers and research institutes enhance service quality. The segment’s strong presence in North America and Europe further strengthens its market share. Standardized service packages simplify trial logistics and improve data reliability. Continuous investment in service infrastructure maintains dominance. Overall, Services remain the cornerstone of clinical trial imaging.
The Software segment is expected to witness the fastest CAGR of 16.8% from 2026 to 2033, driven by the rising need for data management, analysis, and visualization tools in clinical trials. Software solutions facilitate imaging storage, workflow automation, centralized reading, and AI-based image interpretation. Growth is accelerated by the adoption of cloud computing, advanced analytics, and machine learning applications. Pharmaceutical companies are increasingly leveraging software to reduce operational timelines and costs. Integration with electronic data capture (EDC) systems enhances usability. The segment benefits from increasing demand for real-time image review and remote monitoring. Regulatory requirements for audit trails and reproducibility further support software adoption. Expansion of CRO services globally creates additional demand. The segment is expected to grow rapidly, particularly in North America, Europe, and the Asia-Pacific region.
• By Modality
On the basis of modality, the Asia-Pacific Clinical Trial Imaging Market is segmented into Computed Tomography (CT), Magnetic Resonance Imaging (MRI), Echocardiography, Nuclear Medicine, Positron Emission Tomography (PET), X-ray, Ultrasound, Optical Coherence Tomography, and Others. The MRI segment accounted for the largest market revenue share of 38.4% in 2025, driven by its high-resolution imaging capabilities, non-invasive nature, and widespread use in oncology, neurology, and cardiology trials. MRI provides detailed soft tissue contrast, supporting accurate disease assessment and treatment monitoring. Hospitals and CROs prefer MRI due to reproducibility and protocol standardization. Growth is supported by increasing prevalence of chronic and oncologic diseases globally. Technological innovations such as 3T and 7T MRI scanners improve image quality and reduce scan times. The segment benefits from high patient compliance and minimal radiation exposure. Continuous R&D in MRI-compatible contrast agents further enhances diagnostic utility. Standardized imaging protocols across multi-center trials maintain dominance. MRI’s adoption in regulatory-compliant clinical trials strengthens global market share.
The PET segment is expected to witness the fastest CAGR of 17.2% from 2026 to 2033, driven by the rising demand for molecular imaging and precise functional assessment in oncology, cardiology, and neurology studies. PET provides metabolic and biochemical information, enabling early disease detection and therapy response evaluation. Integration with CT (PET-CT) enhances anatomical localization. Pharmaceutical companies increasingly use PET for drug efficacy and pharmacokinetic studies. Technological advances, including digital PET and AI-assisted quantification, accelerate adoption. Expansion of clinical trial sites in emerging regions supports growth. The segment benefits from growing investments in precision medicine and personalized therapies. Increasing oncology clinical trials worldwide drive PET demand. Enhanced image resolution and reduced scan times improve patient throughput. Overall, PET is projected to grow rapidly over the forecast period.
• By Application
On the basis of application, the Asia-Pacific Clinical Trial Imaging Market is segmented into Oncology, Neurology, Endocrinology, Cardiology, Dermatology, Hematology, and Others. The Oncology segment dominated the largest market revenue share of 42.7% in 2025, driven by the growing global prevalence of cancer and the high number of oncology clinical trials. Imaging is critical for tumor detection, staging, therapy monitoring, and response assessment. Adoption is supported by advanced imaging modalities such as MRI, PET, and CT. CROs and hospitals provide standardized imaging services to ensure reproducibility. Technological innovations such as AI-assisted tumor segmentation enhance efficiency. Regulatory requirements for precise endpoints in trials further drive adoption. Pharmaceutical companies increasingly rely on imaging biomarkers for drug development. Global collaborations and multi-center trials strengthen the segment’s dominance. Oncology remains a high-investment area, ensuring consistent growth.
The Neurology segment is expected to witness the fastest CAGR of 16.5% from 2026 to 2033, fueled by increasing research on neurodegenerative diseases, multiple sclerosis, and stroke. Imaging is essential for early diagnosis, disease progression monitoring, and treatment evaluation. MRI and PET are widely used for neurological assessments. Growth is supported by rising clinical trials focused on Alzheimer’s and Parkinson’s therapies. AI-driven image analysis enables more accurate and reproducible results. Expansion of research institutes and funding for neuroimaging studies drives adoption. Integration of multi-modal imaging enhances trial efficiency. Technological improvements such as functional MRI accelerate growth. Global prevalence of neurological disorders ensures sustained demand. Overall, Neurology is the fastest-growing application segment.
• By End-User
On the basis of end-user, the Asia-Pacific Clinical Trial Imaging Market is segmented into Pharmaceutical & Biotechnology Companies, Contract Research Organizations (CROs), Medical Device Manufacturers, Academic & Government Research Institutes, and Others. The CROs segment held the largest market revenue share of 46.2% in 2025, driven by the increasing outsourcing of imaging services for clinical trials. CROs provide comprehensive imaging solutions, including acquisition, central reading, and data analysis, supporting faster and cost-effective trials. Pharmaceutical and biotechnology companies rely on CROs to ensure compliance with regulatory standards and quality assurance. The segment benefits from global expansion of clinical trial networks and technological advancements in imaging platforms. Standardized service delivery across multi-center trials maintains dominance. Strategic partnerships with imaging vendors enhance service portfolios. Adoption of cloud-based and AI-assisted workflows improves operational efficiency. Increasing oncology and neurology trials worldwide strengthen segment growth.
The Academic & Government Research Institutes segment is expected to witness the fastest CAGR of 17.8% from 2026 to 2033, fueled by growing investments in medical research and translational studies. Research institutes utilize advanced imaging for preclinical and early-phase trials. Increasing focus on biomarker discovery and drug mechanism studies accelerates adoption. Expansion of government-funded neuroimaging and oncology programs supports growth. Collaborative research and public-private partnerships enhance resource availability. AI-enabled imaging analysis enables higher throughput and reproducibility. Emerging markets are witnessing increased clinical research activity, driving adoption. Integration with academic trials and translational medicine initiatives strengthens segment potential. Overall, this end-user segment is projected to grow rapidly.
• By Distributor
On the basis of distributor, the Asia-Pacific Clinical Trial Imaging Market is segmented into Direct Sales and Tender Sales. The Direct Sales segment dominated the largest market revenue share of 57.1% in 2025, driven by direct engagement with hospitals, CROs, and pharmaceutical companies for customized imaging solutions. Direct sales enable better service, personalized contracts, and faster deployment of imaging platforms. Strong presence in North America and Europe supports dominance. The segment benefits from long-term partnerships, dedicated support teams, and tailored solutions that meet regulatory compliance and client-specific requirements. Direct sales also facilitate easier integration with existing clinical trial workflows, enhancing operational efficiency. Ongoing investments in infrastructure and technology further strengthen this segment’s leadership.
The Tender Sales segment is expected to witness the fastest CAGR of 15.9% from 2026 to 2033, fueled by increasing government-funded trials and large institutional purchases. Tender processes provide transparency, bulk procurement advantages, and cost efficiency, supporting rapid adoption globally. Public and private research institutes increasingly prefer tender-based procurement for high-value imaging solutions. Expansion of clinical trial sites in emerging markets and regional initiatives drives tender demand. Standardized contracts and competitive bidding promote efficiency and accountability. Growth is further enhanced by collaborations between imaging vendors and research networks. Overall, the Tender Sales segment is projected to grow rapidly over the forecast period.
Asia-Pacific Clinical Trial Imaging Market Regional Analysis
- The Asia-Pacific Clinical Trial Imaging Market is projected to grow at the fastest CAGR of 24% during 2026–2033, driven by rapid urbanization, rising disposable incomes, and technological advancements in countries including China, Japan, and India
- The region’s adoption of advanced imaging systems is supported by government initiatives promoting digitalization and healthcare infrastructure expansion. APAC is also emerging as a manufacturing hub for Clinical Trial Imaging components and solutions, which improves affordability and accessibility
- The growing clinical trial activities and pharmaceutical outsourcing further accelerate market penetration, particularly in emerging economies such as India
China Asia-Pacific Clinical Trial Imaging Market Insight
China dominated the Asia-Pacific Clinical Trial Imaging Market with the largest revenue share of approximately 39.8% in 2025, supported by substantial government investment in healthcare infrastructure, state-of-the-art imaging facilities, and strong adoption of innovative imaging technologies in clinical trials. The country’s rapidly expanding middle class, technological adoption, and emphasis on smart healthcare solutions drive market growth. Additionally, the push toward smart cities and domestic manufacturing of imaging systems increases accessibility and affordability, making China the leading hub for Clinical Trial Imaging in the APAC region.
India Asia-Pacific Clinical Trial Imaging Market Insight
India Asia-Pacific Clinical Trial Imaging Market is expected to be the fastest-growing region in the Asia-Pacific Clinical Trial Imaging Market during the forecast period, with a projected CAGR of 9.1%, driven by rising clinical research activities, pharmaceutical outsourcing, and expanding healthcare infrastructure. Government initiatives supporting clinical trials, coupled with increasing adoption of advanced imaging technologies in hospitals and research institutes, are key growth drivers. The affordability of imaging solutions and growing pharmaceutical R&D investment further contribute to India’s rapid market expansion in APAC.
Asia-Pacific Clinical Trial Imaging Market Share
The Clinical Trial Imaging industry is primarily led by well-established companies, including:
• GE Healthcare (U.S.)
• Siemens Healthineers (Germany)
• Canon Medical Systems Corporation (Japan)
• Philips Healthcare (Netherlands)
• Fujifilm Holdings Corporation (Japan)
• Hologic, Inc. (U.S.)
• Agfa-Gevaert Group (Belgium)
• Hitachi Medical Corporation (Japan)
• Shimadzu Corporation (Japan)
• Koninklijke Philips N.V. (Netherlands)
• Carestream Health, Inc. (U.S.)
• Samsung Medison (South Korea)
• Planmeca Oy (Finland)
• Esaote SpA (Italy)
• Neusoft Medical Systems Co., Ltd. (China)
Latest Developments in Asia-Pacific Clinical Trial Imaging Market
- In March 2023, ICON plc announced a significant expansion of its imaging operations to over 100 new trial sites worldwide, enhancing access to advanced imaging services for multi‑site clinical trials and supporting faster, more consistent data capture in therapeutic areas such as oncology and neurology
- In September 2024, ERT (part of what would later become Clario) rolled out a new imaging biomarker validation framework designed specifically to support neurology and rare disease clinical trials, improving the reliability of imaging endpoints and enabling broader adoption of imaging biomarkers
- In January 2025, Medpace announced the expansion of its imaging core laboratory in Cincinnati to include enhanced capabilities for advanced MRI and optical coherence tomography (OCT) analysis, strengthening service offerings for cardiovascular and neurological clinical studies
- In March 2025, Bioclinica, Inc. (which later became part of Clario) launched a new cloud‑native image repository system, enabling streamlined storage, access, and sharing of imaging data across global clinical trials—enhancing collaboration among sponsors, CROs, and imaging sites
- In June 2025, Exactitude Consultancy reported that the Diagnostic Imaging Clinical Trials Market is expanding rapidly with increased integration of advanced imaging modalities such as AI‑enabled imaging, hybrid imaging (e.g., PET/MRI), and digital radiography, driving demand for imaging endpoints and biomarkers in clinical research to improve efficacy and safety assessments
- In October 2025, a market study highlighted that the Asia-Pacific Clinical Trial Imaging Market size rose significantly, with adoption of cloud‑based imaging platforms, AI‑assisted analysis, and decentralized imaging workflows enabling global CROs and sponsors to manage high volumes of imaging data and maintain regulatory compliance
SKU-

- Interactive Data Analysis Dashboard
- Company Analysis Dashboard for high growth potential opportunities
- Research Analyst Access for customization & queries
- Competitor Analysis with Interactive dashboard
- Latest News, Updates & Trend analysis
- Harness the Power of Benchmark Analysis for Comprehensive Competitor Tracking
Data collection and base year analysis are done using data collection modules with large sample sizes. The stage includes obtaining market information or related data through various sources and strategies. It includes examining and planning all the data acquired from the past in advance. It likewise envelops the examination of information inconsistencies seen across different information sources. The market data is analysed and estimated using market statistical and coherent models. Also, market share analysis and key trend analysis are the major success factors in the market report. To know more, please request an analyst call or drop down your inquiry.
The key research methodology used by DBMR research team is data triangulation which involves data mining, analysis of the impact of data variables on the market and primary (industry expert) validation. Data models include Vendor Positioning Grid, Market Time Line Analysis, Market Overview and Guide, Company Positioning Grid, Patent Analysis, Pricing Analysis, Company Market Share Analysis, Standards of Measurement, Global versus Regional and Vendor Share Analysis. To know more about the research methodology, drop in an inquiry to speak to our industry experts.
Data Bridge Market Research is a leader in advanced formative research. We take pride in servicing our existing and new customers with data and analysis that match and suits their goal. The report can be customized to include price trend analysis of target brands understanding the market for additional countries (ask for the list of countries), clinical trial results data, literature review, refurbished market and product base analysis. Market analysis of target competitors can be analyzed from technology-based analysis to market portfolio strategies. We can add as many competitors that you require data about in the format and data style you are looking for. Our team of analysts can also provide you data in crude raw excel files pivot tables (Fact book) or can assist you in creating presentations from the data sets available in the report.


