
Asia Pacific Data Center Cooling Market
Market Size in USD Billion
 USD
3.07 Billion
USD
10.04 Billion
2024
2032
USD
3.07 Billion
USD
10.04 Billion
2024
2032
| 2025 - 2032 | |
| USD 3.07 Billion | |
| USD 10.04 Billion | |
| % | |
|
Asia-Pacific Data Center Cooling Market Size
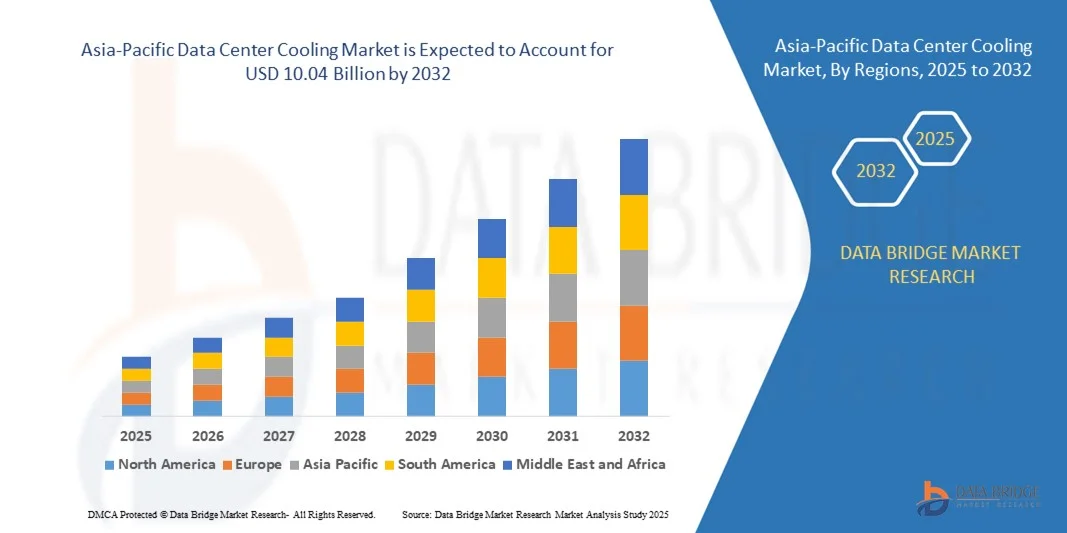
- The Asia-Pacific data center cooling market size was valued at USD 3.07billion in 2024 and is projected to reach USD 10.04billion by 2032, growing at a CAGR of 15.97% during the forecast period
- The market growth is primarily driven by the rapid expansion of data centers, fueled by increasing internet penetration, cloud adoption, and rising demand for big data and IoT applications across the region
- Additionally, growing emphasis on energy-efficient and sustainable cooling technologies is prompting significant investments and innovations in advanced cooling systems, thereby accelerating the overall market expansion
Asia-Pacific Data Center Cooling Market Analysis
- Data center cooling systems, essential for maintaining optimal operating temperatures, are becoming increasingly critical in the Asia-Pacific region as demand for high-performance computing, cloud services, and data storage accelerates across both enterprise and hyperscale data centers
- The surging demand for efficient data center cooling solutions is primarily driven by rapid digital transformation, growing internet usage, and rising investments in AI, IoT, and 5G technologies across emerging economies
- China dominated the Asia-Pacific data center cooling market with the largest revenue share 37.6% in 2024, attributed to its booming data center construction, strong government support for digital infrastructure, and the presence of major tech firms and cloud service providers expanding their regional footprint
- India and Southeast Asia are expected to be the fastest-growing markets during the forecast period due to increasing data consumption, digital initiatives, and the rising need for energy-efficient cooling technologies in new and edge data centers
- The solutions segment dominated the market with the largest revenue share of 63.2% in 2024, owing to widespread deployment of cooling hardware and software systems in hyperscale and enterprise data centers
Report Scope and Asia-Pacific Data Center Cooling Market Segmentation
|
Attributes |
Data Center Cooling Key Market Insights |
|
Segments Covered |
|
|
Countries Covered |
Asia-Pacific
|
|
Key Market Players |
|
|
Market Opportunities |
|
|
Value Added Data Infosets |
In addition to the insights on market scenarios such as market value, growth rate, segmentation, geographical coverage, and major players, the market reports curated by the Data Bridge Market Research also include in-depth expert analysis, pricing analysis, brand share analysis, consumer survey, demography analysis, supply chain analysis, value chain analysis, raw material/consumables overview, vendor selection criteria, PESTLE Analysis, Porter Analysis, and regulatory framework. |
Asia-Pacific Data Center Cooling Market Trends
Enhanced Efficiency Through AI and Intelligent Automation Integration
- A significant and accelerating trend in the Asia-Pacific Data Center Cooling Market is the growing integration of artificial intelligence (AI) and intelligent automation technologies to optimize thermal management and energy consumption in modern data centers. This convergence is dramatically improving operational efficiency, system responsiveness, and sustainability across the region's rapidly expanding digital infrastructure.
- For instance, advanced AI-driven cooling platforms are being deployed to monitor real-time thermal data, dynamically adjust cooling levels, and reduce energy wastage. Leading players like Schneider Electric and Vertiv are offering AI-enabled data center infrastructure management (DCIM) solutions that automatically optimize cooling based on changing workloads and environmental conditions.
- AI technologies enable predictive maintenance by identifying patterns in equipment behavior, detecting early signs of failure in cooling units, and scheduling service proactively to avoid costly downtime. This reduces human intervention and enhances the reliability and uptime of mission-critical data center operations.
- Intelligent automation also allows dynamic workload balancing and heat distribution, ensuring that server workloads are allocated in ways that minimize heat generation hotspots. For example, Huawei’s iCooling solution uses AI algorithms to analyze millions of operational data points and recommend energy-saving strategies, significantly lowering the Power Usage Effectiveness (PUE) in hyperscale and edge data centers.
- The integration of AI with Building Management Systems (BMS) and Internet of Things (IoT) sensors provides centralized, automated control over multiple facility parameters, including temperature, airflow, and humidity, across geographically dispersed data centers. This allows operators to monitor and manage cooling performance from a single interface with higher precision and lower energy costs.
- This growing reliance on AI and automation is reshaping expectations within the Asia-Pacific data center cooling landscape, pushing vendors to innovate with self-optimizing systems, machine learning-enhanced diagnostics, and remote AI-enabled control interfaces. As a result, the demand for AI-integrated cooling technologies is rising across markets like India, Southeast Asia, and China, where digital transformation and hyperscale data center developments are accelerating.
Asia-Pacific Data Center Cooling Market Dynamics
Driver
Growing Need Due to Rising Data Center Demand and Digital Transformation
- The exponential growth in internet usage, cloud computing, and digital services across Asia-Pacific is creating an urgent need for reliable and energy-efficient data center cooling solutions. Countries like China, India, and Southeast Asian nations are witnessing a surge in hyperscale and edge data center construction to support increasing data traffic and low-latency services.
- For instance, in May 2024, NTT Communications announced the expansion of its data center footprint in Indonesia and Thailand, incorporating advanced cooling systems to support sustainable operations and reduce carbon footprint. Such strategic developments by key players are expected to significantly boost demand for innovative cooling technologies across the region.
- Rising adoption of AI, big data, 5G, and IoT is placing unprecedented processing demands on data centers, resulting in higher heat generation and greater cooling requirements. Efficient cooling is essential not only to prevent overheating and downtime but also to comply with regional energy efficiency standards and green building regulations.
- Furthermore, governments in Asia-Pacific are launching digital economy initiatives, such as India's “Digital India” and China’s “New Infrastructure” strategy, which are accelerating investments in digital infrastructure. These trends are making data center cooling systems a foundational requirement for sustainable growth.
- The shift towards colocation and modular data centers, particularly in underserved markets, is also driving the need for flexible, scalable, and energy-efficient cooling solutions that can adapt to diverse climate zones and power constraints found across the region.
Restraint/Challenge
High Energy Consumption and Infrastructure Limitations in Emerging Markets
- Despite the rapid growth of data centers in Asia-Pacific, one of the major challenges for the cooling market is the high energy consumption associated with traditional cooling systems. In regions with unstable power grids or limited infrastructure, this becomes a significant constraint, impacting operational costs and sustainability goals.
- For instance, data centers in parts of Southeast Asia and South Asia often face challenges related to energy availability, high ambient temperatures, and humidity, which can strain cooling systems and reduce overall efficiency. This puts pressure on operators to invest in more advanced and costly solutions like liquid cooling or AI-driven dynamic cooling.
- In addition, initial capital expenditure for modern, energy-efficient cooling technologies can be high, making it difficult for smaller enterprises or operators in developing countries to afford or justify these investments. This cost barrier may slow adoption, especially in Tier II and Tier III cities where demand is growing but resources are limited.
- Regulatory pressures related to environmental sustainability and carbon emissions are also increasing. However, compliance with these regulations often requires upgrades to cooling infrastructure and advanced monitoring systems, adding further financial strain on operators.
- Addressing these challenges will require a combination of technological innovation, cost optimization, and regional policy support. Encouraging the use of renewable energy-powered cooling systems, developing more affordable modular cooling solutions, and investing in training and infrastructure will be key to overcoming these barriers and sustaining long-term market growth.
Asia-Pacific Data Center Cooling Market Scope
The market is segmented on the basis 0f component, organization size, cooling type, data center type, and industry.
- By Components
On the basis of components, the Asia-Pacific data center cooling market is segmented into services and solutions. The solutions segment dominated the market with the largest revenue share of 63.2% in 2024, owing to widespread deployment of cooling hardware and software systems in hyperscale and enterprise data centers. These include CRAC units, liquid cooling systems, chillers, and DCIM-integrated cooling solutions. As data volume surges, advanced cooling solutions enable energy-efficient operations while maintaining optimal server performance and uptime.
The services segment is projected to witness the fastest CAGR from 2025 to 2032, driven by rising demand for consulting, maintenance, retrofitting, and performance monitoring. With increased outsourcing of data center operations, managed cooling services and remote diagnostics are gaining traction. Service providers are also expanding into modular and edge data center segments, supporting scalability, compliance, and sustainability goals across rapidly growing digital ecosystems in the region.
- By Organization Size
Based on organization size, the Asia-Pacific data center cooling market is segmented into large, medium, and small organizations. The large organization segment held the largest market share of 49.7% in 2024, due to their expansive IT infrastructure and substantial investments in energy-efficient, redundant cooling systems. These organizations often operate high-density data centers requiring precision cooling, liquid immersion systems, and scalable HVAC infrastructure to minimize thermal risk and maximize uptime.
The small organization segment is expected to grow at the fastest CAGR from 2025 to 2032, as the adoption of modular data centers increases among startups and SMEs. Cost-effective, compact cooling solutions are appealing to smaller entities, especially those leveraging edge computing or colocating within micro data centers. With digital transformation accelerating in emerging economies, small businesses are investing in smart, pre-configured cooling units to ensure data resilience without heavy capital expenditure.
- By Cooling Type
On the basis of cooling type, the market is segmented into room-based cooling, rack-based cooling, and row-based cooling. The room-based cooling segment dominated the market with a 44.1% revenue share in 2024, as it remains widely used in traditional and retrofitted data centers. These systems are easy to deploy and offer centralized thermal management, making them suitable for large-scale facilities operating under conventional layouts.
The rack-based cooling segment is projected to witness the fastest CAGR from 2025 to 2032, fueled by the shift toward high-density and compact data center configurations. Rack-based cooling offers targeted thermal control at the equipment level, reducing energy waste and enabling closer component integration. The need for precision, space-saving solutions in hyperscale and edge facilities is accelerating demand. Additionally, integration with AI-driven thermal monitoring systems makes rack cooling ideal for dynamic, scalable environments.
- By Data Center Type
The Asia-Pacific data center cooling market is segmented by data center type into enterprise, colocation, wholesale, hyperscale, and others. The enterprise data center segment led the market in 2024 with a 38.6% revenue share, driven by continued demand from banks, government bodies, and large enterprises needing secure, on-premise infrastructure. These centers prioritize efficient cooling to ensure operational continuity, data integrity, and regulatory compliance.
The hyperscale data center segment is expected to register the highest CAGR from 2025 to 2032, reflecting aggressive cloud expansion by global tech giants and regional players. These massive facilities demand scalable and highly energy-efficient cooling, such as chilled water systems, liquid immersion, and AI-optimized airflow management. Hyperscale operators are also investing heavily in sustainable cooling technologies, such as free cooling and renewable-powered systems, to meet environmental goals and manage operational costs at scale.
- By Industry
By industry, the Asia-Pacific data center cooling market is segmented into BFSI, IT & Telecom, Research & Academic, Government & Defense, Retail, Energy, Manufacturing, Healthcare, Media & Entertainment, and Transportation & Logistics. The IT & Telecom segment accounted for the largest market share of 18.4% in 2024, supported by the region’s rapid 5G rollout, cloud adoption, and exponential data traffic. Data centers supporting telecom networks and cloud services require robust, reliable cooling systems to ensure uninterrupted performance.
The Healthcare segment is projected to witness the fastest CAGR from 2025 to 2032, fueled by the digitalization of healthcare records, telemedicine, and AI-driven diagnostics. Hospitals and research labs are increasingly building on-premise or hybrid data centers to manage sensitive patient data and applications—requiring highly controlled environments. Cooling solutions with contamination control, energy efficiency, and remote operability are in high demand to support continuous medical and research operations.
Asia-Pacific Data Center Cooling Market Regional Analysis
- China dominated the data center cooling market with the largest revenue share of 37.6% in 2024, driven by rapid digital transformation, increasing data center investments, and growing adoption of cloud computing and IoT technologies across the region.
- The region's expanding IT infrastructure and rising demand for efficient and scalable cooling solutions to support hyperscale and edge data centers contribute significantly to market growth.
- This widespread adoption is further supported by increasing government initiatives for smart cities, rising foreign direct investments, and the presence of major cloud service providers, establishing Asia-Pacific as a key hub for data center cooling solutions across industries including IT & Telecom, BFSI, and manufacturing.
China Data Center Cooling Market Insight
China held the largest revenue share in the Asia-Pacific data center cooling market in 2024, driven by rapid digital transformation, government support for data center infrastructure, and the expansion of hyperscale and colocation facilities. The country’s strategic initiatives to become a global data hub and investments in green data centers are accelerating the adoption of advanced and energy-efficient cooling systems. Domestic manufacturing capabilities and technological innovation further strengthen China’s leadership in the regional market.
Japan Data Center Cooling Market Insight
Japan’s data center cooling market is experiencing stable growth, fueled by the rising demand for cloud services, edge computing, and IoT integration. The country’s focus on energy efficiency and space optimization in urban data centers drives the adoption of liquid cooling and modular solutions. Additionally, the presence of major telecom and technology companies, along with government incentives for digital infrastructure, supports the steady expansion of the market.
India Data Center Cooling Market Insight
India is emerging as the fastest-growing market for data center cooling in Asia-Pacific, driven by surging data consumption, cloud adoption, and digitalization across industries. Government-backed initiatives like Digital India and data localization policies are encouraging the development of new data centers, thereby boosting demand for efficient cooling solutions. Rising energy costs and sustainability goals are further prompting investments in smart and eco-friendly cooling technologies.
South Korea Data Center Cooling Market Insight
South Korea’s data center cooling market is witnessing robust growth, supported by its advanced ICT infrastructure, growing demand for cloud storage, and expansion of 5G networks. The country's commitment to technological innovation and smart city development fuels the adoption of intelligent and high-performance cooling systems. Emphasis on energy efficiency and automation is driving the integration of AI and IoT-based cooling management solutions, particularly in hyperscale and edge data centers.
Asia-Pacific Data Center Cooling Market Share
The Data Center Cooling industry is primarily led by well-established companies, including:
- Schneider Electric (France)
- Cisco Systems, Inc. (U.S.)
- ABB Ltd. (Switzerland)
- Hewlett Packard Enterprise Development LP (U.S.)
- Dell Technologies (U.S.)
- Hitachi Ltd (Japan)
- Huawei Technologies Co., Ltd. (China)
- NTT Communications (Japan)
- Comarch SA (Poland)
- IBM Corporation (U.S.)
- Vertiv Co. (U.S.)
- Eaton Corporation plc (Ireland)
- Rittal GmbH & Co. KG (Germany)
- STULZ GmbH (Germany)
- Asetek A/S (Denmark)
- Coolcentric (U.S.)
- ClimateWorx International Inc. (Canada)
- Delta Electronics Inc. (Taiwan)
- Fujitsu Limited (Japan)
- Johnson Controls International plc (Ireland)
- Mitsubishi Electric Corporation (Japan)
- Trane Technologies plc (Ireland)
- Vigilent Corporation (U.S.)
- Lenovo Group Limited (China)
- CommScope Holding Company, Inc. (U.S.)
- Emerson Electric Co. (U.S.)
What are the Recent Developments in Asia-Pacific Data Center Cooling Market?
- In April 2023, Daikin Industries Ltd., a global leader in HVAC and cooling solutions, launched a strategic initiative in India to enhance data center cooling efficiency using its advanced, energy-saving technologies. This initiative highlights Daikin’s commitment to providing sustainable and high-performance cooling systems tailored to the unique needs of rapidly expanding data centers in the Asia-Pacific region. By leveraging its global expertise and innovative product portfolio, Daikin aims to address the growing demand for efficient thermal management in data centers, strengthening its position in the booming Asia-Pacific Data Center Cooling Market.
- In March 2023, Stulz GmbH, a Germany-based company with a strong presence in Asia-Pacific, introduced its latest precision cooling units designed specifically for hyperscale and edge data centers. The new systems focus on maximizing energy efficiency and reliability under high-density workloads, addressing the region’s increasing data processing demands. This product launch underscores Stulz’s dedication to advancing data center cooling technology and supporting Asia-Pacific’s growing digital infrastructure.
- In March 2023, Vertiv Holdings Co. successfully completed the deployment of a large-scale cooling infrastructure at a leading colocation facility in Singapore. The project incorporates state-of-the-art cooling technologies to optimize energy use and maintain optimal operating temperatures for critical IT equipment. This deployment demonstrates Vertiv’s expertise in delivering customized cooling solutions for diverse data center environments, contributing to the region’s smart and resilient digital ecosystem development.
- In February 2023, Eaton Corporation plc announced a strategic partnership with a major hyperscale data center operator in South Korea to implement advanced cooling management solutions. This collaboration aims to enhance operational efficiency and reduce energy consumption across the operator’s data centers, aligning with sustainability goals and cost reduction strategies. Eaton’s commitment to innovation and sustainability is evident in its tailored cooling solutions designed for the Asia-Pacific data center market.
- In January 2023, Schneider Electric SE unveiled its latest EcoStruxure data center cooling management platform at the Data Centre World Asia event. Equipped with IoT-enabled sensors and AI-driven analytics, the platform allows data center operators to remotely monitor and optimize cooling performance in real-time. This launch highlights Schneider Electric’s leadership in integrating smart technology with cooling infrastructure, offering enhanced energy efficiency and operational control for data centers across Asia-Pacific.
SKU-

- Interactive Data Analysis Dashboard
- Company Analysis Dashboard for high growth potential opportunities
- Research Analyst Access for customization & queries
- Competitor Analysis with Interactive dashboard
- Latest News, Updates & Trend analysis
- Harness the Power of Benchmark Analysis for Comprehensive Competitor Tracking
Data collection and base year analysis are done using data collection modules with large sample sizes. The stage includes obtaining market information or related data through various sources and strategies. It includes examining and planning all the data acquired from the past in advance. It likewise envelops the examination of information inconsistencies seen across different information sources. The market data is analysed and estimated using market statistical and coherent models. Also, market share analysis and key trend analysis are the major success factors in the market report. To know more, please request an analyst call or drop down your inquiry.
The key research methodology used by DBMR research team is data triangulation which involves data mining, analysis of the impact of data variables on the market and primary (industry expert) validation. Data models include Vendor Positioning Grid, Market Time Line Analysis, Market Overview and Guide, Company Positioning Grid, Patent Analysis, Pricing Analysis, Company Market Share Analysis, Standards of Measurement, Global versus Regional and Vendor Share Analysis. To know more about the research methodology, drop in an inquiry to speak to our industry experts.
Data Bridge Market Research is a leader in advanced formative research. We take pride in servicing our existing and new customers with data and analysis that match and suits their goal. The report can be customized to include price trend analysis of target brands understanding the market for additional countries (ask for the list of countries), clinical trial results data, literature review, refurbished market and product base analysis. Market analysis of target competitors can be analyzed from technology-based analysis to market portfolio strategies. We can add as many competitors that you require data about in the format and data style you are looking for. Our team of analysts can also provide you data in crude raw excel files pivot tables (Fact book) or can assist you in creating presentations from the data sets available in the report.


