
Asia Pacific Diet And Nutrition Apps Market
Market Size in USD Billion
 USD
1.86 Billion
USD
16.46 Billion
2025
2033
USD
1.86 Billion
USD
16.46 Billion
2025
2033
| 2026 - 2033 | |
| USD 1.86 Billion | |
| USD 16.46 Billion | |
| % | |
|
Asia-Pacific Diet and Nutrition Apps Market Size
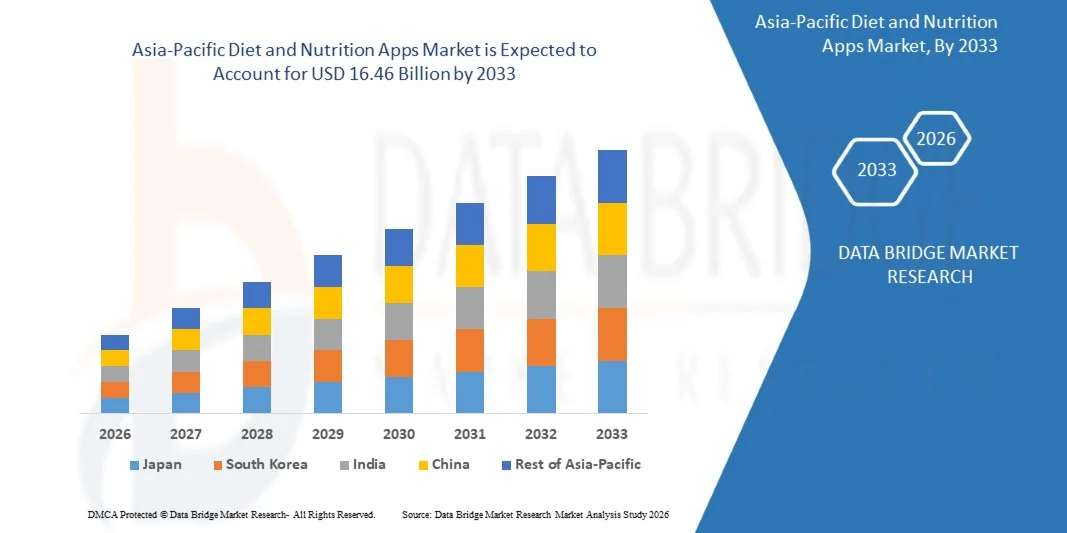
- The Asia-Pacific Diet and Nutrition Apps Market size was valued at USD 1.86 billion in 2025 and is expected to reach USD 16.46 billion by 2033, at a CAGR of 31.3% during the forecast period
- The market growth is largely driven by the increasing adoption of smartphones and wearable devices, coupled with advancements in mobile app technology that enable personalized nutrition tracking and health monitoring
- Furthermore, rising consumer awareness regarding healthy lifestyles and preventive healthcare is encouraging individuals to use diet and nutrition apps for meal planning, calorie tracking, and fitness monitoring. For instance, apps such as MyFitnessPal are witnessing significant adoption due to their comprehensive tracking features and integration with wearable devices, thereby accelerating market growth
Asia-Pacific Diet and Nutrition Apps Market Analysis
- Diet and nutrition apps, providing personalized meal recommendations, calorie tracking, and nutrient monitoring, are becoming essential tools for individuals seeking to maintain health, manage weight, or prevent lifestyle-related diseases due to their convenience, real-time feedback, and integration with fitness ecosystems
- The escalating demand for these apps is primarily fueled by the growing prevalence of lifestyle diseases such as obesity and diabetes, increasing health-consciousness among consumers, and the rising trend of digital health management through mobile platforms
- China dominated the Asia-Pacific Diet and Nutrition Apps Market in 2025, due to high smartphone penetration, increasing health-consciousness among urban consumers, and widespread adoption of digital fitness and wellness platforms
- India is expected to be the fastest growing country in the Asia-Pacific Diet and Nutrition Apps Market during the forecast period due to increasing smartphone penetration, rising health awareness among millennials, and growing adoption of fitness and lifestyle apps
- Smartphones segment dominated the market with a market share of 67.5% in 2025, due to the widespread penetration of smartphones and the convenience they provide for real-time diet monitoring and health management. Most diet and nutrition applications are designed primarily for smartphone platforms, enabling users to track meals, monitor health metrics, and receive dietary recommendations throughout the day
Report Scope and Asia-Pacific Diet and Nutrition Apps Market Segmentation
|
Attributes |
Diet and Nutrition Apps Key Market Insights |
|
Segments Covered |
|
|
Countries Covered |
Asia-Pacific
|
|
Key Market Players |
|
|
Market Opportunities |
|
|
Value Added Data Infosets |
In addition to the market insights such as market value, growth rate, market segments, geographical coverage, market players, and market scenario, the market report curated by the Data Bridge Market Research team includes in-depth expert analysis, import/export analysis, pricing analysis, production consumption analysis, and pestle analysis. |
Asia-Pacific Diet and Nutrition Apps Market Trends
“Increasing Personalization and AI Integration in Diet and Nutrition Apps”
- A significant trend in the Asia-Pacific Diet and Nutrition Apps Market is the growing adoption of AI-driven personalization features, enabling users to receive tailored meal plans, nutrient tracking, and dietary recommendations based on individual health data, preferences, and goals. This trend is driven by consumers’ rising demand for customized health management and data-driven insights that enhance diet effectiveness
- For instance, MyFitnessPal and Lifesum leverage AI algorithms to provide personalized nutrition guidance, integrating food databases, user activity, and biometric data to deliver actionable insights. Such AI-powered personalization increases user engagement and encourages sustained use of nutrition apps for long-term health management
- The integration of AI and machine learning in diet apps is enabling predictive analytics that anticipate dietary needs, suggest nutrient adjustments, and offer proactive health recommendations. This positions diet and nutrition apps as essential digital tools for preventative healthcare and chronic disease management
- Wearable device connectivity is further enhancing app personalization, allowing apps to synchronize with devices such as Fitbit or Apple Watch to track calorie burn, heart rate, and activity patterns. This synchronization supports comprehensive health monitoring and improves the accuracy of dietary recommendations
- The market is witnessing innovation in behavioral and habit-based coaching within apps, using AI to monitor eating patterns, provide reminders, and motivate users toward healthier choices. This approach strengthens app effectiveness and user retention
- Diet and nutrition apps are also expanding globally as mobile health adoption grows, particularly in regions with high smartphone penetration and increasing health awareness. This expansion is driving app providers to continuously refine AI features, ensuring culturally relevant, region-specific dietary guidance that meets diverse consumer needs
Asia-Pacific Diet and Nutrition Apps Market Dynamics
Driver
“Rising Health Awareness and Smartphone Penetration Globally”
- The increasing awareness of lifestyle-related health risks, such as obesity, diabetes, and cardiovascular diseases, is encouraging consumers to adopt mobile solutions for diet management, tracking, and preventive care. Smartphone proliferation and mobile internet access are facilitating widespread adoption of diet and nutrition apps across diverse demographics
- For instance, Noom has gained global traction by combining psychological behavior tracking with nutrition guidance, demonstrating how health awareness drives app usage. Such applications enable users to make informed lifestyle choices and support long-term health improvement
- The growing emphasis on preventive healthcare and wellness programs is encouraging integration of diet apps into daily routines, corporate wellness schemes, and fitness regimes. Consumers increasingly rely on app analytics to monitor caloric intake, nutrient balance, and physical activity, creating a seamless approach to health management
- Mobile-first strategies are accelerating the adoption of nutrition apps, particularly in emerging markets where smartphone usage is high and access to traditional healthcare advice may be limited. This trend is supporting broader consumer engagement and app-based healthcare initiatives
- The surge in fitness app subscriptions, nutrition challenges, and social integration features is amplifying demand. Consumers are increasingly drawn to interactive, data-rich apps that combine community motivation, gamification, and personalized coaching to maintain adherence to health goals
Restraint/Challenge
“Data Privacy and Accuracy Concerns in Nutrition Tracking Apps”
- The Asia-Pacific Diet and Nutrition Apps Market faces challenges due to concerns over data security, storage, and privacy, as sensitive health and personal information is collected and processed by these platforms. Ensuring compliance with regulations such as GDPR or HIPAA adds complexity for app developers and service providers
- For instance, MyFitnessPal experienced a data breach in 2018, highlighting the vulnerability of personal health information and raising consumer concerns. Such incidents can affect user trust and slow market adoption unless robust security measures are implemented
- Accuracy of food databases, calorie counts, and nutrient calculations presents another significant challenge. Variations in ingredient reporting, regional foods, and user-entered data can impact app reliability and diminish user confidence
- The reliance on smartphone sensors and wearable devices introduces potential inaccuracies in activity tracking, which may affect diet recommendations and overall user outcomes. Addressing these technological limitations is critical to maintaining app credibility
- The market also encounters barriers related to user engagement and retention, as inconsistent data input, complex app interfaces, or limited personalization can discourage sustained use. Overcoming these challenges is essential for app providers to maintain relevance and competitive positioning
Asia-Pacific Diet and Nutrition Apps Market Scope
The market is segmented on the basis of type, products, gender, age, platform, and end-user.
• By Type
On the basis of type, the Asia-Pacific Diet and Nutrition Apps Market is segmented into nutrition tracking app, activity tracking app, social platform apps, wager apps, and others. The nutrition tracking app segment dominated the market with the largest market revenue share in 2025, driven by the rising focus on calorie monitoring, personalized diet planning, and weight management among health-conscious consumers. These applications allow users to log daily meals, monitor nutrient intake, and receive personalized dietary recommendations, making them essential tools for individuals managing lifestyle-related health conditions. Integration with AI-based food recognition, barcode scanning, and nutrient databases further enhances user convenience and engagement. The increasing prevalence of obesity and chronic diseases has strengthened the adoption of nutrition tracking apps for preventive healthcare and daily wellness management.
The activity tracking app segment is anticipated to witness the fastest growth rate from 2026 to 2033, fueled by the growing adoption of digital fitness solutions and increasing awareness of physical activity as a critical component of healthy lifestyles. These applications track workouts, step counts, calories burned, and physical performance metrics, helping users maintain balanced fitness and nutrition routines. The rapid expansion of wearable fitness devices and smartphone sensors has enhanced the accuracy and usability of activity tracking features within diet and nutrition platforms. Users increasingly prefer integrated solutions that combine fitness monitoring with dietary guidance, encouraging greater demand for such applications. The rising popularity of personalized fitness plans and goal-based health programs is further accelerating the growth of activity tracking apps within the market.
• By Products
On the basis of products, the Asia-Pacific Diet and Nutrition Apps Market is segmented into smartphones, wearable devices, and tablets. The smartphones segment dominated the market with the largest market revenue share of 67.5% in 2025, primarily due to the widespread penetration of smartphones and the convenience they provide for real-time diet monitoring and health management. Most diet and nutrition applications are designed primarily for smartphone platforms, enabling users to track meals, monitor health metrics, and receive dietary recommendations throughout the day. Smartphones offer advanced features such as cameras for food recognition, GPS tracking for activity monitoring, and integration with health applications and wearable devices. Their portability and constant connectivity make them ideal platforms for maintaining daily nutrition logs and health insights. In addition, the growing availability of health-focused mobile applications and digital wellness ecosystems further strengthens smartphone adoption within the Asia-Pacific Diet and Nutrition Apps Market.
The wearable devices segment is expected to witness the fastest CAGR from 2026 to 2033, driven by the increasing adoption of smartwatches and fitness bands that provide continuous health monitoring. Wearable devices enable users to track physical activity, calorie expenditure, heart rate, and sleep patterns, which can be synchronized with diet and nutrition applications for comprehensive health insights. The growing emphasis on preventive healthcare and real-time health analytics has encouraged consumers to adopt wearable technologies alongside nutrition apps. Integration between wearables and mobile health platforms allows users to receive personalized dietary recommendations based on daily activity levels and metabolic data. As wearable technology continues to advance with improved sensors and AI-based analytics, its role in supporting digital nutrition and wellness management is expected to expand significantly.
• By Gender
On the basis of gender, the Asia-Pacific Diet and Nutrition Apps Market is segmented into women and men. The women segment dominated the market with the largest market revenue share in 2025, driven by the increasing focus on weight management, nutritional balance, and overall wellness among female users. Women often utilize diet and nutrition applications for calorie tracking, meal planning, and monitoring nutritional intake during various life stages including pregnancy, fitness programs, and health management. Many apps provide specialized features tailored to female health needs, including hormonal health tracking and personalized diet guidance. The strong participation of women in digital fitness communities and online wellness programs further contributes to the higher adoption of nutrition apps. In addition, social sharing features and community-based motivation tools encourage engagement among female users seeking structured diet management solutions.
The men segment is anticipated to witness the fastest growth rate from 2026 to 2033, fueled by the increasing interest in muscle building, sports nutrition, and performance-based fitness goals. Male users increasingly rely on diet and nutrition apps to track protein intake, calorie consumption, and macronutrient balance for strength training and athletic performance. The rising popularity of gym culture, bodybuilding programs, and performance optimization has encouraged men to adopt digital nutrition tracking tools. Integration with workout tracking systems and wearable devices allows male users to monitor both dietary intake and physical performance in a unified platform. Growing awareness of the role of nutrition in improving energy levels, endurance, and recovery further supports the rapid adoption of diet and nutrition apps among male users.
• By Age
On the basis of age, the Asia-Pacific Diet and Nutrition Apps Market is segmented into adults, teenagers, and aged. The adults segment dominated the market with the largest market revenue share in 2025, driven by increasing concerns regarding weight management, chronic disease prevention, and lifestyle-related health conditions. Adults frequently use diet and nutrition applications to monitor calorie intake, maintain balanced diets, and follow personalized meal plans aligned with health goals. Busy professional lifestyles have also increased the reliance on mobile health solutions that provide convenient and structured nutrition guidance. Many adults utilize these apps as part of broader digital health ecosystems that integrate fitness tracking, wellness coaching, and medical monitoring. In addition, the growing awareness of preventive healthcare and long-term wellness planning continues to support strong adoption among adult users.
The teenagers segment is expected to witness the fastest growth rate from 2026 to 2033, driven by increasing digital engagement and rising awareness of fitness and body wellness among younger populations. Teenagers are highly active smartphone users and are more inclined to adopt mobile applications that support healthy lifestyle habits and fitness goals. Social media influence and digital fitness communities have encouraged younger users to monitor their diet, exercise routines, and overall health performance. Nutrition apps provide interactive features such as goal setting, gamification, and personalized recommendations that appeal strongly to younger audiences. The growing emphasis on healthy habits during early life stages and rising participation in sports and fitness activities further supports rapid adoption among teenagers.
• By Platform
On the basis of platform, the Asia-Pacific Diet and Nutrition Apps Market is segmented into Android, iOS, Windows, and others. The Android segment dominated the market with the largest market revenue share in 2025, driven by the extensive global user base of Android smartphones and the wide availability of diet and nutrition applications on the platform. Android devices are widely accessible across both developed and emerging markets, enabling a large population to access digital health and nutrition services. The open ecosystem of the Android platform allows developers to introduce innovative health applications with diverse features and pricing models. In addition, compatibility with a broad range of smartphones and wearable devices supports the expansion of Android-based nutrition applications. The strong presence of health and wellness apps on the Google Play ecosystem further strengthens the dominance of the Android platform in the market.
The iOS segment is anticipated to witness the fastest growth rate from 2026 to 2033, supported by the high adoption of premium health and wellness applications among iPhone users. iOS users often demonstrate higher engagement with digital health platforms and subscription-based wellness services. Apple’s integrated health ecosystem, including health data synchronization and wearable device connectivity, enhances the effectiveness of diet and nutrition applications. The seamless integration of nutrition apps with digital health records, fitness tracking systems, and wearable devices provides users with comprehensive wellness insights. In addition, the growing demand for advanced, privacy-focused health applications within the Apple ecosystem contributes to the strong growth outlook for the iOS platform segment.
• By End-User
On the basis of end-user, the Asia-Pacific Diet and Nutrition Apps Market is segmented into fitness centers, healthcare industries, homecare settings, and others. The homecare settings segment dominated the market with the largest market revenue share in 2025, driven by the increasing adoption of digital health tools for personal wellness management. Individuals increasingly prefer managing their diet plans, calorie intake, and health goals independently using mobile applications from home. Diet and nutrition apps offer personalized recommendations, meal planning features, and progress monitoring tools that support daily health management without requiring professional supervision. The rising focus on preventive healthcare and self-care practices has further encouraged individuals to use digital nutrition platforms within home environments. In addition, the convenience and affordability of mobile health applications have significantly contributed to their widespread adoption in homecare settings.
The healthcare industries segment is expected to witness the fastest CAGR from 2026 to 2033, driven by the growing integration of digital health technologies within clinical nutrition and patient management programs. Healthcare providers increasingly utilize diet and nutrition applications to monitor patient dietary habits, manage chronic diseases, and support personalized treatment plans. These platforms help professionals track patient progress, provide nutritional guidance, and improve adherence to medical nutrition therapy. The increasing adoption of telehealth and remote patient monitoring systems has further expanded the role of nutrition apps within healthcare environments. As healthcare institutions continue to adopt digital tools to improve patient outcomes and preventive care strategies, the demand for diet and nutrition applications within healthcare industries is expected to grow rapidly.
Asia-Pacific Diet and Nutrition Apps Market Regional Analysis
- China dominated the Asia-Pacific Diet and Nutrition Apps Market with the largest revenue share in 2025, driven by high smartphone penetration, increasing health-consciousness among urban consumers, and widespread adoption of digital fitness and wellness platforms
- Government initiatives promoting preventive healthcare, growing corporate wellness programs, and the expansion of mobile health ecosystems reinforce China’s leadership in the regional market
- The presence of leading domestic app developers, collaborations with international health and fitness platforms, and the introduction of AI-powered, personalized nutrition apps continue to consolidate China’s dominant position during the forecast period. Integration with wearable devices and rising consumer focus on healthy lifestyles further strengthen market penetration across urban and semi-urban areas
Japan Asia-Pacific Diet and Nutrition Apps Market Insight
The Japan market is anticipated to grow steadily from 2026 to 2033, supported by its advanced mobile technology infrastructure and strong emphasis on health and wellness. Japanese consumers are increasingly adopting premium nutrition apps that offer personalized meal plans, calorie tracking, and integration with wearable fitness devices, reflecting the country’s focus on innovation and digital health reliability. The demand for multifunctional apps that combine dietary guidance with lifestyle and fitness coaching is rising due to aging populations and urban living trends. Continuous R&D by domestic developers and collaborations with global platforms reinforce the market’s steady growth outlook. Japan’s commitment to health innovation, digital adoption, and consumer trust underpins its strong regional positioning.
India Asia-Pacific Diet and Nutrition Apps Market Insight
India is projected to register the fastest CAGR in the Asia-Pacific Diet and Nutrition Apps Market during 2026–2033, fueled by increasing smartphone penetration, rising health awareness among millennials, and growing adoption of fitness and lifestyle apps. Government campaigns promoting preventive healthcare and corporate wellness initiatives are accelerating adoption. The demand for affordable, easy-to-use, and localized nutrition apps is particularly strong among first-time users seeking digital health solutions. Expanding app marketplaces, rapid growth of mobile internet access, and partnerships with international health and fitness platforms are enhancing app accessibility. Government focus on digital health initiatives and rising consumer emphasis on preventive wellness ensure India’s emergence as the fastest-growing market in the region.
Asia-Pacific Diet and Nutrition Apps Market Share
The diet and nutrition apps industry is primarily led by well-established companies, including:
- MyFitnessPal, Inc. (U.S.)
- Noom, Inc (U.S.)
- Lifesum AB (Sweden)
- FitNow, Inc. (U.S.)
- MyNetDiary Inc. (U.S.)
- Innit International SCA (U.S.)
- Kroger (U.S.)
- Fatsecret (Australia)
- Fitocracy (U.S.)
- Wombat Apps LLC (U.S.)
- Syndigo LLC (U.S.)
- foodvisor.io (France)
- Eat This Much Inc. (U.S.)
- asken Inc. (Japan)
- Leaf Group (U.S.)
- Avatar Nutrition LLC. (U.S.)
Latest Developments in Asia-Pacific Diet and Nutrition Apps Market
- In February 2025, MyFitnessPal, Inc. announced the acquisition of Intent, a personalized meal-planning application, to strengthen its diet guidance and customized nutrition planning capabilities within the platform. This strategic move expands MyFitnessPal’s ecosystem by integrating advanced meal planning tools that help users create tailored diet programs aligned with their health goals and preferences. The acquisition enables the company to offer deeper personalization, improving the overall user experience and engagement across its large user base. By enhancing its nutrition intelligence and personalization features, MyFitnessPal strengthens its competitive positioning within the rapidly evolving digital health and nutrition technology market. The development reflects the growing emphasis on AI-driven diet planning and comprehensive wellness ecosystems in diet and nutrition applications
- In October 2023, MyFitnessPal, Inc. introduced its Wear OS application, enabling seamless integration with Wear OS smartwatches for tracking nutrition and physical activity directly from wearable devices. This launch allows users to monitor calories burned, steps taken, workouts completed, and dietary intake without needing to access their smartphones, thereby improving accessibility and convenience in daily health management. The integration of smartwatch functionality enhances real-time data tracking and supports continuous health monitoring through wearable ecosystems. This development significantly contributes to the expansion of wearable-based health management solutions within the digital nutrition space. As wearable technology adoption continues to grow globally, such innovations strengthen the role of nutrition applications within broader digital wellness platforms
- In September 2023, Noom launched a new artificial intelligence-powered feature designed to generate personalized meal recommendations based on users’ dietary preferences and health objectives. This innovation enhances the platform’s ability to provide tailored nutritional guidance through AI-driven analysis of user behavior, dietary habits, and wellness goals. By delivering customized meal suggestions and adaptive guidance, the feature improves user engagement and satisfaction within the application. The development positions Noom as a key innovator in the integration of artificial intelligence within digital nutrition platforms. Such advancements demonstrate the increasing importance of AI technologies in delivering personalized health solutions and strengthening competitive differentiation in the Asia-Pacific Diet and Nutrition Apps Market
- In July 2023, Cronometer introduced a subscription-based model offering premium services including personalized coaching and advanced nutrient analysis tools. This strategic expansion enables the company to diversify revenue streams while providing users with deeper insights into micronutrient intake and personalized dietary optimization. The premium features allow users to access detailed nutritional analytics and expert guidance, improving the effectiveness of digital nutrition tracking. The move reflects the growing trend of subscription-based monetization strategies within digital health applications. By enhancing value-added services and personalized support, Cronometer strengthens user retention and expands its presence within the competitive nutrition technology ecosystem
- In March 2023, Zoe secured USD 2.5 million in funding from Flight Fund to advance its microbiome-based personalized nutrition platform. The investment supports the expansion of Zoe’s data-driven dietary guidance system, which uses microbiome analysis to deliver individualized nutrition recommendations tailored to each user’s biological profile. This development enables the company to enhance scientific accuracy and personalization in its nutrition insights, providing users with deeper understanding of how food affects their metabolism and overall health. By strengthening its research capabilities and technological infrastructure, Zoe enhances its competitive position within the personalized nutrition segment. The funding highlights the increasing role of biotechnology and data analytics in shaping next-generation diet and nutrition applications
SKU-

- Interactive Data Analysis Dashboard
- Company Analysis Dashboard for high growth potential opportunities
- Research Analyst Access for customization & queries
- Competitor Analysis with Interactive dashboard
- Latest News, Updates & Trend analysis
- Harness the Power of Benchmark Analysis for Comprehensive Competitor Tracking
Data collection and base year analysis are done using data collection modules with large sample sizes. The stage includes obtaining market information or related data through various sources and strategies. It includes examining and planning all the data acquired from the past in advance. It likewise envelops the examination of information inconsistencies seen across different information sources. The market data is analysed and estimated using market statistical and coherent models. Also, market share analysis and key trend analysis are the major success factors in the market report. To know more, please request an analyst call or drop down your inquiry.
The key research methodology used by DBMR research team is data triangulation which involves data mining, analysis of the impact of data variables on the market and primary (industry expert) validation. Data models include Vendor Positioning Grid, Market Time Line Analysis, Market Overview and Guide, Company Positioning Grid, Patent Analysis, Pricing Analysis, Company Market Share Analysis, Standards of Measurement, Global versus Regional and Vendor Share Analysis. To know more about the research methodology, drop in an inquiry to speak to our industry experts.
Data Bridge Market Research is a leader in advanced formative research. We take pride in servicing our existing and new customers with data and analysis that match and suits their goal. The report can be customized to include price trend analysis of target brands understanding the market for additional countries (ask for the list of countries), clinical trial results data, literature review, refurbished market and product base analysis. Market analysis of target competitors can be analyzed from technology-based analysis to market portfolio strategies. We can add as many competitors that you require data about in the format and data style you are looking for. Our team of analysts can also provide you data in crude raw excel files pivot tables (Fact book) or can assist you in creating presentations from the data sets available in the report.


