
Asia Pacific Digital Therapeutics Market
Market Size in USD Billion
 USD
4.66 Billion
USD
25.08 Billion
2024
2032
USD
4.66 Billion
USD
25.08 Billion
2024
2032
| 2025 - 2032 | |
| USD 4.66 Billion | |
| USD 25.08 Billion | |
| % | |
|
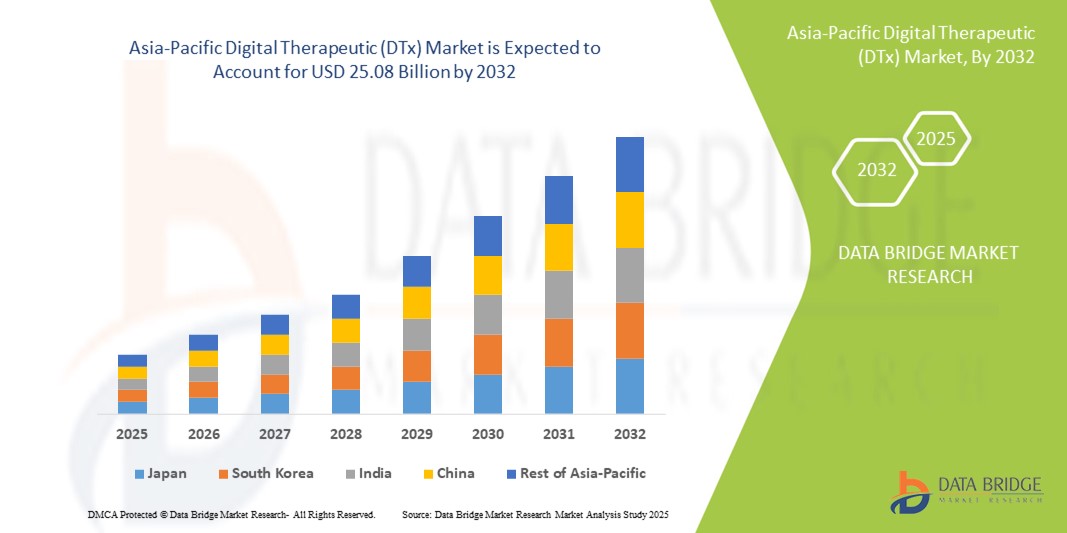
Asia-Pacific Digital Therapeutic (DTx) Market Size
- The Asia-Pacific digital therapeutic (DTx) market size was valued at USD 4.66 billion in 2024 and is expected to reach USD 25.08 billion by 2032, at a CAGR of 23.40% during the forecast period
- The market growth is primarily driven by the increasing prevalence of chronic diseases, rising healthcare digitalization, and the growing focus on cost-effective and patient-centric care delivery across the region
- In addition, expanding smartphone penetration, greater internet accessibility, and supportive regulatory frameworks are enhancing patient engagement and encouraging widespread adoption of DTx solutions. These dynamics are propelling the Asia-Pacific DTx market forward, solidifying its role in the region’s evolving digital health ecosystem
Asia-Pacific Digital Therapeutic (DTx) Market Analysis
- Digital therapeutics (DTx), which deliver evidence-based therapeutic interventions via software to prevent, manage, or treat medical conditions, are becoming an integral component of the healthcare landscape in the Asia-Pacific region due to their scalability, remote access capabilities, and ability to support chronic disease management and mental health care
- The growing demand for DTx in Asia-Pacific is primarily driven by the rising incidence of lifestyle-related chronic diseases, increasing focus on preventive healthcare, and heightened awareness of digital health solutions among both patients and healthcare providers
- Japan dominated the Asia-Pacific digital therapeutic (DTx) market with the largest revenue share of 37.3% in 2024, supported by its advanced healthcare infrastructure, aging population, and favorable regulatory pathways, with notable progress in the adoption of digital platforms for mental health and chronic disease management
- India is expected to be the fastest growing country in the Asia-Pacific digital therapeutic (DTx) market during the forecast period, owing to increasing smartphone penetration, improved internet connectivity, growing burden of chronic conditions, and rising focus on affordable digital healthcare solutions
- Group purchase organization segment dominated the Asia-Pacific digital therapeutic (DTx) market with a market share of 54.6% in 2024, driven by its ability to streamline procurement, reduce costs, and enable large-scale adoption through healthcare institutions and employer networks
Report Scope and Asia-Pacific Digital Therapeutic (DTx) Market Segmentation
|
Attributes |
Asia-Pacific Digital Therapeutic (DTx) Key Market Insights |
|
Segments Covered |
|
|
Countries Covered |
Asia-Pacific
|
|
Key Market Players |
|
|
Market Opportunities |
|
|
Value Added Data Infosets |
In addition to the insights on market scenarios such as market value, growth rate, segmentation, geographical coverage, and major players, the market reports curated by the Data Bridge Market Research also include in-depth expert analysis, pricing analysis, brand share analysis, consumer survey, demography analysis, supply chain analysis, value chain analysis, raw material/consumables overview, vendor selection criteria, PESTLE Analysis, Porter Analysis, and regulatory framework. |
Asia-Pacific Digital Therapeutic (DTx) Market Trends
“Personalized and AI-Driven Therapeutic Platforms”
- A significant and accelerating trend in the Asia-Pacific DTx market is the integration of artificial intelligence (AI) and personalized care algorithms to deliver tailored digital therapies that adapt to patient behaviors, clinical needs, and engagement levels. This innovation is significantly enhancing treatment adherence and patient outcomes across chronic and mental health conditions
- For instance, CureApp (Japan) offers AI-powered DTx for conditions such as nicotine addiction and hypertension, providing individualized feedback and therapeutic plans. Similarly, India-based JOGO Health utilizes AI-driven biofeedback for neurological disorders, enabling remote rehabilitation
- AI integration in DTx platforms allows continuous monitoring and real-time data analysis to dynamically adjust treatment protocols, issue predictive alerts, and enable proactive health interventions. This level of personalization fosters improved engagement and measurable clinical benefits
- In addition, integration with wearables and mobile apps facilitates seamless data flow and patient-provider connectivity. Multilingual and culturally adaptive interfaces are further boosting DTx adoption across diverse demographic segments in the region
- This trend toward intelligent, real-time, and patient-specific digital health interventions is rapidly transforming the region’s approach to chronic care, with companies innovating to meet rising demand for holistic and accessible digital therapies
Asia-Pacific Digital Therapeutic (DTx) Market Dynamics
Driver
“Rising Burden of Chronic Diseases and Digital Health Ecosystem Expansion”
- The growing prevalence of chronic conditions such as diabetes, hypertension, cardiovascular, and mental health disorders, alongside a rapidly expanding digital health ecosystem, is a key driver accelerating the adoption of digital therapeutics in Asia-Pacific
- For instance, in August 2024, Wellthy Therapeutics partnered with a leading Indian healthcare network to launch a DTx platform for chronic disease management, extending care access to remote and underserved populations. Such partnerships are reinforcing the utility of DTx in scalable and affordable healthcare delivery
- The widespread use of smartphones, expanding internet connectivity, and supportive government initiatives such as Japan’s Society 5.0 vision and India’s Ayushman Bharat Digital Mission are further enabling infrastructure for DTx deployment.
- As healthcare providers increasingly integrate digital tools into patient care, DTx platforms are becoming vital in supporting long-term disease management, improving access, and reducing overall care costs
Restraint/Challenge
“Data Privacy Concerns and Regulatory Uncertainty”
- Privacy concerns and regulatory inconsistencies remain a significant challenge hindering the broader adoption of DTx solutions in Asia-Pacific, particularly in emerging markets where data protection laws are still evolving
- For instance, varying levels of cybersecurity enforcement and data handling practices across countries raise concerns about unauthorized data access, especially for platforms collecting sensitive patient health information. These concerns can reduce user trust and hinder DTx adoption
- To address this, companies must ensure compliance with country-specific privacy laws such as Japan’s APPI and India’s DPDP Act, implement strong encryption, and maintain transparent data practices
- In addition, the absence of standardized DTx regulatory frameworks across many Asia-Pacific countries results in unclear pathways for clinical validation, product approval, and reimbursement. This regulatory uncertainty creates entry barriers for both local startups and global firms looking to scale
- Building a consistent, transparent, and patient-centric regulatory ecosystem—alongside public awareness campaigns and digital literacy initiatives—will be essential to overcoming these barriers and unlocking the full potential of DTx in the region
Asia-Pacific Digital Therapeutic (DTx) Market Scope
The market is segmented on the basis of product and service type, application, purchase mode, and sales channel.
- By Product and Service Type
On the basis of product and service type, the Asia-Pacific digital therapeutic (DTx) market is segmented into hardware products, solutions/software, and services. The solutions/software segment dominated the market with the largest revenue share of 61.3% in 2024, driven by its scalability, cost-efficiency, and ability to provide customized, interactive therapies across various chronic and behavioral health conditions. These software solutions are frequently integrated with smartphones, wearables, and cloud platforms, allowing for real-time patient engagement and progress tracking.
The hardware products segment is expected to witness the fastest growth rate of 19.4% from 2025 to 2032, fueled by the increasing integration of wearable biosensors and smart monitoring devices in therapeutic ecosystems. These tools enable continuous patient data collection and feedback, enhancing the precision and personalization of digital therapies across the region.
- By Application
On the basis of application, the Asia-Pacific digital therapeutic (DTx) market is segmented into treatment/care-related applications and preventive applications. The treatment/care-related applications segment dominated the market with a revenue share of 57.4% in 2024, primarily due to the growing demand for digital tools in managing chronic diseases such as diabetes, hypertension, and mental health disorders. These solutions help improve treatment adherence and support remote monitoring for better clinical outcomes.
The preventive applications segment is expected to grow at the fastest CAGR of 20.8% from 2025 to 2032, driven by rising awareness around preventive healthcare, increasing use of lifestyle modification programs, and the growing role of digital platforms in encouraging early intervention strategies for at-risk populations.
- By Unlocking Mechanism
On the basis of purchase mode, the Asia-Pacific digital therapeutic (DTx) market is segmented into group purchase organization (GPO) and individual. The group purchase organization segment dominated the market with the largest share of 54.6% in 2024, supported by healthcare institutions and employers procuring DTx solutions in bulk to reduce costs and expand access among patients and workforce populations. These models ensure wider implementation and reduce patient acquisition costs for DTx developers.
The individual segment is projected to grow at the fastest CAGR of 21.2% from 2025 to 2032, propelled by increasing consumer awareness, self-management of chronic diseases, and rising adoption of mobile-based health apps purchased directly via app stores or company websites.
- By Sales Channel
On the basis of sales channel, the Asia-Pacific digital therapeutic (DTx) market is segmented into B2B and B2C. The B2B segment led the market with a revenue share of 63.6% in 2024, owing to strategic collaborations between digital therapeutic providers and hospitals, payers, and corporations. These partnerships often include integration with existing care platforms and insurance models, enabling structured and large-scale deployment.
The B2C segment is anticipated to witness the fastest growth rate of 22.5% during 2025–2032, driven by increasing digital health literacy, rising internet and smartphone penetration, and the growing preference for self-guided digital health tools among younger, tech-savvy consumers across urban and semi-urban regions.
Asia-Pacific Digital Therapeutic (DTx) Market Regional Analysis
- Japan dominated the Asia-Pacific digital therapeutic (DTx) market with the largest revenue share of 37.3% in 2024, supported by its advanced healthcare infrastructure, aging population, and favorable regulatory pathways, with notable progress in the adoption of digital platforms for mental health and chronic disease management
- Consumers and healthcare providers in Japan highly value the clinical validation, personalization, and remote care features offered by DTx platforms, leading to widespread integration into the country’s healthcare system
- This strong market position is further supported by favorable regulatory frameworks, high digital literacy, and active collaborations between DTx developers and public health institutions, positioning Japan as a leader in driving digital transformation within the region’s therapeutic landscape
Asia-Pacific Digital Therapeutic (DTx) Market Insight
The Asia-Pacific digital therapeutic (DTx) market is projected to grow at the fastest CAGR of 23.2% during the forecast period of 2025 to 2032, driven by the increasing prevalence of chronic diseases, rising smartphone usage, and expanding digital health infrastructure. Government-led healthcare digitization initiatives and a surge in demand for remote care solutions are accelerating DTx adoption across countries such as India, Japan, China, and South Korea. In addition, growing interest in preventive care and personalized digital solutions is enhancing patient engagement and improving treatment outcomes throughout the region.
Japan Digital Therapeutic (DTx) Market Insight
The Japan digital therapeutic (DTx) market captured the largest revenue share in Asia-Pacific in 2024, attributed to the country’s advanced healthcare infrastructure, aging population, and supportive regulatory environment. Japan has emerged as a leader in adopting clinically validated DTx solutions for managing hypertension, diabetes, and mental health. The integration of DTx platforms with electronic health records and national health insurance systems is further promoting usage. Moreover, partnerships between hospitals, insurers, and DTx developers are expanding accessibility and scaling adoption in both urban and rural areas.
India Digital Therapeutic (DTx) Market Insight
The India digital therapeutic (DTx) market is expected to grow at the highest CAGR during the forecast period, fueled by rapid urbanization, increasing digital literacy, and the rising burden of non-communicable diseases. India’s large population base, expanding smartphone penetration, and the government’s push for digital health through programs such as Ayushman Bharat Digital Mission are key enablers of DTx growth. Local startups are actively developing cost-effective, multilingual platforms for diabetes, cardiovascular, and behavioral health management, increasing DTx adoption across both metro cities and tier 2–3 regions.
China Digital Therapeutic (DTx) Market Insight
The China digital therapeutic (DTx) market is witnessing strong growth momentum, supported by government policies encouraging digital health innovation and a tech-savvy population. DTx platforms are being increasingly integrated into telemedicine and chronic disease management programs. With a significant share of chronic disease patients, China is embracing AI-enabled DTx for personalized treatment and real-time monitoring. Collaborations between tech companies and healthcare providers are driving platform scalability, especially in diabetes and mental health treatment pathways.
South Korea Digital Therapeutic (DTx) Market Insight
The South Korea digital therapeutic (DTx) market is rapidly advancing, underpinned by its robust ICT infrastructure, high digital literacy, and regulatory efforts to accelerate DTx commercialization. The Ministry of Food and Drug Safety (MFDS) has taken proactive steps to develop a regulatory framework for software-based therapies, enabling faster product approvals. South Korean consumers’ strong engagement with health tech and mobile wellness applications is promoting demand for DTx, especially in areas such as sleep disorders, mental health, and metabolic conditions.
Asia-Pacific Digital Therapeutic (DTx) Market Share
The Asia-Pacific digital therapeutic (DTx) industry is primarily led by well-established companies, including:
- CureApp, Inc. (Japan)
- Wellthy Therapeutics Pvt. Ltd. (India)
- JOGOHEALTH (India)
- Samsung Electronics Co., Ltd. (South Korea)
- Tunstall Australasia Pty Ltd (Australia)
- Biofourmis, Inc. (Singapore)
- Health2Sync Inc. (Taiwan)
- M3, Inc. (Japan)
- Smartfuture Pte. Ltd. (Singapore)
- AinOne Inc. (South Korea)
- Neurowyzr Pte. Ltd. (Singapore)
- Biorithm Pte. Ltd. (Singapore)
- Ubie, Inc. (Japan)
- RoundGlass LLC (India)
- Olive Union Inc. (Japan)
- Onsurity Technologies Pvt. Ltd. (India)
- Zoi Health Co., Ltd. (South Korea)
- MediHub Co., Ltd. (South Korea)
- CareVoice Digital Health Co. Ltd. (China)
What are the Recent Developments in Asia-Pacific Digital Therapeutic (DTx) Market?
- In May 2024, CureApp, Inc. (Japan), a pioneer in digital therapeutics, launched CureApp SC, an innovative smoking cessation DTx platform, in collaboration with the Japanese Ministry of Health. This clinically approved app-based therapy integrates behavioral guidance with AI-driven insights, enhancing patient outcomes through real-time feedback and personalized support. The launch reinforces Japan’s leadership in regulatory acceptance and clinical deployment of DTx solutions
- In March 2024, Wellthy Therapeutics (India) partnered with a major healthcare provider to deploy its chronic disease management platform across multiple cities in India. The multilingual, AI-powered DTx platform targets diabetes and cardiovascular diseases, enabling personalized care plans and remote monitoring. This strategic move expands digital health access to tier 2 and tier 3 regions, demonstrating the scalability of localized DTx solutions
- In February 2024, JOGO Health (India) introduced its neuroplasticity-based digital therapeutic in South Korea, aimed at treating stroke and incontinence through wearable biofeedback devices. The expansion into a new market highlight growing cross-border interest in non-invasive, software-driven therapies and showcases India’s innovation footprint in the global DTx landscape
- In January 2024, Samsung Medical Center (South Korea) launched a pilot project integrating digital therapeutics for sleep disorders and cognitive behavioral therapy (CBT) using a hospital-linked app platform. The project is part of a broader initiative to embed DTx into traditional care delivery, with real-time monitoring and clinical oversight, further advancing hybrid digital-health models in the country
- In December 2023, Tunstall Healthcare (Australia) collaborated with local public health authorities to implement a digital health intervention program for elderly patients with chronic conditions. The program combines wearable devices and DTx software to remotely track patient progress, prevent hospital readmissions, and promote independent living. This initiative reflects Australia's growing commitment to digital aging solutions and value-based care models
SKU-

- Interactive Data Analysis Dashboard
- Company Analysis Dashboard for high growth potential opportunities
- Research Analyst Access for customization & queries
- Competitor Analysis with Interactive dashboard
- Latest News, Updates & Trend analysis
- Harness the Power of Benchmark Analysis for Comprehensive Competitor Tracking
Table of Content
1 INTRODUCTION
1.1 OBJECTIVES OF THE STUDY
1.2 MARKET DEFINITION
1.3 OVERVIEW OF ASIA-PACIFIC DIGITAL THERAPEUTIC (DTX) MARKET
1.4 LIMITATIONS
1.5 MARKETS COVERED
2 MARKET SEGMENTATION
2.1 MARKETS COVERED
2.2 GEOGRAPHICAL SCOPE
2.3 YEARS CONSIDERED FOR THE STUDY
2.4 CURRENCY AND PRICING
2.5 DBMR TRIPOD DATA VALIDATION MODEL
2.6 MULTIVARIATE MODELLING
2.7 PRODUCT AND SERVICE TYPE LIFELINE CURVE
2.8 PRIMARY INTERVIEWS WITH KEY OPINION LEADERS
2.9 DBMR MARKET POSITION GRID
2.1 MARKET APPLICATION COVERAGE GRID
2.11 VENDOR SHARE ANALYSIS
2.12 SECONDARY SOURCES
2.13 ASSUMPTIONS
3 EXECUTIVE SUMMARY
4 ASIA-PACIFIC DIGITAL THERAPEUTICS (DTX) MARKET: REGULATIONS
5 MARKET OVERVIEW
5.1 DRIVERS
5.1.1 RISE IN PREVALENCE OF CHRONIC DISEASES
5.1.2 INCREASE IN AWARENESS BY GOVERNMENT AGENCIES
5.1.3 TECHNOLOGICAL ADVANCEMENT IN HEALTHCARE
5.1.4 INCREASED NUMBER OF PEOPLE USING SMARTPHONES
5.1.5 IMPROVED QUALITY OF LIFE
5.2 RESTRAINTS
5.2.1 PATIENT INFORMATION PRIVACY POLICIES
5.2.2 DIGITAL PAYMENT ASSOCIATED WITH DIGITAL THERAPEUTICS
5.2.3 UNDER DEVELOPING COUNTIRES LACKING SMARTPHONES AND INTERNET FACILITIES
5.3 OPPORTUNITIES
5.3.1 RISING DEMAND OF DIGITAL THERAPEUTICS
5.3.2 COLLABORATION BETWEEN COMPANIES TO PROVIDE BETTER PRODUCTS/SERVICES
5.3.3 PARTNERSHIP BETWEEN COMPANIES
5.3.4 EXPANSION AND LAUNCH OF PRODUCTS
5.3.5 EVENTS AND EXHIBITION
5.3.6 PHYSICIAN ADOPTION
5.4 CHALLENGES
5.4.1 CLINICAL VALIDATION
5.4.2 REGULATORY APPROVAL
5.4.3 PAYER REIMBURSEMENT
6 IMPACT OF COVID-19 ON ASIA-PACIFIC DIGITAL THERAPEUTIC (DTX) MARKET
6.1 IMPACT ON DEMAND
6.2 IMPACT ON SUPPLY
6.3 KEY INITIATIVES TAKEN BY PLAYERS DURING COVID-19
6.4 CONCLUSION
7 ASIA-PACIFIC DIGITAL THERAPEUTIC (DTX) MARKET, BY PRODUCT AND SERVICE TYPE
7.1 OVERVIEW
7.2 SOLUTION/SOFTWARE
7.3 HARDWARE PRODUCTS
7.4 SERVICE
8 ASIA-PACIFIC DIGITAL THERAPEUTIC (DTX) MARKET, BY APPLICATION
8.1 OVERVIEW
8.2 TREATMENT/CARE-RELATED APPLIACTIONS
8.2.1 DIABETES
8.2.2 CENTRAL NERVOUS SYSTEM DISORDERS
8.2.3 SMOKING CESSATION
8.2.4 CHRONIC RESPIRATORY DISEASES
8.2.5 MUSCULOSKELETAL DISORDER
8.2.6 CARDIOVASCULAR DISEASES
8.2.7 MEDICATION ADHERENCE
8.2.8 GASTROINTESTINAL DISORDERS
8.2.9 REHABILITATION AND PATIENT CARE
8.2.10 SUBSTANCE USE DISORDER AND ADDICTION MANAGEMENT
8.2.11 OTHER TREATMENT/ CARE RELATED APPLICATIONS
8.3 PREVENTIVE APPLICATIONS
8.3.1 PREDIABETES
8.3.2 OBESITY
8.3.3 NUTRITION
8.3.4 LIFESTYLE MANAGEMENT
8.3.5 OTHER PREVENTIVE APPLICATIONS
9 ASIA-PACIFIC DIGITAL THERAPEUTIC (DTX) MARKET, BY PURCHASE MODE
9.1 OVERVIEW
9.2 GROUP PURCHASE ORGANIZATION
9.2.1 SOLUTIONS/ SOFTWARE
9.2.2 HARDWARE PRODUCT
9.2.3 SERVICE
9.3 INDIVIDUAL
9.3.1 SOLUTIONS/ SOFTWARE
9.3.2 HARDWARE PRODUCT
9.3.3 SERVICE
10 ASIA-PACIFIC DIGITAL THERAPEUTIC (DTX) MARKET, BY SALES CHANNEL
10.1 OVERVIEW
10.2 B2B
10.2.1 PAYERS
10.2.2 EMPLOYERS
10.2.3 PHARMA COMPANIES
10.2.4 PROVIDERS
10.2.5 OTHER BUYERS
10.3 B2C
10.3.1 CAREGIVERS
10.3.2 PATIENTS
11 ASIA-PACIFIC DIGITAL THERAPEUTIC (DTX) MARKET, BY GEOGRAPHY
11.1 ASIA-PACIFIC DIGITAL THERAPEUTIC (DTX) MARKET, BY COUNTRY
11.1.1 JAPAN
11.1.2 CHINA
11.1.3 AUSTRALIA
11.1.4 SOUTH KOREA
11.1.5 INDIA
11.1.6 SINGAPORE
11.1.7 THAILAND
11.1.8 MALAYSIA
11.1.9 INDONESIA
11.1.10 PHILIPPINES
11.1.11 REST OF ASIA-PACIFIC
12 ASIA-PACIFIC DIGITAL THERAPEUTIC (DTX) MARKET: COMPANY LANDSCAPE
12.1 COMPANY SHARE ANALYSIS: ASIA-PACIFIC
13 SWOT
14 COMPANY PROFILE
14.1 FITBIT,INC.
14.1.1 COMPANY SNAPSHOT
14.1.2 REVENUE ANALYSIS
14.1.3 COMPANY SHARE ANALYSIS
14.1.4 PRODUCT PORTFOLIO
14.1.5 RECENT DEVELOPMENTS
14.2 LIVONGO
14.2.1 COMPANY SNAPSHOT
14.2.2 REVENUE ANALYSIS
14.2.3 COMPANY SHARE ANALYSIS
14.2.4 PRODUCT PORTFOLIO
14.2.5 RECENT DEVELOPMENTS
14.3 RESMED
14.3.1 COMPANY SNAPSHOT
14.3.2 REVENUE ANALYSIS
14.3.3 COMPANY SHARE ANALYSIS
14.3.4 PRODUCT PORTFOLIO
14.3.5 RECENT DEVELOPMENTS
14.4 OMADA HEALTH, INC.
14.4.1 COMPANY SNAPSHOT
14.4.2 COMPANY SHARE ANALYSIS
14.4.3 PRODUCT PORTFOLIO
14.4.4 RECENT DEVELOPMENTS
14.5 GINGER
14.5.1 COMPANY SNAPSHOT
14.5.2 PRODUCT PORTFOLIO
14.5.3 RECENT DEVELOPMENT
14.6 SAMSUNG
14.6.1 COMPANY SNAPSHOT
14.6.2 REVENUE ANALYSIS
14.6.3 PRODUCT PORTFOLIO
14.6.4 RECENT DEVELOPMENT
14.7 MINDSTRONG HEALTH
14.7.1 COMPANY SNAPSHOT
14.7.2 SERVICE PORTFOLIO
14.7.3 RECENT DEVELOPMENTS
14.8 2MORROW INC.
14.8.1 COMPANY SNAPSHOT
14.8.2 PRODUCT PORTFOLIO
14.8.3 RECENT DEVELOPMENTS
14.9 AKILI INTERACTIVE LABS, INC.
14.9.1 COMPANY SNAPSHOT
14.9.2 PRODUCT PORTFOLIO
14.9.3 RECENT DEVELOPMENTS
14.1 ATENTIV
14.10.1 COMPANY SNAPSHOT
14.10.2 PRODUCT PORTFOLIO
14.10.3 RECENT DEVELOPMENTS
14.11 AYOGO HEALTH INC.
14.11.1 COMPANY SNAPSHOT
14.11.2 PRODUCT PORTFOLIO
14.11.3 RECENT DEVELOPMENTS
14.12 BETTER THERAPEUTICS, INC
14.12.1 COMPANY SNAPSHOT
14.12.2 PRODUCT PORTFOLIO
14.12.3 RECENT DEVELOPMENTS
14.13 CANARY HEALTH
14.13.1 COMPANY SNAPSHOT
14.13.2 SOLUTION PORTFOLIO
14.13.3 RECENT DEVELOPMENT
14.14 CLICK THERAPEUTICS, INC.
14.14.1 COMPANY SNAPSHOT
14.14.2 PRODUCT PORTFOLIO
14.14.3 RECENT DEVELOPMENTS
14.15 COGNIFIT
14.15.1 COMPANY SNAPSHOT
14.15.2 PRODUCT PORTFOLIO
14.15.3 RECENT DEVELOPMENTS
14.16 COGNOA
14.16.1 COMPANY SNAPSHOT
14.16.2 PRODUCT PORTFOLIO
14.16.3 RECENT DEVELOPMENTS
14.17 GAIA AG
14.17.1 COMPANY SNAPSHOT
14.17.2 PRODUCT PORTFOLIO
14.17.3 RECENT DEVELOPMENTS
14.18 HAPPIFY, INC.
14.18.1 COMPANY SNAPSHOT
14.18.2 PRODUCT PORTFOLIO
14.18.3 RECENT DEVELOPMENTS
14.19 KAIA HEALTH
14.19.1 COMPANY SNAPSHOT
14.19.2 PRODUCT PORTFOLIO
14.19.3 RECENT DEVELOPMENTS
14.2 MANGO HEALTH
14.20.1 COMPANY SNAPSHOT
14.20.2 PRODUCT PORTFOLIO
14.20.3 RECENT DEVELOPMENTS
14.21 NATURAL CYCLES USA CORP
14.21.1 COMPANY SNAPSHOT
14.21.2 PRODUCT PORTFOLIO
14.21.3 RECENT DEVELOPMENT
14.22 NOOM, INC.
14.22.1 COMPANY SNAPSHOT
14.22.2 PRODUCT PORTFOLIO
14.22.3 RECENT DEVELOPMENT
14.23 PEAR THERAPEUTICS, INC.
14.23.1 COMPANY SNAPSHOT
14.23.2 PRODUCT PORTFOLIO
14.23.3 RECENT DEVELOPMENTS
14.24 SMARTPATIENT GMBH
14.24.1 COMPANY SNAPSHOT
14.24.2 PRODUCT PORTFOLIO
14.24.3 RECENT DEVELOPMENT
14.25 VOLUNTIS
14.25.1 COMPANY SNAPSHOT
14.25.2 REVENUE ANALYSIS
14.25.3 PRODUCT PORTFOLIO
14.25.4 RECENT DEVELOPMENTS
14.26 WELLDOC, INC.
14.26.1 COMPANY SNAPSHOT
14.26.2 PRODUCT PORTFOLIO
14.26.3 RECENT DEVELOPMENTS
14.27 WELLTHY THERAPEUTICS PVT LTD
14.27.1 COMPANY SNAPSHOT
14.27.2 PRODUCT PORTFOLIO
14.27.3 RECENT DEVELOPMENTS
15 QUESTIONNAIRE
16 RELATED REPORTS
List of Table
LIST OF TABLES
TABLE 1 REGULATORY FRAMEWORK
TABLE 2 ASIA-PACIFIC DIGITAL THERAPEUTIC (DTX) MARKET, BY PRODUCT AND SERVICE TYPE, 2020-2028 (USD MILLION)
TABLE 3 ASIA-PACIFIC SOLUTIONS/SOFTWARE IN DIGITAL THERAPEUTIC (DTX) MARKET, BY REGION, 2019-2028 (USD MILLION))
TABLE 4 ASIA-PACIFIC HARDWARE PRODUCTS IN DIGITAL THERAPEUTIC (DTX) MARKET, BY REGION, 2019-2028 (USD MILLION)
TABLE 5 ASIA-PACIFIC SERVICE IN DIGITAL THERAPEUTIC (DTX) MARKET, BY REGION, 2019-2028 (USD MILLION)
TABLE 6 ASIA-PACIFIC DIGITAL THERAPEUTIC (DTX) MARKET, BY APPLICATION, 2020-2028 (USD MILLION)
TABLE 7 ASIA-PACIFIC TREATMENT/CARE-RELATED APPLICATIONS IN DIGITAL THERAPEUTIC (DTX) MARKET, BY REGION, 2019-2028 (USD MILLION)
TABLE 8 ASIA-PACIFIC TREATMENT/CARE-RELATED APPLICATIONS IN DIGITAL THERAPEUTIC (DTX) MARKET, BY APPLICATION, 2019-2028 (USD MILLION)
TABLE 9 ASIA-PACIFIC PREVENTIVE APPLICATIONS IN DIGITAL THERAPEUTIC (DTX) MARKET, BY REGION, 2019-2028 (USD MILLION)
TABLE 10 ASIA-PACIFIC PREVENTIVE APPLICATIONS IN DIGITAL THERAPEUTIC (DTX) MARKET, BY APPLICATION, 2019-2028 (USD MILLION)
TABLE 11 ASIA-PACIFIC DIGITAL THERAPEUTIC (DTX) MARKET, BY PURCHASE MODE, 2020-2028 (USD MILLION)
TABLE 12 ASIA-PACIFIC GROUP PURCHASE ORGANIZATION IN DIGITAL THERAPEUTIC (DTX) MARKET, BY REGION, 2019-2028 (USD MILLION)
TABLE 13 ASIA-PACIFIC GROUP PURCHASE ORGANIZATION IN DIGITAL THERAPEUTIC (DTX) MARKET, BY PURCHASE MODE, 2019-2028 (USD MILLION)
TABLE 14 ASIA-PACIFIC INDIVIDUAL IN DIGITAL THERAPEUTIC (DTX) MARKET, BY REGION, 2019-2028 (USD MILLION)
TABLE 15 ASIA-PACIFIC INDIVIDUAL IN DIGITAL THERAPEUTIC (DTX) MARKET, BY PURCHASE MODE, 2019-2028 (USD MILLION)
TABLE 16 ASIA-PACIFIC DIGITAL THERAPEUTIC (DTX) MARKET, BY SALES CHANNEL, 2020-2028 (USD MILLION)
TABLE 17 ASIA-PACIFIC B2B IN DIGITAL THERAPEUTIC (DTX) MARKET, BY REGION, 2019-2028 (USD MILLION)
TABLE 18 ASIA-PACIFIC B2B IN DIGITAL THERAPEUTIC (DTX) MARKET, BY SALES CHANNEL, 2019-2028 (USD MILLION)
TABLE 19 ASIA-PACIFIC B2C IN DIGITAL THERAPEUTIC (DTX) MARKET, BY REGION, 2019-2028 (USD MILLION)
TABLE 20 ASIA-PACIFIC B2C IN DIGITAL THERAPEUTIC (DTX) MARKET, BY SALES CHANNEL, 2019-2028 (USD MILLION)
TABLE 21 ASIA-PACIFIC DIGITAL THERAPEUTIC (DTX) MARKET, BY COUNTRY, 2019-2028 (USD MILLION)
TABLE 22 ASIA-PACIFIC DIGITAL THERAPEUTIC (DTX) MARKET, BY PRODUCT AND SERVICE TYPE, 2019-2028 (USD MILLION)
TABLE 23 ASIA-PACIFIC DIGITAL THERAPEUTIC (DTX) MARKET, BY APPLICATION, 2019-2028 (USD MILLION)
TABLE 24 ASIA-PACIFIC TREATMENT/CARE-RELATED APPLICATIONS IN DIGITAL THERAPEUTIC (DTX) MARKET, BY APPLICATION, 2019-2028 (USD MILLION)
TABLE 25 ASIA-PACIFIC PREVENTIVE APPLICATIONS IN DIGITAL THERAPEUTIC (DTX) MARKET, BY APPLICATION, 2019-2028 (USD MILLION)
TABLE 26 ASIA-PACIFIC DIGITAL THERAPEUTIC (DTX) MARKET, BY PURCHASE MODE, 2019-2028 (USD MILLION)
TABLE 27 ASIA-PACIFIC GROUP PURCHASE ORGANIZATION IN DIGITAL THERAPEUTIC (DTX) MARKET, BY PURCHASE MODE, 2019-2028 (USD MILLION)
TABLE 28 ASIA-PACIFIC INDIVIDUAL IN DIGITAL THERAPEUTIC (DTX) MARKET, BY PURCHASE MODE, 2019-2028 (USD MILLION)
TABLE 29 ASIA-PACIFIC DIGITAL THERAPEUTIC (DTX) MARKET, BY SALES CHANNEL, 2019-2028 (USD MILLION)
TABLE 30 ASIA-PACIFIC B2B IN DIGITAL THERAPEUTIC (DTX) MARKET, BY SALES CHANNEL, 2019-2028 (USD MILLION)
TABLE 31 ASIA-PACIFIC B2C IN DIGITAL THERAPEUTIC (DTX) MARKET, BY SALES CHANNEL, 2019-2028 (USD MILLION)
TABLE 32 JAPAN DIGITAL THERAPEUTIC (DTX) MARKET, BY PRODUCT AND SERVICE TYPE, 2019-2028 (USD MILLION)
TABLE 33 JAPAN DIGITAL THERAPEUTIC (DTX) MARKET, BY APPLICATION, 2019-2028 (USD MILLION)
TABLE 34 JAPAN TREATMENT/CARE-RELATED APPLICATIONS IN DIGITAL THERAPEUTIC (DTX) MARKET, BY APPLICATION, 2019-2028 (USD MILLION)
TABLE 35 JAPAN PREVENTIVE APPLICATIONS IN DIGITAL THERAPEUTIC (DTX) MARKET, BY APPLICATION, 2019-2028 (USD MILLION)
TABLE 36 JAPAN DIGITAL THERAPEUTIC (DTX) MARKET, BY PURCHASE MODE, 2019-2028 (USD MILLION)
TABLE 37 JAPAN GROUP PURCHASE ORGANIZATION IN DIGITAL THERAPEUTIC (DTX) MARKET, BY PURCHASE MODE, 2019-2028 (USD MILLION)
TABLE 38 JAPAN INDIVIDUAL IN DIGITAL THERAPEUTIC (DTX) MARKET, BY PURCHASE MODE, 2019-2028 (USD MILLION)
TABLE 39 JAPAN DIGITAL THERAPEUTIC (DTX) MARKET, BY SALES CHANNEL, 2019-2028 (USD MILLION)
TABLE 40 JAPAN B2B IN DIGITAL THERAPEUTIC (DTX) MARKET, BY SALES CHANNEL, 2019-2028 (USD MILLION)
TABLE 41 JAPAN B2C IN DIGITAL THERAPEUTIC (DTX) MARKET, BY SALES CHANNEL, 2019-2028 (USD MILLION)
TABLE 42 CHINA DIGITAL THERAPEUTIC (DTX) MARKET, BY PRODUCT AND SERVICE TYPE, 2019-2028 (USD MILLION)
TABLE 43 CHINA DIGITAL THERAPEUTIC (DTX) MARKET, BY APPLICATION, 2019-2028 (USD MILLION)
TABLE 44 CHINA TREATMENT/CARE-RELATED APPLICATIONS IN DIGITAL THERAPEUTIC (DTX) MARKET, BY APPLICATION, 2019-2028 (USD MILLION)
TABLE 45 CHINA PREVENTIVE APPLICATIONS IN DIGITAL THERAPEUTIC (DTX) MARKET, BY APPLICATION, 2019-2028 (USD MILLION)
TABLE 46 CHINA DIGITAL THERAPEUTIC (DTX) MARKET, BY PURCHASE MODE, 2019-2028 (USD MILLION)
TABLE 47 CHINA GROUP PURCHASE ORGANIZATION IN DIGITAL THERAPEUTIC (DTX) MARKET, BY PURCHASE MODE, 2019-2028 (USD MILLION)
TABLE 48 CHINA INDIVIDUAL IN DIGITAL THERAPEUTIC (DTX) MARKET, BY PURCHASE MODE, 2019-2028 (USD MILLION)
TABLE 49 CHINA DIGITAL THERAPEUTIC (DTX) MARKET, BY SALES CHANNEL, 2019-2028 (USD MILLION)
TABLE 50 CHINA B2B IN DIGITAL THERAPEUTIC (DTX) MARKET, BY SALES CHANNEL, 2019-2028 (USD MILLION)
TABLE 51 CHINA B2C IN DIGITAL THERAPEUTIC (DTX) MARKET, BY SALES CHANNEL, 2019-2028 (USD MILLION)
TABLE 52 AUSTRALIA DIGITAL THERAPEUTIC (DTX) MARKET, BY PRODUCT AND SERVICE TYPE, 2019-2028 (USD MILLION)
TABLE 53 AUSTRALIA DIGITAL THERAPEUTIC (DTX) MARKET, BY APPLICATION, 2019-2028 (USD MILLION)
TABLE 54 AUSTRALIA TREATMENT/CARE-RELATED APPLICATIONS IN DIGITAL THERAPEUTIC (DTX) MARKET, BY APPLICATION, 2019-2028 (USD MILLION)
TABLE 55 AUSTRALIA PREVENTIVE APPLICATIONS IN DIGITAL THERAPEUTIC (DTX) MARKET, BY APPLICATION, 2019-2028 (USD MILLION)
TABLE 56 AUSTRALIA DIGITAL THERAPEUTIC (DTX) MARKET, BY PURCHASE MODE, 2019-2028 (USD MILLION)
TABLE 57 AUSTRALIA GROUP PURCHASE ORGANIZATION IN DIGITAL THERAPEUTIC (DTX) MARKET, BY PURCHASE MODE, 2019-2028 (USD MILLION)
TABLE 58 AUSTRALIA INDIVIDUAL IN DIGITAL THERAPEUTIC (DTX) MARKET, BY PURCHASE MODE, 2019-2028 (USD MILLION)
TABLE 59 AUSTRALIA DIGITAL THERAPEUTIC (DTX) MARKET, BY SALES CHANNEL, 2019-2028 (USD MILLION)
TABLE 60 AUSTRALIA B2B IN DIGITAL THERAPEUTIC (DTX) MARKET, BY SALES CHANNEL, 2019-2028 (USD MILLION)
TABLE 61 AUSTRALIA B2C IN DIGITAL THERAPEUTIC (DTX) MARKET, BY SALES CHANNEL, 2019-2028 (USD MILLION)
TABLE 62 SOUTH KOREA DIGITAL THERAPEUTIC (DTX) MARKET, BY PRODUCT AND SERVICE TYPE, 2019-2028 (USD MILLION)
TABLE 63 SOUTH KOREA DIGITAL THERAPEUTIC (DTX) MARKET, BY APPLICATION, 2019-2028 (USD MILLION)
TABLE 64 SOUTH KOREA TREATMENT/CARE-RELATED APPLICATIONS IN DIGITAL THERAPEUTIC (DTX) MARKET, BY APPLICATION, 2019-2028 (USD MILLION)
TABLE 65 SOUTH KOREA PREVENTIVE APPLICATIONS IN DIGITAL THERAPEUTIC (DTX) MARKET, BY APPLICATION, 2019-2028 (USD MILLION)
TABLE 66 SOUTH KOREA DIGITAL THERAPEUTIC (DTX) MARKET, BY PURCHASE MODE, 2019-2028 (USD MILLION)
TABLE 67 SOUTH KOREA GROUP PURCHASE ORGANIZATION IN DIGITAL THERAPEUTIC (DTX) MARKET, BY PURCHASE MODE, 2019-2028 (USD MILLION)
TABLE 68 SOUTH KOREA INDIVIDUAL IN DIGITAL THERAPEUTIC (DTX) MARKET, BY PURCHASE MODE, 2019-2028 (USD MILLION)
TABLE 69 SOUTH KOREA DIGITAL THERAPEUTIC (DTX) MARKET, BY SALES CHANNEL, 2019-2028 (USD MILLION)
TABLE 70 SOUTH KOREA B2B IN DIGITAL THERAPEUTIC (DTX) MARKET, BY SALES CHANNEL, 2019-2028 (USD MILLION)
TABLE 71 SOUTH KOREA B2C IN DIGITAL THERAPEUTIC (DTX) MARKET, BY SALES CHANNEL, 2019-2028 (USD MILLION)
TABLE 72 INDIA DIGITAL THERAPEUTIC (DTX) MARKET, BY PRODUCT AND SERVICE TYPE, 2019-2028 (USD MILLION)
TABLE 73 INDIA DIGITAL THERAPEUTIC (DTX) MARKET, BY APPLICATION, 2019-2028 (USD MILLION)
TABLE 74 INDIA TREATMENT/CARE-RELATED APPLICATIONS IN DIGITAL THERAPEUTIC (DTX) MARKET, BY APPLICATION, 2019-2028 (USD MILLION)
TABLE 75 INDIA PREVENTIVE APPLICATIONS IN DIGITAL THERAPEUTIC (DTX) MARKET, BY APPLICATION, 2019-2028 (USD MILLION)
TABLE 76 INDIA DIGITAL THERAPEUTIC (DTX) MARKET, BY PURCHASE MODE, 2019-2028 (USD MILLION)
TABLE 77 INDIA GROUP PURCHASE ORGANIZATION IN DIGITAL THERAPEUTIC (DTX) MARKET, BY PURCHASE MODE, 2019-2028 (USD MILLION)
TABLE 78 INDIA INDIVIDUAL IN DIGITAL THERAPEUTIC (DTX) MARKET, BY PURCHASE MODE, 2019-2028 (USD MILLION)
TABLE 79 INDIA DIGITAL THERAPEUTIC (DTX) MARKET, BY SALES CHANNEL, 2019-2028 (USD MILLION)
TABLE 80 INDIA B2B IN DIGITAL THERAPEUTIC (DTX) MARKET, BY SALES CHANNEL, 2019-2028 (USD MILLION)
TABLE 81 INDIA B2C IN DIGITAL THERAPEUTIC (DTX) MARKET, BY SALES CHANNEL, 2019-2028 (USD MILLION)
TABLE 82 SINGAPORE DIGITAL THERAPEUTIC (DTX) MARKET, BY PRODUCT AND SERVICE TYPE, 2019-2028 (USD MILLION)
TABLE 83 SINGAPORE DIGITAL THERAPEUTIC (DTX) MARKET, BY APPLICATION, 2019-2028 (USD MILLION)
TABLE 84 SINGAPORE TREATMENT/CARE-RELATED APPLICATIONS IN DIGITAL THERAPEUTIC (DTX) MARKET, BY APPLICATION, 2019-2028 (USD MILLION)
TABLE 85 SINGAPORE PREVENTIVE APPLICATIONS IN DIGITAL THERAPEUTIC (DTX) MARKET, BY APPLICATION, 2019-2028 (USD MILLION)
TABLE 86 SINGAPORE DIGITAL THERAPEUTIC (DTX) MARKET, BY PURCHASE MODE, 2019-2028 (USD MILLION)
TABLE 87 SINGAPORE GROUP PURCHASE ORGANIZATION IN DIGITAL THERAPEUTIC (DTX) MARKET, BY PURCHASE MODE, 2019-2028 (USD MILLION)
TABLE 88 SINGAPORE INDIVIDUAL IN DIGITAL THERAPEUTIC (DTX) MARKET, BY PURCHASE MODE, 2019-2028 (USD MILLION)
TABLE 89 SINGAPORE DIGITAL THERAPEUTIC (DTX) MARKET, BY SALES CHANNEL, 2019-2028 (USD MILLION)
TABLE 90 SINGAPORE B2B IN DIGITAL THERAPEUTIC (DTX) MARKET, BY SALES CHANNEL, 2019-2028 (USD MILLION)
TABLE 91 SINGAPORE B2C IN DIGITAL THERAPEUTIC (DTX) MARKET, BY SALES CHANNEL, 2019-2028 (USD MILLION)
TABLE 92 THAILAND DIGITAL THERAPEUTIC (DTX) MARKET, BY PRODUCT AND SERVICE TYPE, 2019-2028 (USD MILLION)
TABLE 93 THAILAND DIGITAL THERAPEUTIC (DTX) MARKET, BY APPLICATION, 2019-2028 (USD MILLION)
TABLE 94 THAILAND TREATMENT/CARE-RELATED APPLICATIONS IN DIGITAL THERAPEUTIC (DTX) MARKET, BY APPLICATION, 2019-2028 (USD MILLION)
TABLE 95 THAILAND PREVENTIVE APPLICATIONS IN DIGITAL THERAPEUTIC (DTX) MARKET, BY APPLICATION, 2019-2028 (USD MILLION)
TABLE 96 THAILAND DIGITAL THERAPEUTIC (DTX) MARKET, BY PURCHASE MODE, 2019-2028 (USD MILLION)
TABLE 97 THAILAND GROUP PURCHASE ORGANIZATION IN DIGITAL THERAPEUTIC (DTX) MARKET, BY PURCHASE MODE, 2019-2028 (USD MILLION)
TABLE 98 THAILAND INDIVIDUAL IN DIGITAL THERAPEUTIC (DTX) MARKET, BY PURCHASE MODE, 2019-2028 (USD MILLION)
TABLE 99 THAILAND DIGITAL THERAPEUTIC (DTX) MARKET, BY SALES CHANNEL, 2019-2028 (USD MILLION)
TABLE 100 THAILAND B2B IN DIGITAL THERAPEUTIC (DTX) MARKET, BY SALES CHANNEL, 2019-2028 (USD MILLION)
TABLE 101 THAILAND B2C IN DIGITAL THERAPEUTIC (DTX) MARKET, BY SALES CHANNEL, 2019-2028 (USD MILLION)
TABLE 102 MALAYSIA DIGITAL THERAPEUTIC (DTX) MARKET, BY PRODUCT AND SERVICE TYPE, 2019-2028 (USD MILLION)
TABLE 103 MALAYSIA DIGITAL THERAPEUTIC (DTX) MARKET, BY APPLICATION, 2019-2028 (USD MILLION)
TABLE 104 MALAYSIA TREATMENT/CARE-RELATED APPLICATIONS IN DIGITAL THERAPEUTIC (DTX) MARKET, BY APPLICATION, 2019-2028 (USD MILLION)
TABLE 105 MALAYSIA PREVENTIVE APPLICATIONS IN DIGITAL THERAPEUTIC (DTX) MARKET, BY APPLICATION, 2019-2028 (USD MILLION)
TABLE 106 MALAYSIA DIGITAL THERAPEUTIC (DTX) MARKET, BY PURCHASE MODE, 2019-2028 (USD MILLION)
TABLE 107 MALAYSIA GROUP PURCHASE ORGANIZATION IN DIGITAL THERAPEUTIC (DTX) MARKET, BY PURCHASE MODE, 2019-2028 (USD MILLION)
TABLE 108 MALAYSIA INDIVIDUAL IN DIGITAL THERAPEUTIC (DTX) MARKET, BY PURCHASE MODE, 2019-2028 (USD MILLION)
TABLE 109 MALAYSIA DIGITAL THERAPEUTIC (DTX) MARKET, BY SALES CHANNEL, 2019-2028 (USD MILLION)
TABLE 110 MALAYSIA B2B IN DIGITAL THERAPEUTIC (DTX) MARKET, BY SALES CHANNEL, 2019-2028 (USD MILLION)
TABLE 111 MALAYSIA B2C IN DIGITAL THERAPEUTIC (DTX) MARKET, BY SALES CHANNEL, 2019-2028 (USD MILLION)
TABLE 112 INDONESIA DIGITAL THERAPEUTIC (DTX) MARKET, BY PRODUCT AND SERVICE TYPE, 2019-2028 (USD MILLION)
TABLE 113 INDONESIA DIGITAL THERAPEUTIC (DTX) MARKET, BY APPLICATION, 2019-2028 (USD MILLION)
TABLE 114 INDONESIA TREATMENT/CARE-RELATED APPLICATIONS IN DIGITAL THERAPEUTIC (DTX) MARKET, BY APPLICATION, 2019-2028 (USD MILLION)
TABLE 115 INDONESIA PREVENTIVE APPLICATIONS IN DIGITAL THERAPEUTIC (DTX) MARKET, BY APPLICATION, 2019-2028 (USD MILLION)
TABLE 116 INDONESIA DIGITAL THERAPEUTIC (DTX) MARKET, BY PURCHASE MODE, 2019-2028 (USD MILLION)
TABLE 117 INDONESIA GROUP PURCHASE ORGANIZATION IN DIGITAL THERAPEUTIC (DTX) MARKET, BY PURCHASE MODE, 2019-2028 (USD MILLION)
TABLE 118 INDONESIA INDIVIDUAL IN DIGITAL THERAPEUTIC (DTX) MARKET, BY PURCHASE MODE, 2019-2028 (USD MILLION)
TABLE 119 INDONESIA DIGITAL THERAPEUTIC (DTX) MARKET, BY SALES CHANNEL, 2019-2028 (USD MILLION)
TABLE 120 INDONESIA B2B IN DIGITAL THERAPEUTIC (DTX) MARKET, BY SALES CHANNEL, 2019-2028 (USD MILLION)
TABLE 121 INDONESIA B2C IN DIGITAL THERAPEUTIC (DTX) MARKET, BY SALES CHANNEL, 2019-2028 (USD MILLION)
TABLE 122 PHILIPPINES DIGITAL THERAPEUTIC (DTX) MARKET, BY PRODUCT AND SERVICE TYPE, 2019-2028 (USD MILLION)
TABLE 123 PHILIPPINES DIGITAL THERAPEUTIC (DTX) MARKET, BY APPLICATION, 2019-2028 (USD MILLION)
TABLE 124 PHILIPPINES TREATMENT/CARE-RELATED APPLICATIONS IN DIGITAL THERAPEUTIC (DTX) MARKET, BY APPLICATION, 2019-2028 (USD MILLION)
TABLE 125 PHILIPPINES PREVENTIVE APPLICATIONS IN DIGITAL THERAPEUTIC (DTX) MARKET, BY APPLICATION, 2019-2028 (USD MILLION)
TABLE 126 PHILIPPINES DIGITAL THERAPEUTIC (DTX) MARKET, BY PURCHASE MODE, 2019-2028 (USD MILLION)
TABLE 127 PHILIPPINES GROUP PURCHASE ORGANIZATION IN DIGITAL THERAPEUTIC (DTX) MARKET, BY PURCHASE MODE, 2019-2028 (USD MILLION)
TABLE 128 PHILIPPINES INDIVIDUAL IN DIGITAL THERAPEUTIC (DTX) MARKET, BY PURCHASE MODE, 2019-2028 (USD MILLION)
TABLE 129 PHILIPPINES DIGITAL THERAPEUTIC (DTX) MARKET, BY SALES CHANNEL, 2019-2028 (USD MILLION)
TABLE 130 PHILIPPINES B2B IN DIGITAL THERAPEUTIC (DTX) MARKET, BY SALES CHANNEL, 2019-2028 (USD MILLION)
TABLE 131 PHILIPPINES B2C IN DIGITAL THERAPEUTIC (DTX) MARKET, BY SALES CHANNEL, 2019-2028 (USD MILLION)
TABLE 132 REST OF ASIA-PACIFIC DIGITAL THERAPEUTIC (DTX) MARKET, BY PRODUCT AND SERVICE TYPE, 2019-2028 (USD MILLION)
List of Figure
LIST OF FIGURES
FIGURE 1 ASIA-PACIFIC DIGITAL THERAPEUTIC (DTX) MARKET: SEGMENTATION
FIGURE 2 ASIA-PACIFIC DIGITAL THERAPEUTIC (DTX) MARKET : DATA TRIANGULATION
FIGURE 3 ASIA-PACIFIC DIGITAL THERAPEUTIC (DTX) MARKET: DROC ANALYSIS
FIGURE 4 ASIA-PACIFIC DIGITAL THERAPEUTIC (DTX) MARKET: ASIA-PACIFIC VS REGIONAL MARKET ANALYSIS
FIGURE 5 ASIA-PACIFIC DIGITAL THERAPEUTIC (DTX) MARKET: COMPANY RESEARCH ANALYSIS
FIGURE 6 ASIA-PACIFIC DIGITAL THERAPEUTIC (DTX) MARKET: MULTIVARIATE MODELLING
FIGURE 7 ASIA-PACIFIC DIGITAL THERAPEUTIC (DTX) MARKET: INTERVIEW DEMOGRAPHICS
FIGURE 8 ASIA-PACIFIC DIGITAL THERAPEUTIC (DTX) MARKET: DBMR MARKET POSITION GRID
FIGURE 9 ASIA-PACIFIC DIGITAL THERAPEUTIC (DTX) MARKET: MARKET APPLICATION COVERAGE GRID
FIGURE 10 ASIA-PACIFIC DIGITAL THERAPEUTIC (DTX) MARKET: VENDOR SHARE ANALYSIS
FIGURE 11 ASIA-PACIFIC IS EXPECTED TO DOMINATE THE GLOBA DIGITAL THERAPEUTIC (DTX) MARKET AND IS EXPECTED TO GROW WITH THE HIGHEST CAGR IN THE FORECAST PERIOD OF 2021 TO 2028
FIGURE 12 INCREASING DEMAND OF DIGITAL THERAPEUTICS WORLDWIDE DUE TO PREVALENCE OF CHRONIC DISEASES IS EXPECTED TO DRIVE THE MARKET GROWTH IN THE FORECAST PERIOD OF 2021 TO 2028.
FIGURE 13 SOLUTIONS/SOFTWARE SEGMENT IS EXPECTED TO ACCOUNT FOR THE LARGEST SHARE OF THE ASIA-PACIFIC DIGITAL THERAPEUTIC (DTX) MARKET IN 2021 & 2028
FIGURE 14 ASIA-PACIFIC IS THE FASTEST GROWING MARKET FOR DIGITAL THERAPEUTICS (DTX) MANUFACTURERS IN THE FORECAST PERIOD OF 2021 TO 2028
FIGURE 15 DRIVERS, RESTRAINTS, OPPORTUNITIES AND CHALLENGES OF ASIA-PACIFIC DIGITAL THERAPEUTIC (DTX) MARKET
FIGURE 16 ASIA-PACIFIC DIGITAL THERAPEUTIC (DTX) MARKET: BY PRODUCT AND SERVICE TYPE, 2020
FIGURE 17 ASIA-PACIFIC DIGITAL THERAPEUTIC (DTX) MARKET: BY PRODUCT AND SERVICE TYPE, 2020-2028 (USD MILLION)
FIGURE 18 ASIA-PACIFIC DIGITAL THERAPEUTIC (DTX) MARKET: BY PRODUCT AND SERVICE TYPE, CAGR (2021-2028)
FIGURE 19 ASIA-PACIFIC DIGITAL THERAPEUTIC (DTX) MARKET: BY PRODUCT AND SERVICE TYPE, LIFELINE CURVE
FIGURE 20 ASIA-PACIFIC DIGITAL THERAPEUTIC (DTX) MARKET: BY APPLICATION, 2020
FIGURE 21 ASIA-PACIFIC DIGITAL THERAPEUTIC (DTX) MARKET: BY APPLICATION, 2020-2028 (USD MILLION)
FIGURE 22 ASIA-PACIFIC DIGITAL THERAPEUTIC (DTX) MARKET: BY APPLICATION, CAGR (2021-2028)
FIGURE 23 ASIA-PACIFIC DIGITAL THERAPEUTIC (DTX) MARKET: BY APPLICATION, LIFELINE CURVE
FIGURE 24 ASIA-PACIFIC DIGITAL THERAPEUTIC (DTX) MARKET: BY PURCHASE MODE, 2020
FIGURE 25 ASIA-PACIFIC DIGITAL THERAPEUTIC (DTX) MARKET: BY PURCHASE MODE, 2020-2028 (USD MILLION)
FIGURE 26 ASIA-PACIFIC DIGITAL THERAPEUTIC (DTX) MARKET: BY PURCHASE MODE, CAGR (2021-2028)
FIGURE 27 ASIA-PACIFIC DIGITAL THERAPEUTIC (DTX) MARKET: BY PURCHASE MODE, LIFELINE CURVE
FIGURE 28 ASIA-PACIFIC DIGITAL THERAPEUTIC (DTX) MARKET: BY SALES CHANNEL, 2020
FIGURE 29 ASIA-PACIFIC DIGITAL THERAPEUTIC (DTX) MARKET: BY SALES CHANNEL, 2020-2028 (USD MILLION)
FIGURE 30 ASIA-PACIFIC DIGITAL THERAPEUTIC (DTX) MARKET: BY SALES CHANNEL, CAGR (2021-2028)
FIGURE 31 ASIA-PACIFIC DIGITAL THERAPEUTIC (DTX) MARKET: BY SALES CHANNEL, LIFELINE CURVE
FIGURE 32 ASIA-PACIFIC DIGITAL THERAPEUTIC (DTX) MARKET: SNAPSHOT (2020)
FIGURE 33 ASIA-PACIFIC DIGITAL THERAPEUTIC (DTX) MARKET: BY COUNTRY (2020)
FIGURE 34 ASIA-PACIFIC DIGITAL THERAPEUTIC (DTX) MARKET: BY COUNTRY (2021 & 2028)
FIGURE 35 ASIA-PACIFIC DIGITAL THERAPEUTIC (DTX) MARKET: BY COUNTRY (2020 & 2028)
FIGURE 36 ASIA-PACIFIC DIGITAL THERAPEUTIC (DTX) MARKET: BY PRODUCT AND SERVICE (2021-2028)
FIGURE 37 ASIA-PACIFIC DIGITAL THERAPEUTIC (DTX) MARKET: COMPANY SHARE 2020 (%)
Data collection and base year analysis are done using data collection modules with large sample sizes. The stage includes obtaining market information or related data through various sources and strategies. It includes examining and planning all the data acquired from the past in advance. It likewise envelops the examination of information inconsistencies seen across different information sources. The market data is analysed and estimated using market statistical and coherent models. Also, market share analysis and key trend analysis are the major success factors in the market report. To know more, please request an analyst call or drop down your inquiry.
The key research methodology used by DBMR research team is data triangulation which involves data mining, analysis of the impact of data variables on the market and primary (industry expert) validation. Data models include Vendor Positioning Grid, Market Time Line Analysis, Market Overview and Guide, Company Positioning Grid, Patent Analysis, Pricing Analysis, Company Market Share Analysis, Standards of Measurement, Global versus Regional and Vendor Share Analysis. To know more about the research methodology, drop in an inquiry to speak to our industry experts.
Data Bridge Market Research is a leader in advanced formative research. We take pride in servicing our existing and new customers with data and analysis that match and suits their goal. The report can be customized to include price trend analysis of target brands understanding the market for additional countries (ask for the list of countries), clinical trial results data, literature review, refurbished market and product base analysis. Market analysis of target competitors can be analyzed from technology-based analysis to market portfolio strategies. We can add as many competitors that you require data about in the format and data style you are looking for. Our team of analysts can also provide you data in crude raw excel files pivot tables (Fact book) or can assist you in creating presentations from the data sets available in the report.


