
Asia Pacific Distributed Antenna System Das Market
Market Size in USD Billion
 USD
10.72 Billion
USD
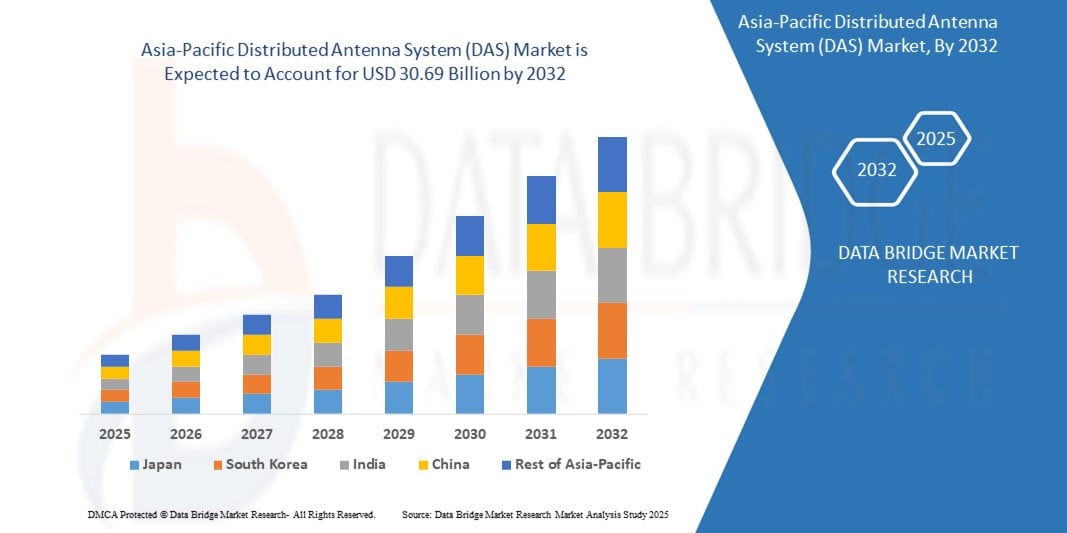
30.69 Billion
2024
2032
USD
10.72 Billion
USD
30.69 Billion
2024
2032
| 2025 - 2032 | |
| USD 10.72 Billion | |
| USD 30.69 Billion | |
| % | |
|
Asia-Pacific Distributed Antenna System (DAS) Market Size
- The Asia-Pacific Distributed Antenna System (DAS) Market size was valued at USD 10.72 billion in 2024 and is expected to reach USD 30.69 billion by 2032, at a CAGR of 16.2% during the forecast period
- The Asia-Pacific Distributed Antenna System (DAS) Market is driven rapid urbanization, leading to densely populated areas with a high demand for seamless and high-quality wireless connectivity.
Asia-Pacific Distributed Antenna System (DAS) Market Analysis
- Major metropolitan areas in the Asia-Pacific region, such as Shanghai, Tokyo, Mumbai, and Singapore, are experiencing unprecedented population growth and urbanization. This surge places immense pressure on existing wireless infrastructure, leading to network congestion and coverage gaps.
- The rollout of 5G networks across the region has further intensified the demand for DAS solutions. 5G technology promises faster data speeds, lower latency, and increased network capacity, necessitating the deployment of DAS to enhance indoor and outdoor coverage, especially in densely populated urban areas.
- China is expected to dominate the Asia-Pacific Distributed Antenna System (DAS) Market due to its robust industrial base, increasing number of smartphone users and the proliferation of IoT devices are driving the need for robust indoor and outdoor wireless coverage. DAS solutions are crucial for distributing signals effectively within these environments, addressing challenges posed by high-rise buildings and crowded spaces.
- India is anticipated to be the fastest-growing region in the Asia Pacific LNA market during the forecast period. This growth is supported by the exponential growth in mobile data traffic, fuelled by increased smartphone usage and data-intensive applications, necessitates enhanced network capacity and coverage.
- The Hardware segment is expected to dominate the Asia-Pacific Distributed Antenna System (DAS) Market, with a market share of 54.23% during the forecast period. The Asia-Pacific region is undergoing rapid urbanization and a significant expansion of its telecommunications infrastructure, including the aggressive rollout of 4G and 5G networks. This necessitates substantial investments in hardware components like antennas, radio units, cables, and head-end units to build and enhance network coverage and capacity.
Report Scope and Asia-Pacific Distributed Antenna System (DAS) Market Segmentation
|
Attributes |
Asia-Pacific Distributed Antenna System (DAS) Market Insights |
|
Segments Covered |
|
|
Countries Covered |
Asia Pacific
|
|
Key Market Players |
|
|
Market Opportunities |
|
|
Value Added Data Infosets |
In addition to the insights on market scenarios such as market value, growth rate, segmentation, geographical coverage, and major players, the market reports curated by the Data Bridge Market Research also include import export analysis, production capacity overview, production consumption analysis, price trend analysis, climate change scenario, supply chain analysis, value chain analysis, raw material/consumables overview, vendor selection criteria, PESTLE Analysis, Porter Analysis, and regulatory framework. |
Asia-Pacific Distributed Antenna System (DAS) Market Trends
“Adoption of AI and Machine Learning for Real-Time Anomaly Detection”
- With rapid urbanization across the Asia-Pacific, there's a significant need for enhanced indoor coverage in commercial buildings, shopping malls, hospitals, airports, and residential complexes. Indoor DAS solutions are crucial for providing reliable connectivity in these high-density environments.
- Modern building materials often impede outdoor wireless signals, making indoor DAS essential for ensuring seamless mobile experience within buildings.
- For instance, In January 2024, Nokia and China Mobile jointly developed a 5G low-cost hybrid distributed indoor system. This system utilizes Nokia's 5G Pico Remote Radio Head system, passive DAS antennas, and Bluetooth Low Energy (BLE) technology to meet the challenges of indoor 5G coverage. (Source: Mordor Intelligence, Date likely before January 2024 as the article references December 2022 data).
- The growing demand for proactive surveillance, stricter regulatory frameworks, and the expansion of digital trading across multiple asset classes, fostering a more transparent and compliant financial ecosystem.
Asia-Pacific Distributed Antenna System (DAS) Market Dynamics
Driver
“Expansion of 5G Networks and High-Speed Wireless Communication”
- The deployment of 5G networks across Asia Pacific is significantly increasing the demand for high-performance LNAs. These amplifiers are essential for enhancing signal quality and reducing noise in high-frequency applications, including 5G base stations and user devices.
- The Asia Pacific Union's investment in 5G infrastructure is projected to reach €10.6 trillion across industries by 2035, highlighting the substantial growth potential for LNAs in the region.
For instance:
- In 2024, in December 2024, India's Bharti Airtel signed a multi-billion-dollar deal with Ericsson to boost its 4G and 5G coverage, indicating substantial investments in network infrastructure.
- As 5G deployment accelerates across the region, there is a rising need for DAS that can support higher frequencies, improved signal quality, and greater network efficiency. These systems play a critical role in enhancing the coverage and performance of wireless communication networks, making them indispensable in the evolving telecommunications landscape. Consequently, the proliferation of 5G infrastructure is expected to significantly boost the adoption of DAS, reinforcing their strategic importance in Asia-Pacific's advanced communication ecosystem..
Opportunity
“Integration of DAS in Automotive Advanced Driver-Assistance Systems (ADAS)”
- The automotive industry's shift towards advanced driver-assistance systems and autonomous driving technologies is creating opportunities for DAS integration. DAS are critical in automotive communication systems, improving signal reception and processing.
- The growing demand for safety features and infotainment systems in vehicles is driving the adoption of DAS in the automotive sector.
For instance,
- In 2025, Huawei showcased its advanced driving assistance system (ADAS) called Qiankun, installed by at least seven Chinese automakers, including Volkswagen's China-made Audi Q6L e-tron, highlighting the integration of advanced communication systems in vehicles.
- The integration of Distributed Antenna Systems (DAS) into Advanced Driver-Assistance Systems (ADAS) presents a significant growth opportunity for the Asia-Pacific DAS market. As Asia-Pacific automotive manufacturers increasingly prioritize safety, autonomous driving capabilities, and sensor-rich systems, DAS play a crucial role in enhancing signal reception quality and connectivity across communication modules.
Restraint/Challenge
“Data Privacy Concerns and Regulatory Fragmentation Across Asia-Pacific”
- Implementing DAS solutions across Asia-Pacific is challenging due to strict data privacy laws and varying regulations across countries, which impose limits on where and how data is processed and stored.
- Regulatory fragmentation across Asia-Pacific countries creates barriers to deploying uniform DAS tools, leading to higher customization costs.
For instance,
- In February 2024, discussions at the World Trade Organization highlighted the complexities of digital trade regulations, with countries like India and Indonesia considering changes to digital service tariffs, reflecting the regulatory uncertainties in the region.
- Data privacy concerns and regulatory fragmentation across Asia-Pacific are creating significant challenges for deploying unified DAS systems. Strict data protection regulations and differing national laws increase customization costs and hinder integration, slowing down the implementation of modern DAS solutions across the region.
Scope
The market is segmented on the basis component, deployment model, organization size and vertical.
|
Segmentation |
Sub-Segmentation |
|
By Offering: |
|
|
By Coverage: |
|
|
By Ownership: |
|
|
By Technology |
|
|
By User Facility |
|
|
By Vertical |
|
In 2025, the Hardware is projected to dominate the market with a largest share in by component segment
The Hardware segment is expected to dominate the Asia-Pacific Distributed Antenna System (DAS) Market, with a market share of 52.23% during the forecast period. Increasing demand for sophisticated, real-time monitoring tools. Advanced surveillance systems enable regulatory compliance by detecting market manipulation, fraud, and irregular trading behaviours across various asset classes.
The Indoor is expected to account for the largest share during the forecast period in Asia-Pacific Distributed Antenna System (DAS) Market
In 2025, the Indoor segment in the Asia-Pacific Distributed Antenna System (DAS) Market is projected to hold the largest share of approximately 61.3%. Cloud-based surveillance solutions are gaining momentum in Asia Pacific due to their scalability, cost-effectiveness, and ability to handle vast amounts of trade data. These platforms enhance real-time monitoring capabilities and support the cross-market and cross-asset surveillance needed for complex financial operations.
Asia-Pacific Distributed Antenna System (DAS) Market Regional Analysis
“China Holds the Largest Share in the Asia-Pacific Distributed Antenna System (DAS) Market”
- China is the dominant player in the Asia-Pacific Distributed Antenna System (DAS) Market, driven by its advanced financial infrastructure, highly regulated markets, and strong emphasis on technological adoption in surveillance systems. The country’s role as a financial hub further strengthens its market position.
- China’s financial institutions prioritize cutting-edge surveillance tools to ensure compliance with strict regulatory frameworks.
- A strong focus on the integration of AI-driven analytics and real-time monitoring enhances China’s leading role in the market.
- Government initiatives supporting digital transformation and regulatory updates boost China’s dominance in financial technology.
“India is Projected to Register the Highest CAGR in the Asia-Pacific Distributed Antenna System (DAS) Market”
- India is expected to witness the highest compound annual growth rate (CAGR) in the Asia-Pacific Distributed Antenna System (DAS) Market, fuelled by the country's growing adoption of advanced surveillance systems and regulatory technologies.
- The increase in digital trading and cross-border financial operations drives the demand for real-time surveillance systems.
- India regulatory landscape is evolving to support the use of AI and machine learning, enhancing the capabilities of trade surveillance tools.
- The rise in financial market complexity and demand for global compliance solutions further accelerates the market growth in India.
Asia-Pacific Distributed Antenna System (DAS) Market Share
The market competitive landscape provides details by competitor. Details included are company overview, company financials, revenue generated, market potential, investment in research and development, new market initiatives, global presence, production sites and facilities, production capacities, company strengths and weaknesses, product launch, product width and breadth, application dominance. The above data points provided are only related to the companies' focus related to market.
The Major Market Leaders Operating in the Market Are:
- AT&T.
- ATC IP LLC
- Corning Incorporated
- CommScope, Inc
- Hughes Network Systems
- Anixter Inc.
- Bird.
- BTI Wireless
- Cobham Wireless
- Comba Telecom Systems Holdings Ltd.
- Dali Wireless
- GALTRONICS
- HUBER+SUHNER
- RFI Technology Solutions
- Westell Technologies, Inc.,
- CenRF Communications Limited
Latest Developments in Asia-Pacific Distributed Antenna System (DAS) Market
- In October 2024, Frog Cellsat Introduced a 5G active DAS solution, smart mini boosters, and VHF repeater at the India Mobile Congress. These technologies aim to enhance connectivity in major venues like airports and metro systems, addressing the growing demand for high-capacity networks.
- In June 2024, NEC Corporation Announced a breakthrough in radio-over-fiber technology by introducing a 1-bit fibre transmission method. This innovation facilitates cost-effective millimeter-wave communication networks, essential for Beyond 5G/6G applications in high-density indoor environments such as high-rise buildings and factories.
SKU-

- Interactive Data Analysis Dashboard
- Company Analysis Dashboard for high growth potential opportunities
- Research Analyst Access for customization & queries
- Competitor Analysis with Interactive dashboard
- Latest News, Updates & Trend analysis
- Harness the Power of Benchmark Analysis for Comprehensive Competitor Tracking
Data collection and base year analysis are done using data collection modules with large sample sizes. The stage includes obtaining market information or related data through various sources and strategies. It includes examining and planning all the data acquired from the past in advance. It likewise envelops the examination of information inconsistencies seen across different information sources. The market data is analysed and estimated using market statistical and coherent models. Also, market share analysis and key trend analysis are the major success factors in the market report. To know more, please request an analyst call or drop down your inquiry.
The key research methodology used by DBMR research team is data triangulation which involves data mining, analysis of the impact of data variables on the market and primary (industry expert) validation. Data models include Vendor Positioning Grid, Market Time Line Analysis, Market Overview and Guide, Company Positioning Grid, Patent Analysis, Pricing Analysis, Company Market Share Analysis, Standards of Measurement, Global versus Regional and Vendor Share Analysis. To know more about the research methodology, drop in an inquiry to speak to our industry experts.
Data Bridge Market Research is a leader in advanced formative research. We take pride in servicing our existing and new customers with data and analysis that match and suits their goal. The report can be customized to include price trend analysis of target brands understanding the market for additional countries (ask for the list of countries), clinical trial results data, literature review, refurbished market and product base analysis. Market analysis of target competitors can be analyzed from technology-based analysis to market portfolio strategies. We can add as many competitors that you require data about in the format and data style you are looking for. Our team of analysts can also provide you data in crude raw excel files pivot tables (Fact book) or can assist you in creating presentations from the data sets available in the report.


