
Asia Pacific Distributed Energy Resources Management System Derms Market
Market Size in USD Million
 USD
199.20 Million
USD
613.62 Million
2025
2033
USD
199.20 Million
USD
613.62 Million
2025
2033
| 2026 - 2033 | |
| USD 199.20 Million | |
| USD 613.62 Million | |
| % | |
|
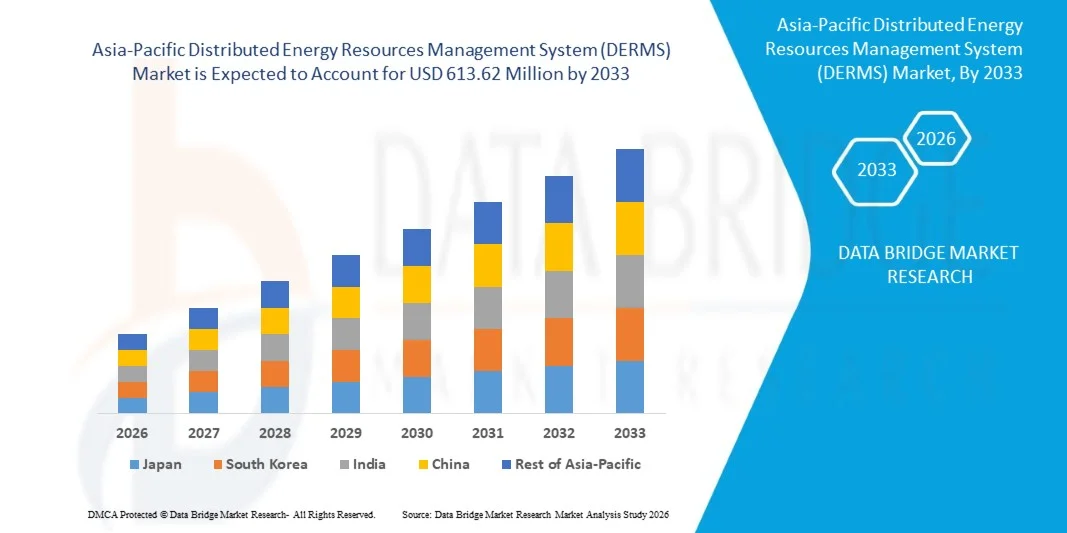
Asia-Pacific Distributed Energy Resources Management System (DERMS) Market Size
- The Asia-Pacific Distributed Energy Resources Management System (DERMS) market size was valued at USD 199.20 million in 2025 and is expected to reach USD 613.62 million by 2033, at a CAGR of 15.1% during the forecast period
- The market growth is largely fueled by the increasing adoption of renewable energy sources and the need for efficient grid management, leading to enhanced integration of distributed energy resources across residential, commercial, and industrial sectors
- Furthermore, rising utility and enterprise demand for real-time monitoring, predictive analytics, and automated control of energy assets is establishing Distributed Energy Resources Management System (DERMS) as a critical solution for optimizing grid performance. These converging factors are accelerating the deployment of Distributed Energy Resources Management System (DERMS) solutions, thereby significantly boosting the industry's growth
Asia-Pacific Distributed Energy Resources Management System (DERMS) Market Analysis
- Distributed energy resources management systems, offering centralized monitoring, control, and optimization of distributed energy assets, are increasingly vital for modern power grids due to their ability to manage renewable integration, energy storage, and demand response initiatives
- The escalating demand for Distributed Energy Resources Management System (DERMS) is primarily fueled by the growing need for grid resilience, efficient energy distribution, and enhanced operational reliability, coupled with increasing investments in smart grid infrastructure and sustainable energy management technologies
- China dominated the Distributed Energy Resources Management System (DERMS) market in 2025, due to its rapid renewable energy expansion, extensive smart grid initiatives, and government policies supporting distributed energy integration
- India is expected to be the fastest growing country in the Distributed Energy Resources Management System (DERMS) market during the forecast period due to the increasing deployment of renewable energy sources, rapid urbanization, and government initiatives such as the National Smart Grid Mission
- Solar PV segment dominated the market with a market share of 42.1% in 2025, due to the increasing adoption of solar energy for distributed generation and government incentives promoting renewable integration. Solar PV systems are often preferred for their modularity, scalability, and compatibility with Distributed Energy Resources Management System (DERMS) solutions for real-time monitoring and optimization. The market also sees strong demand due to the declining cost of solar panels and enhanced grid management capabilities that Distributed Energy Resources Management System (DERMS) provide
Report Scope and Asia-Pacific Distributed Energy Resources Management System (DERMS) Market Segmentation
|
Attributes |
Asia-Pacific Distributed Energy Resources Management System (DERMS) Key Market Insights |
|
Segments Covered |
|
|
Countries Covered |
Asia-Pacific
|
|
Key Market Players |
|
|
Market Opportunities |
|
|
Value Added Data Infosets |
In addition to the insights on market scenarios such as market value, growth rate, segmentation, geographical coverage, and major players, the market reports curated by the Data Bridge Market Research also include in-depth expert analysis, geographically represented company-wise production and capacity, network layouts of distributors and partners, detailed and updated price trend analysis and deficit analysis of supply chain and demand. |
Distributed Energy Resources Management System (DERMS) Market Trends
“Integration of Renewable Energy Sources with Advanced Grid Management”
- A significant trend in the Distributed Energy Resources Management System (DERMS) market is the growing integration of renewable energy sources such as solar, wind, and energy storage systems with advanced grid management solutions. This integration enables utilities to balance distributed energy generation with demand, enhance grid stability, and optimize energy flows across transmission and distribution networks
- For instance, Siemens and Schneider Electric provide Distributed Energy Resources Management System (DERMS) solutions that enable real-time coordination of solar farms, wind turbines, and battery storage units. These solutions help utilities reduce grid congestion, improve reliability, and facilitate the transition toward low-carbon energy systems
- The adoption of Distributed Energy Resources Management System (DERMS) is accelerating as utilities implement intelligent load management and demand response programs to maintain grid stability in regions with high renewable penetration. This is positioning Distributed Energy Resources Management System (DERMS) as critical infrastructure for modern, decarbonized energy networks
- Energy storage integration with Distributed Energy Resources Management System (DERMS) is expanding rapidly, as batteries and microgrids help store excess renewable energy and release it during peak demand periods. This trend strengthens grid resilience and allows utilities to manage fluctuations caused by intermittent renewable generation
- Industrial and commercial facilities are increasingly deploying Distributed Energy Resources Management System (DERMS) -enabled microgrids to improve energy efficiency, reduce costs, and support sustainability goals. Such deployments highlight the role of Distributed Energy Resources Management System (DERMS) in decentralized energy management and operational optimization
- The market is witnessing strong growth as regulatory frameworks and government incentives encourage renewable adoption, requiring advanced management systems to coordinate distributed assets. This rising incorporation of Distributed Energy Resources Management System (DERMS) is reinforcing the overall transition toward smarter, more reliable, and sustainable electricity grids
Distributed Energy Resources Management System (DERMS) Market Dynamics
Driver
“Rising Demand for Real-Time Monitoring and Control”
- The growing need for real-time visibility into distributed energy resources is driving demand for Distributed Energy Resources Management System (DERMS) solutions that enable rapid monitoring, predictive analytics, and automated control of generation and storage assets. These systems allow utilities to respond promptly to grid disturbances and maintain reliable energy delivery
- For instance, companies such as GE Digital supply Distributed Energy Resources Management System (DERMS) platforms that provide real-time situational awareness and control over distributed energy resources. This capability helps utilities optimize load balancing and prevent outages during variable renewable generation
- Utilities are investing in Distributed Energy Resources Management System (DERMS) to enhance demand response programs, improve voltage regulation, and support frequency control. These functionalities are crucial for maintaining grid stability as renewable penetration increases
- The integration of smart sensors and IoT-enabled devices with Distributed Energy Resources Management System (DERMS) systems is enabling predictive maintenance and operational efficiency improvements. This technological advancement is enhancing asset utilization and reducing unplanned downtime
- The adoption of Distributed Energy Resources Management System (DERMS) across transmission and distribution networks supports improved energy efficiency, better load forecasting, and enhanced operational planning. These factors collectively reinforce the importance of real-time monitoring and control in grid modernization efforts
Restraint/Challenge
“High Implementation and Operational Costs for DERMS Solutions”
- The Distributed Energy Resources Management System (DERMS) market faces challenges due to the high costs associated with deploying, integrating, and maintaining advanced grid management platforms. These costs include hardware, software, communication infrastructure, and skilled labor for configuration and ongoing operations
- For instance, utilities implementing Schneider Electric or Siemens Distributed Energy Resources Management System (DERMS) platforms incur substantial upfront investment and recurring operational expenses. This can limit adoption, particularly for smaller utilities or regions with constrained budgets
- Integration complexity with existing SCADA, AMI, and other utility systems increases project timelines and cost uncertainty. Ensuring seamless interoperability while maintaining cybersecurity and compliance adds further financial and technical burdens
- The reliance on high-performance computing, advanced analytics, and secure communication networks raises operational costs and demands continuous system upgrades. These requirements can impact ROI and slow deployment rates in cost-sensitive markets
- The market continues to face constraints from budget limitations and the need for long-term financial planning to support Distributed Energy Resources Management System (DERMS) investments. These challenges collectively place pressure on utilities and solution providers to optimize cost structures while delivering high-performance grid management capabilities
Distributed Energy Resources Management System (DERMS) Market Scope
The market is segmented on the basis of technology, software, and end-user.
• By Technology
On the basis of technology, the Distributed Energy Resources Management System (DERMS) market is segmented into Solar PV, Wind, CHP (Combined Heat & Power), Energy Storage, and Other. The Solar PV segment dominated the market with the largest revenue share of 42.1% in 2025, driven by the increasing adoption of solar energy for distributed generation and government incentives promoting renewable integration. Solar PV systems are often preferred for their modularity, scalability, and compatibility with Distributed Energy Resources Management System (DERMS) solutions for real-time monitoring and optimization. The market also sees strong demand due to the declining cost of solar panels and enhanced grid management capabilities that Distributed Energy Resources Management System (DERMS) provide.
The Energy Storage segment is anticipated to witness the fastest growth rate from 2026 to 2033, fueled by rising deployment of batteries and hybrid storage systems to manage grid fluctuations and renewable intermittency. Energy storage integration with Distributed Energy Resources Management System (DERMS) enables utilities and enterprises to optimize peak load management, enhance reliability, and store excess energy for later use. Increasing focus on microgrid solutions and off-grid applications further drives the adoption of energy storage technologies.
• By Software
On the basis of software, the Distributed Energy Resources Management System (DERMS) market is segmented into Analytics, Virtual Power Plants, and Management & Control. The Management & Control segment held the largest market revenue share in 2025, driven by the need for real-time monitoring, automated decision-making, and centralized control of distributed energy assets. Distributed Energy Resources Management System (DERMS) software provides utilities with precise forecasting, dispatch optimization, and enhanced operational efficiency, enabling seamless integration of distributed resources into the grid. The widespread implementation of smart grids and automated energy management reinforces demand for comprehensive management and control solutions.
The Virtual Power Plants (VPP) segment is expected to witness the fastest growth rate from 2026 to 2033, fueled by the increasing aggregation of distributed energy resources to participate in energy markets and demand response programs. For instance, companies such as Next Kraftwerke are leveraging VPP software to optimize energy trading and grid balancing. VPP solutions also allow flexible energy dispatch, support renewable integration, and enhance grid resiliency, making them highly attractive for both utilities and commercial operators.
• By End-User
On the basis of end-user, the Distributed Energy Resources Management System (DERMS) market is segmented into Infrastructure, Power, Oil & Gas, Automotive, Aerospace, Mining, Marine, Water & Waste Water, Food & Beverages, Semi-conductors, Pulp & Paper, CPG, HPC, Entertainment, Life Sciences, and Others. The Power segment dominated the market with the largest revenue share in 2025, driven by utility-scale adoption of Distributed Energy Resources Management System (DERMS) for optimizing grid operations and integrating renewable generation. Power sector operators prioritize Distributed Energy Resources Management System (DERMS) for improved reliability, predictive maintenance, and operational efficiency across generation, transmission, and distribution assets. Increasing policy support and investment in smart grid modernization further strengthen the demand within the power industry.
The Infrastructure segment is anticipated to witness the fastest growth rate from 2026 to 2033, fueled by the rising deployment of Distributed Energy Resources Management System (DERMS) in smart cities, campuses, and industrial complexes for efficient energy management. For instance, Siemens is implementing Distributed Energy Resources Management System (DERMS) in large infrastructure projects to optimize energy distribution, reduce peak demand, and integrate renewable sources. The growing focus on sustainable and resilient infrastructure enhances adoption, with Distributed Energy Resources Management System (DERMS) providing centralized control, analytics, and automated energy optimization capabilities.
Distributed Energy Resources Management System (DERMS) Market Regional Analysis
- China dominated the Distributed Energy Resources Management System (DERMS) market with the largest revenue share in 2025, driven by its rapid renewable energy expansion, extensive smart grid initiatives, and government policies supporting distributed energy integration
- Strong investments in solar and wind farms, coupled with the adoption of advanced grid management platforms by utilities such as State Grid Corporation of China, reinforce China’s leadership in the regional market
- The presence of leading domestic technology providers, partnerships with global Distributed Energy Resources Management System (DERMS) solution companies, and deployment of large-scale energy storage projects continue to consolidate China’s dominant position during the forecast period
Japan Distributed Energy Resources Management System (DERMS) Market Insight
The Japan market is anticipated to grow steadily from 2026 to 2033, supported by its advanced energy infrastructure, high renewable energy adoption, and government emphasis on grid stability and energy efficiency. Japanese utilities are increasingly integrating Distributed Energy Resources Management System (DERMS) solutions from companies such as Hitachi Energy to optimize distributed energy and microgrid operations. Demand is rising for solutions that enable real-time monitoring, predictive maintenance, and automated load balancing due to Japan’s focus on energy reliability and smart grid innovation. Continuous R&D investments and collaborations between Japanese technology providers and global Distributed Energy Resources Management System (DERMS) solution companies reinforce the market’s steady growth outlook. Japan’s commitment to energy modernization, operational efficiency, and system reliability underpins its strong regional positioning.
India Distributed Energy Resources Management System (DERMS) Market Insight
India is projected to register the fastest CAGR in the Asia Pacific Distributed Energy Resources Management System (DERMS) market during 2026–2033, fueled by the increasing deployment of renewable energy sources, rapid urbanization, and government initiatives such as the National Smart Grid Mission. Rising investments in solar, wind, and energy storage projects, along with the adoption of Distributed Energy Resources Management System (DERMS) platforms from companies such as ABB, are accelerating the modernization of distribution networks. Demand for cost-effective and scalable Distributed Energy Resources Management System (DERMS) solutions is particularly strong among utilities seeking to manage growing energy demand and intermittent renewable generation. Expanding partnerships with global solution providers, government incentives, and digital grid transformation initiatives are enhancing solution accessibility. Policy support and the focus on reliable, flexible, and sustainable energy networks ensure India’s emergence as the fastest-growing market in the region.
Distributed Energy Resources Management System (DERMS) Market Share
The Distributed Energy Resources Management System (DERMS) industry is primarily led by well-established companies, including:
- Google (U.S.)
- IBM Corporation (U.S.)
- Amazon (U.S.)
- Microsoft (U.S.)
- VMware, Inc. (U.S.)
- Hewlett Packard Enterprise Development LP (U.S.)
- Dell Inc (U.S.)
- Huawei Technologies Co., Ltd. (China)
- FUJITSU (Japan)
- Nutanix (U.S.)
- NetApp (U.S.)
- Quantum Corporation (U.S.)
- Scale Computing (U.S.)
- DataCore Software (U.S.)
- Maxta (U.S.)
- SANGFOR TECHNOLOGIES (China)
- SAP SE (Germany)
Latest Developments in Asia-Pacific Distributed Energy Resources Management System (DERMS) Market
- In November 2022, Oracle deployed its Advanced Distribution Management System to support FirstEnergy, an Ohio-based utility, in managing power outages across its six-state electric network. This deployment enhanced operational efficiency and control across FirstEnergy’s 10 electric utilities, enabling real-time monitoring and faster outage resolution. The implementation reinforced Oracle’s position in the Distributed Energy Resources Management System (DERMS) market by demonstrating the value of integrated network management solutions for large-scale utility operations and strengthening its credibility among utility operators seeking grid resilience
- In November 2022, Awesense Wireless Inc. partnered with Kitu Systems Inc. to accelerate the rollout of Distributed Energy Resource Management Systems for electric utilities. The collaboration addresses critical challenges such as outdated data models and limited real-time visibility, enabling utilities to make more informed decisions and respond dynamically to grid fluctuations. This strategic partnership highlights the growing demand for advanced Distributed Energy Resources Management System (DERMS) solutions that enhance grid intelligence and resilience, positioning both companies as key players in the evolving smart energy ecosystem
- In October 2022, Generac’s DERMS solution was selected by Dominion Energy Virginia to improve grid reliability and optimize energy distribution. The system’s ability to manage diverse distributed resources, including rooftop solar panels, smart thermostats, EVs, and home battery storage, provides utilities with enhanced control over decentralized energy assets. This adoption underscores Generac’s expanding influence in the Distributed Energy Resources Management System (DERMS) market and signals the increasing need for flexible solutions that integrate residential and commercial distributed energy resources
- In September 2022, Itron integrated its IoT systems with Samsung's SmartThings Energy platform to upgrade Distributed Energy Resources Management System (DERMS) capabilities for utility providers. This integration offers consumers real-time insights into energy usage from meters and behind-the-meter devices, improving transparency and engagement. The collaboration highlights a market trend toward consumer-centric Distributed Energy Resources Management System (DERMS) applications, reinforcing the importance of IoT-enabled platforms in enhancing both utility operations and end-user energy management
- In May 2022, GE Digital collaborated with Opus One Solutions to develop a modular Distributed Energy Resources Management System (DERMS) platform for utility companies. The software provides data analytics, operational controls, and market integration, helping utilities optimize distributed energy resources while aligning technical performance with economic objectives. This innovation strengthens GE Digital’s position in the Distributed Energy Resources Management System (DERMS) market and exemplifies the growing emphasis on scalable, modular solutions that enable utilities to manage increasingly complex distributed energy networks
SKU-

- Interactive Data Analysis Dashboard
- Company Analysis Dashboard for high growth potential opportunities
- Research Analyst Access for customization & queries
- Competitor Analysis with Interactive dashboard
- Latest News, Updates & Trend analysis
- Harness the Power of Benchmark Analysis for Comprehensive Competitor Tracking
Asia Pacific Distributed Energy Resources Management System Derms Market, Supply Chain Analysis and Ecosystem Framework
To support market growth and help clients navigate the impact of geopolitical shifts, DBMR has integrated in-depth supply chain analysis into its Asia Pacific Distributed Energy Resources Management System Derms Market research reports. This addition empowers clients to respond effectively to global changes affecting their industries. The supply chain analysis section includes detailed insights such as Asia Pacific Distributed Energy Resources Management System Derms Market consumption and production by country, price trend analysis, the impact of tariffs and geopolitical developments, and import and export trends by country and HSN code. It also highlights major suppliers with data on production capacity and company profiles, as well as key importers and exporters. In addition to research, DBMR offers specialized supply chain consulting services backed by over a decade of experience, providing solutions like supplier discovery, supplier risk assessment, price trend analysis, impact evaluation of inflation and trade route changes, and comprehensive market trend analysis.
Data collection and base year analysis are done using data collection modules with large sample sizes. The stage includes obtaining market information or related data through various sources and strategies. It includes examining and planning all the data acquired from the past in advance. It likewise envelops the examination of information inconsistencies seen across different information sources. The market data is analysed and estimated using market statistical and coherent models. Also, market share analysis and key trend analysis are the major success factors in the market report. To know more, please request an analyst call or drop down your inquiry.
The key research methodology used by DBMR research team is data triangulation which involves data mining, analysis of the impact of data variables on the market and primary (industry expert) validation. Data models include Vendor Positioning Grid, Market Time Line Analysis, Market Overview and Guide, Company Positioning Grid, Patent Analysis, Pricing Analysis, Company Market Share Analysis, Standards of Measurement, Global versus Regional and Vendor Share Analysis. To know more about the research methodology, drop in an inquiry to speak to our industry experts.
Data Bridge Market Research is a leader in advanced formative research. We take pride in servicing our existing and new customers with data and analysis that match and suits their goal. The report can be customized to include price trend analysis of target brands understanding the market for additional countries (ask for the list of countries), clinical trial results data, literature review, refurbished market and product base analysis. Market analysis of target competitors can be analyzed from technology-based analysis to market portfolio strategies. We can add as many competitors that you require data about in the format and data style you are looking for. Our team of analysts can also provide you data in crude raw excel files pivot tables (Fact book) or can assist you in creating presentations from the data sets available in the report.


