
Asia Pacific Domestic Booster Pump Market
Market Size in USD Billion
 USD
1.52 Billion
USD
3.02 Billion
2025
2033
USD
1.52 Billion
USD
3.02 Billion
2025
2033
| 2026 - 2033 | |
| USD 1.52 Billion | |
| USD 3.02 Billion | |
| % | |
|
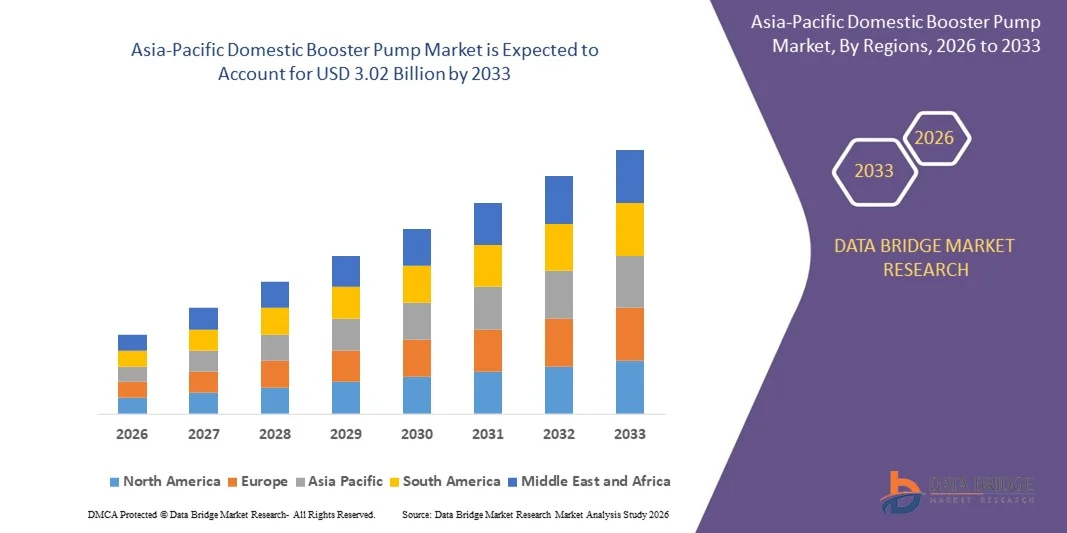
What is the Asia-Pacific Domestic Booster Pump Market Size and Growth Rate?
- The Asia-Pacific domestic booster pump market size was valued at USD 1.52 billion in 2025 and is expected to reach USD 3.02 billion by 2033, at a CAGR of 8.9% during the forecast period
- Increase in the world population is leading to the rise in requirement of water due to which the demand for domestic booster pump market is increasing with significant CAGR. High cost of installation of booster pumps is acting as major restraint for the domestic booster pump market growth
What are the Major Takeaways of Domestic Booster Pump Market?
- Increasing technological advancements in domestic booster pumps is acting as major window of opportunity for the domestic booster pump market
- Technical complexities involved with domestic booster pumps acts as a major challenge for the growth of domestic booster pump market
- China dominated the Asia-Pacific domestic booster pump market with a revenue share of 41.87% in 2025, driven by strong residential construction, rapid urban infrastructure development, and rising installation of domestic pressure-boosting systems across apartments, villas, and multi-storey housing projects
- India is projected to register the fastest CAGR of 7.58% from 2026 to 2033, driven by rapid housing construction, expanding urban populations, and widespread installation of pressure-boosting systems in high-rise apartments and gated communities
- The Single Stage segment dominated the market with an estimated 58.4% share in 2025, supported by widespread residential usage, compact design, cost-effectiveness, and ease of installation
Report Scope and Domestic Booster Pump Market Segmentation
|
Attributes |
Domestic Booster Pump Key Market Insights |
|
Segments Covered |
|
|
Countries Covered |
Asia-Pacific
|
|
Key Market Players |
|
|
Market Opportunities |
|
|
Value Added Data Infosets |
In addition to the insights on market scenarios such as market value, growth rate, segmentation, geographical coverage, and major players, the market reports curated by the Data Bridge Market Research also include in-depth expert analysis, pricing analysis, brand share analysis, consumer survey, demography analysis, supply chain analysis, value chain analysis, raw material/consumables overview, vendor selection criteria, PESTLE Analysis, Porter Analysis, and regulatory framework. |
What is the Key Trend in the Domestic Booster Pump Market?
Growing Adoption of Energy-Efficient, Smart, and Sustainable Water Pumping Solutions
- The domestic booster pump market is experiencing a strong shift toward energy-efficient designs, low-noise performance, and intelligent water-pressure management technologies, driven by rising urbanization, smart-home adoption, and stricter energy-saving regulations
- Manufacturers are integrating variable frequency drives (VFDs), smart sensors, and IoT-enabled monitoring systems to optimize pressure control, reduce power consumption, and extend pump lifespan
- Digitalization is accelerating the use of remote diagnostics, predictive maintenance, and automated pressure optimization, improving operational efficiency in residential water supply systems
- For instance, leading brands such as Grundfos, WILO SE, Xylem, Pentair, and KSB are introducing AI-enabled booster pumps with real-time monitoring, cloud connectivity, and self-adjusting pressure capabilities
- Growing emphasis on water conservation, green-building standards, and eco-friendly home infrastructure is strengthening demand across the U.S., Europe, and Asia-Pacific
- As households increasingly prioritize efficient water pressure, reduced energy bills, and digital convenience, domestic booster pumps will remain essential to modern residential water management systems worldwide
What are the Key Drivers of Domestic Booster Pump Market?
- Rising demand for consistent household water pressure, especially in multi-storey buildings, gated communities, and urban housing, is accelerating adoption of domestic booster pumps across residential applications
- For instance, in 2025, companies such as Grundfos, Franklin Electric, and Pentair expanded production of energy-efficient VFD-based booster systems to meet increasing demand from high-density housing clusters
- Growing enforcement of energy-efficiency standards, water-usage regulations, and green-building norms across the U.S., Europe, and Asia-Pacific is fueling upgrades from conventional pumps to smart, efficient booster systems
- Advancements in brushless DC motors, automated pressure control, compact pump designs, and durable corrosion-resistant materials have enhanced performance, reliability, and operational efficiency
- Rising focus on water scarcity management, low-energy residential infrastructure, and improved home comfort is further strengthening market adoption
- Supported by rapid urban development, expansion of smart-home ecosystems, and increasing renovation of aging water supply systems, the domestic booster pump market is expected to witness strong and sustained growth
Which Factor is Challenging the Growth of the Domestic Booster Pump Market?
- High certification costs, extensive testing procedures, and complex compliance requirements often burden small manufacturers and emerging construction firms
- For instance, between 2024–2025, rising costs of raw materials, testing equipment, and specialized labor resulted in longer certification timelines for many companies
- Strict regulatory standards related to fire resistance, chemical emissions, structural integrity, and environmental performance add challenges for global market entrants
- Limited technical expertise and low awareness in developing economies restrict certification adoption among small and mid-sized construction material producers
- Competition from uncertified, low-cost, and counterfeit construction products creates pricing pressure and affects market differentiation
- To overcome these challenges, companies are focusing on digital certification tools, standardized global testing frameworks, cost-efficient processes, and awareness programs to expand certification accessibility worldwide
How is the Domestic Booster Pump Market Segmented?
The market is segmented on the basis of product, material, distribution channel, and end-user.
- By Product
The domestic booster pump market is segmented into Single Stage and Multiple Stage pumps. The Single Stage segment dominated the market with an estimated 58.4% share in 2025, supported by widespread residential usage, compact design, cost-effectiveness, and ease of installation. These pumps are highly preferred in apartments, villas, and small commercial buildings due to their simple operating mechanism and reliable performance in maintaining consistent household water pressure. Their lower maintenance needs and compatibility with standard plumbing systems further strengthen adoption across both developing and mature markets.
The Multiple Stage segment is projected to grow at the fastest CAGR from 2026 to 2033, driven by rising demand for high-pressure systems in multi-storey buildings, luxury homes, and water-intensive applications. Increasing adoption of smart multi-stage pumps featuring VFDs, energy-efficient motors, and IoT-based pressure monitoring enables precise pressure control and enhanced pumping efficiency. Growing urbanization and expansion of high-rise residential infrastructure will continue to accelerate segment growth.
- By Material
The domestic booster pump market is segmented into Cast Iron, Stainless Steel, Gunmetal, Aluminium, Copper, Titanium, and Others. The Cast Iron segment dominated the market with approximately 42.1% share in 2025, owing to its durability, corrosion resistance, high structural strength, and competitive pricing. Cast-iron booster pumps are widely used in residential buildings due to their long life, ability to handle moderate impurities, and suitability for medium-pressure applications. Their affordability makes them the preferred choice in price-sensitive markets across Asia-Pacific, the Middle East, and Latin America.
The Stainless Steel segment is projected to grow at the fastest CAGR from 2026 to 2033, driven by consumer preference for hygienic, corrosion-free, and premium-grade materials suitable for drinking-water applications. Increasing adoption of stainless-steel pumps in modern homes, villas, coastal regions, and smart water systems—combined with demand for lightweight and energy-efficient materials—continues to enhance market penetration.
- By Distribution Channel
The domestic booster pump market is segmented into B2B/Direct Sales, Third-Party Distributors, Brand Websites, E-Commerce, and Others. The B2B/Direct Sales segment dominated the market with an estimated 49.6% share in 2025, driven by strong partnerships with builders, plumbing contractors, commercial installers, and facility managers. Direct sales channels ensure faster product delivery, bulk purchasing advantages, customized solutions, and reliable after-sales support, making them the preferred route for large residential projects and institutional buyers.
The E-Commerce channel is expected to grow at the fastest CAGR from 2026 to 2033, supported by rising digital adoption, transparent pricing, doorstep delivery, easy comparison of pump specifications, and growing trust in online platforms. Increasing sales from marketplaces such as Amazon, Flipkart, and brand-owned online stores are driving rapid penetration among homeowners seeking convenient, self-service purchasing options. Improved online product information, reviews, and installation support videos further strengthen e-commerce growth.
- By End User
The domestic booster pump market is segmented into Residential Homes/Flats, Sea Farm Houses/Cottages/Guest Houses, and Others. The Residential Homes/Flats segment dominated the market with an estimated 67.8% share in 2025, supported by rising urbanization, growing multi-storey housing construction, and increasing consumer demand for consistent water pressure in bathrooms, kitchens, and household appliances. Booster pumps are widely used in apartments, gated societies, and standalone homes to ensure reliable water flow from overhead tanks, municipal supply lines, and storage units.
The Sea Farm Houses/Cottages/Guest Houses segment is projected to grow at the fastest CAGR from 2026 to 2033, driven by increasing development of vacation properties, farm stays, and premium hospitality units in coastal and semi-urban regions. Higher water-pressure requirements, use of multiple fixtures, and demand for efficient pumps resistant to corrosion and saline water exposure are supporting rapid adoption. Growth in tourism, holiday rentals, and remote living trends further accelerates segment expansion.
Which Region Holds the Largest Share of the Domestic Booster Pump Market?
- China dominated the Asia-Pacific domestic booster pump market with a revenue share of 41.87% in 2025, driven by strong residential construction, rapid urban infrastructure development, and rising installation of domestic pressure-boosting systems across apartments, villas, and multi-storey housing projects. Increasing demand for reliable water pressure in densely populated cities, coupled with expanding adoption of energy-efficient and smart water management technologies, supports large-scale deployment. Growing investment in high-rise housing, renovation activities, and municipal water distribution upgrades continues to accelerate demand for domestic booster pumps across major Chinese provinces
- Domestic pump manufacturers in China are increasingly focusing on smart booster pumps, variable-speed motors, corrosion-resistant materials, and IoT-enabled pressure monitoring systems to support modern household requirements. Strong government emphasis on urban modernization, water conservation, and efficient residential plumbing systems continues to reinforce China’s regional leadership in the market
- Rising adoption of automated water supply systems, expanding residential construction, and continuous product innovation by domestic and global brands further strengthen China’s dominance across the Asia-Pacific region
Japan Domestic Booster Pump Market Insight
Japan demonstrates steady market growth driven by its strict plumbing standards, energy-efficiency norms, and high reliance on premium-quality residential pump systems. Domestic booster pumps are widely used in multi-storey homes, compact urban apartments, and modern residential complexes requiring stable and noise-free water pressure. High consumer preference for durable, quiet, and technologically advanced pumps—especially those featuring variable-speed drives and stainless-steel construction—continues to boost adoption.
India Domestic Booster Pump Market Insight
India is projected to register the fastest CAGR of 7.58% from 2026 to 2033, driven by rapid housing construction, expanding urban populations, and widespread installation of pressure-boosting systems in high-rise apartments and gated communities. Growing awareness of consistent water pressure needs—especially in regions with irregular municipal supply—continues to fuel strong household adoption. Rising demand for energy-efficient pumps, low-noise motors, and automated pressure control systems further accelerates market penetration.
Which are the Top Companies in Domestic Booster Pump Market?
The domestic booster pump industry is primarily led by well-established companies, including:
- Grundfos Holding A/S (Denmark)
- Xylem Inc. (U.S.)
- KSB SE & Co. KGaA (Germany)
- Pentair plc (U.S.)
- ABB Ltd. (Sweden)
- DAB Pumps Spa (Italy)
- Franklin Electric (U.S.)
- Alfred Kärcher SE & Co. KG (Germany)
- WILO SE (Germany)
- Davey Water Products (Australia)
- EDDY Pump (U.S.)
- Eaton (U.S.)
- CNP India Private Limited (India)
- Torontech Inc. (Canada)
- Injung Tech Co., Ltd (South Korea)
What are the Recent Developments in Global Domestic Booster Pump Market?
- In January 2025, Grundfos introduced a new solar-enabled booster pump series that lowers energy consumption by 35% and is designed for off-grid households in emerging economies, aligning with the rising global focus on sustainability. This development is expected to strengthen the company’s position in renewable-compatible pumping solutions
- In October 2024, Xylem Inc. broadened its domestic pump portfolio with AI-powered pressure optimization features to improve reliability for multi-family residences after successful trials in the U.S., supporting the growing adoption of intelligent home water systems. This advancement is such asly to accelerate Xylem’s footprint in smart, automated pumping technologies
- In March 2024, Pentair Plc. acquired a strategic supplier to enhance its variable speed pump capabilities, aiming to secure an additional 10% market share in energy-efficient residential water applications, driven by rising consumer preference for sustainable technologies. This move is set to reinforce Pentair’s competitiveness in the high-efficiency pump segment
SKU-

- Interactive Data Analysis Dashboard
- Company Analysis Dashboard for high growth potential opportunities
- Research Analyst Access for customization & queries
- Competitor Analysis with Interactive dashboard
- Latest News, Updates & Trend analysis
- Harness the Power of Benchmark Analysis for Comprehensive Competitor Tracking
Data collection and base year analysis are done using data collection modules with large sample sizes. The stage includes obtaining market information or related data through various sources and strategies. It includes examining and planning all the data acquired from the past in advance. It likewise envelops the examination of information inconsistencies seen across different information sources. The market data is analysed and estimated using market statistical and coherent models. Also, market share analysis and key trend analysis are the major success factors in the market report. To know more, please request an analyst call or drop down your inquiry.
The key research methodology used by DBMR research team is data triangulation which involves data mining, analysis of the impact of data variables on the market and primary (industry expert) validation. Data models include Vendor Positioning Grid, Market Time Line Analysis, Market Overview and Guide, Company Positioning Grid, Patent Analysis, Pricing Analysis, Company Market Share Analysis, Standards of Measurement, Global versus Regional and Vendor Share Analysis. To know more about the research methodology, drop in an inquiry to speak to our industry experts.
Data Bridge Market Research is a leader in advanced formative research. We take pride in servicing our existing and new customers with data and analysis that match and suits their goal. The report can be customized to include price trend analysis of target brands understanding the market for additional countries (ask for the list of countries), clinical trial results data, literature review, refurbished market and product base analysis. Market analysis of target competitors can be analyzed from technology-based analysis to market portfolio strategies. We can add as many competitors that you require data about in the format and data style you are looking for. Our team of analysts can also provide you data in crude raw excel files pivot tables (Fact book) or can assist you in creating presentations from the data sets available in the report.


