
Asia Pacific Drug Device Combination Market
Market Size in USD Billion
 USD
2.65 Billion
USD
5.39 Billion
2025
2033
USD
2.65 Billion
USD
5.39 Billion
2025
2033
| 2026 - 2033 | |
| USD 2.65 Billion | |
| USD 5.39 Billion | |
| % | |
|
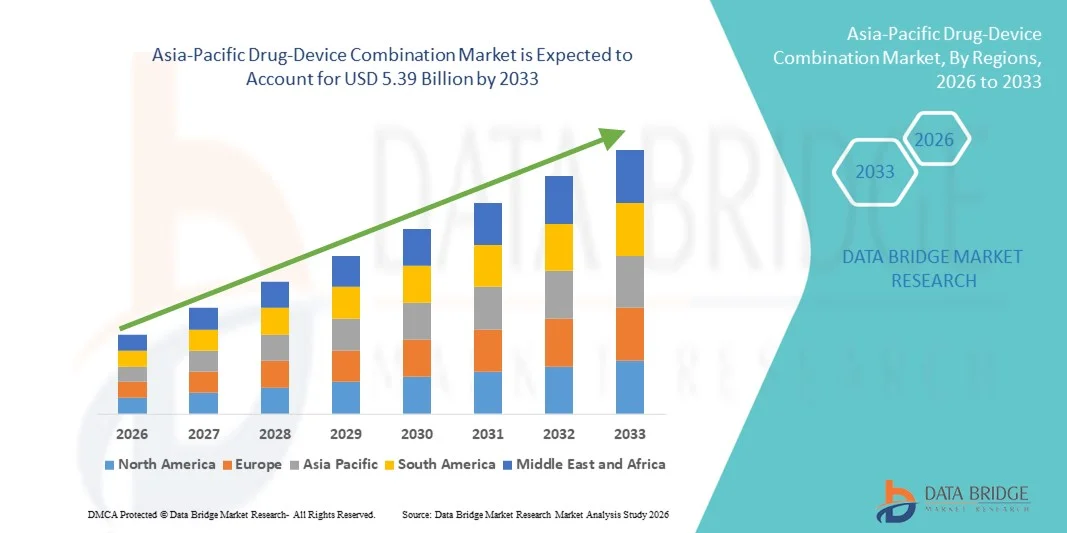
Asia-Pacific Drug-Device Combination Market Size
- The Asia-Pacific drug-device combination market size was valued at USD 2.65 billion in 2025 and is expected to reach USD 5.39 billion by 2033, at a CAGR of 9.3% during the forecast period
- The market growth is largely fueled by increasing healthcare expenditure, expanding access to advanced therapies and drug delivery solutions, and rapid adoption of integrated drug‑device products such as auto‑injectors, smart inhalers, and digital pills across both clinical and home care settings
- Furthermore, rising prevalence of chronic diseases, supportive government initiatives to modernize healthcare infrastructure, and growing consumer demand for patient‑centric, efficient, and easy‑to‑use therapeutic solutions are establishing drug‑device combinations as preferred treatment mechanisms in the region. These converging factors are accelerating the uptake of combination products, thereby significantly boosting the industry’s growth during the forecast period
Asia-Pacific Drug-Device Combination Market Analysis
- Drug‑device combination products, integrating pharmaceuticals with delivery devices such as auto‑injectors, smart inhalers, and digital pills, are increasingly vital components of modern healthcare management in both clinical and home care settings due to their enhanced patient adherence, precision dosing, and seamless integration with digital health ecosystems
- The escalating demand for drug‑device combination products is primarily fueled by the growing prevalence of chronic diseases, rising patient awareness, and a preference for convenient, safe, and efficient therapeutic solutions that improve treatment outcomes
- Japan dominated the Asia‑Pacific drug‑device combination market with the largest revenue shares of 32.5% in 2025, characterized by advanced healthcare infrastructure, high healthcare spending, and a strong presence of key industry players
- India is expected to be the fastest growing regions in the Asia‑Pacific drug‑device combination market during the forecast period due to increasing healthcare access, expanding middle-class populations, and rising healthcare expenditure
- Auto-injector segment dominated the Asia‑Pacific drug‑device combination market with a market share of 38.9% in 2025, driven by its established reputation for safety, ease of use, and suitability for both chronic and emergency therapies
Report Scope and Asia-Pacific Drug-Device Combination Market Segmentation
|
Attributes |
Asia-Pacific Drug-Device Combination Key Market Insights |
|
Segments Covered |
|
|
Countries Covered |
Asia-Pacific
|
|
Key Market Players |
|
|
Market Opportunities |
|
|
Value Added Data Infosets |
In addition to the insights on market scenarios such as market value, growth rate, segmentation, geographical coverage, and major players, the market reports curated by the Data Bridge Market Research also include in-depth expert analysis, patient epidemiology, pipeline analysis, pricing analysis, and regulatory framework |
Asia-Pacific Drug-Device Combination Market Trends
“Digital and Connected Drug Delivery Solutions”
- A significant and accelerating trend in the Asia‑Pacific drug‑device combination market is the integration of digital health technologies, including smart inhalers, connected auto‑injectors, and app-based monitoring systems, which enhance patient adherence and treatment precision
- For instance, Propeller Health’s smart inhaler in Japan syncs with mobile applications to provide real-time medication reminders and adherence tracking, allowing patients to manage their chronic respiratory conditions more effectively. Similarly, Ypsomed’s connected auto-injector devices in China enable remote dose monitoring and clinician feedback
- Digital integration enables features such as automated dosage reminders, adherence analytics, and personalized alerts based on patient behavior. For instance, some Sanofi smart pen devices track injection history and provide intelligent reminders, while connected inhalers can notify patients and caregivers if a dose is missed
- The seamless integration of drug-device products with mobile apps and digital health platforms facilitates centralized disease management, enabling healthcare providers to monitor multiple patients remotely and adjust therapy plans efficiently
- This trend toward intelligent, connected, and patient-centric drug-device solutions is reshaping treatment expectations in the Asia-Pacific region. Consequently, companies such as BD and Ypsomed are developing smart injectors and inhalers with features such as dose tracking, real-time alerts, and app connectivity
- The demand for drug-device combinations with digital and connected functionalities is growing rapidly across both hospital and home care settings, as patients increasingly prioritize convenience, safety, and real-time health insights
- Collaborations between device manufacturers and telemedicine platforms are expanding, allowing real-time remote monitoring and virtual consultation, which is enhancing the overall value proposition of drug-device combinations
Asia-Pacific Drug-Device Combination Market Dynamics
Driver
“Rising Chronic Disease Prevalence and Healthcare Modernization”
- The increasing prevalence of chronic diseases such as diabetes, asthma, and rheumatoid arthritis, coupled with expanding healthcare infrastructure, is a major driver for the adoption of drug-device combination products
- For instance, in March 2025, BD launched an integrated insulin delivery and monitoring solution in India, aiming to improve adherence and outcomes for diabetic patients. Such innovations by key companies are expected to drive market growth in the forecast period
- As patients and healthcare providers seek safer, more precise, and convenient therapeutic options, drug-device products offer advantages such as accurate dosing, real-time monitoring, and simplified administration, providing a compelling alternative to traditional delivery methods
- Furthermore, the increasing popularity of home-based therapies and patient-centric care models is making drug-device combinations essential in treatment plans, enabling better disease management outside clinical settings
- The convenience of self-administration, digital adherence tracking, and integration with telemedicine platforms are key factors propelling the adoption of drug-device combination products in hospitals, clinics, and home care settings
- Government initiatives supporting healthcare digitalization and reimbursement programs for advanced therapies are creating favorable conditions for rapid adoption of drug-device combination products
- Rising investments by pharmaceutical and medical device companies in R&D for innovative, patient-friendly delivery solutions are further accelerating market expansion across the Asia-Pacific region
Restraint/Challenge
“Regulatory Hurdles and Device Safety Concerns”
- Concerns regarding stringent regulatory requirements and safety standards for drug-device combinations pose a significant challenge to broader market adoption, as these products must comply with both pharmaceutical and medical device regulations
- For instance, reports of device malfunctions or dosing errors in connected auto-injectors have made some healthcare providers cautious about widespread adoption in Asia-Pacific markets
- Addressing these regulatory and safety concerns through rigorous clinical testing, compliance with local authorities, and robust device design is crucial for building trust. Companies such as Ypsomed and Sanofi emphasize device reliability and regulatory adherence in their product development and marketing strategies
- In addition, relatively high costs of advanced drug-device products compared to standard therapies can be a barrier in price-sensitive markets, particularly in developing countries or for lower-income patients. While basic injectors or inhalers are affordable, advanced smart devices with connected features often carry premium pricing
- Overcoming these challenges through stringent safety standards, regulatory compliance, patient education, and cost-optimized solutions will be vital for sustained growth in the Asia-Pacific drug-device combination market
- Limited interoperability with existing healthcare IT systems and digital platforms can restrict data sharing and integration, posing a challenge for widespread adoption of connected drug-device products.
- Variability in regulatory frameworks across Asia-Pacific countries increases approval timelines and operational complexity, requiring companies to navigate multiple compliance pathways to successfully launch products in different markets
Asia-Pacific Drug-Device Combination Market Scope
The market is segmented on the basis of product, application type, end user, and distribution channel.
- By Product
On the basis of product, the Asia‑Pacific drug-device combination market is segmented into auto-injector, microneedle patch, digital pill, smart inhaler, drug delivery hydrogels, drug-eluting lens, and others. The Auto-Injector segment dominated the market with the largest revenue share of 38.9% in 2025, driven by its widespread use in chronic diseases such as diabetes and rheumatoid arthritis. Auto-injectors are preferred for their ease of self-administration, precise dosing, and ability to reduce medication errors, particularly in home care settings. Hospitals and clinics also favor auto-injectors for emergency therapies due to their reliability and convenience. The segment’s dominance is further reinforced by continuous innovations such as connected auto-injectors with digital adherence tracking and mobile app integration. Growing patient awareness and rising prevalence of chronic conditions in the Asia-Pacific region are supporting steady demand for auto-injectors.
The Microneedle Patch segment is expected to witness the fastest growth at a CAGR of 22.1% from 2026 to 2033, fueled by rising interest in painless, minimally invasive drug delivery technologies. Microneedle patches offer advantages such as improved patient compliance, reduced risk of needle-stick injuries, and suitability for vaccine administration. Increasing R&D investments and pilot programs in countries such as Japan, China, and India are accelerating adoption. These patches are also gaining traction in outpatient and home care settings, driven by convenience and the ability to self-administer without professional supervision. Regulatory approvals and growing awareness about alternative drug delivery methods further support this rapid growth.
- By Application Type
On the basis of application type, the market is segmented into orthopedic diseases, respiratory diseases, diabetes, oncology, cardiovascular diseases, and others. The Diabetes segment dominated the market with the largest revenue share of 35.5% in 2025, driven by the increasing prevalence of diabetes across the Asia-Pacific region. Auto-injectors and smart insulin pens are widely used for efficient insulin delivery, providing accurate dosing and adherence monitoring. Hospitals and clinics prioritize these devices to reduce complications and improve patient outcomes. Home care adoption is also rising due to convenience and ease of self-administration. Continuous innovation in smart delivery systems, such as connected pens that sync with apps for real-time monitoring, further strengthens this segment. High patient awareness campaigns and government healthcare initiatives are supporting the dominance of diabetes-related drug-device combinations.
The Respiratory Diseases segment is expected to witness the fastest growth at a CAGR of 21.5% from 2026 to 2033, driven by the increasing adoption of smart inhalers and digital respiratory monitoring systems. These devices improve adherence, provide usage analytics, and allow remote patient monitoring, which is particularly valuable in urban populations with rising asthma and COPD cases. The segment benefits from technological advancements in sensor-enabled inhalers and app-based tracking. Home care and telemedicine integration enhance convenience for patients, while growing awareness of respiratory health management drives adoption across clinics and hospitals. Regulatory support for innovative respiratory therapies further accelerates growth.
- By End User
On the basis of end user, the market is segmented into clinics, hospitals, home care settings, ambulatory care centers, and others. The Hospitals segment dominated the market with the largest revenue share of 41.8% in 2025, driven by high adoption of drug-device combination products for inpatient therapies and chronic disease management. Hospitals prioritize devices that ensure precise dosing, reduce medication errors, and support patient monitoring. Advanced drug-device systems such as connected auto-injectors and smart inhalers are increasingly deployed in hospital settings for both acute and long-term treatments. The dominance is further reinforced by government and private hospital initiatives to implement patient-centric care models. Hospitals also benefit from integrated digital platforms that connect devices with electronic health records for better therapy tracking.
The Home Care Settings segment is expected to witness the fastest growth at a CAGR of 23.0% from 2026 to 2033, fueled by the rising trend of self-administration and telehealth integration. Patients prefer devices that enable convenient, safe, and accurate medication delivery at home, reducing hospital visits and associated costs. Connected auto-injectors, smart inhalers, and microneedle patches are gaining popularity in this segment. Growing awareness of chronic disease management and increasing availability of home care services accelerate adoption. The segment is also supported by reimbursement policies in certain countries, encouraging patients to use advanced drug-device solutions at home.
- By Distribution Channel
On the basis of distribution channel, the market is segmented into direct tender, retail sales, and others. The Direct Tender segment dominated the market with the largest revenue share of 39.4% in 2025, driven by large-scale hospital procurement and government tenders for public healthcare programs. Direct tender ensures cost-effectiveness, bulk supply, and guaranteed quality for institutional buyers. Hospitals and clinics often prefer this channel for high-value drug-device products such as auto-injectors and smart inhalers. Government programs for diabetes, respiratory diseases, and oncology therapies contribute significantly to the dominance of this channel. Key manufacturers maintain long-term contracts with public and private healthcare institutions, strengthening their market presence.
The Retail Sales segment is expected to witness the fastest growth at a CAGR of 22.8% from 2026 to 2033, fueled by increasing availability of drug-device products through pharmacies, e-commerce platforms, and home delivery services. Retail access enables patients to procure devices for self-administration conveniently. Digital marketing, patient awareness campaigns, and partnerships with retail pharmacies enhance adoption. Growth in home care and outpatient treatments further drives retail distribution. Easy access, convenience, and increased patient awareness of advanced drug-device therapies are key factors supporting rapid growth in this channel.
Asia-Pacific Drug-Device Combination Market Regional Analysis
- Japan dominated the Asia‑Pacific drug‑device combination market with the largest revenue shares of 32.5% in 2025, characterized by advanced healthcare infrastructure, high healthcare spending, and a strong presence of key industry players
- Healthcare providers and patients in these countries highly value the convenience, precise dosing, and real-time monitoring offered by connected auto-injectors, smart inhalers, and digital pills, which improve treatment adherence and outcomes
- This widespread adoption is further supported by strong government initiatives promoting healthcare modernization, high healthcare spending, and the presence of key pharmaceutical and medical device companies, establishing drug-device combination products as essential solutions in both hospital and home care settings
The Japan Drug‑Device Combination Market Insight
The Japan market is gaining momentum due to the country’s advanced healthcare infrastructure, rapid urbanization, and increasing demand for convenience in chronic disease management. Japanese healthcare providers emphasize accuracy, safety, and patient adherence, fueling the adoption of smart injectors, connected inhalers, and microneedle patches. The integration of these devices with digital health platforms and remote monitoring tools is further driving growth. In addition, Japan’s aging population is expected to spur demand for easy-to-use, patient-friendly drug-device solutions in both residential and clinical settings.
China Drug‑Device Combination Market Insight
The China market accounted for the largest revenue share in Asia-Pacific in 2025, supported by the country’s expanding healthcare infrastructure, high patient population, and rising prevalence of chronic conditions. The adoption of digital and connected drug-device products is growing rapidly across hospitals, clinics, and home care settings. Government initiatives to improve chronic disease management, along with strong local manufacturing capabilities for advanced drug delivery systems, are key factors propelling the market. Increasing patient awareness and telemedicine adoption also enhance the demand for smart drug-device solutions.
India Drug‑Device Combination Market Insight
The India market is witnessing strong growth due to rising healthcare awareness, an expanding middle class, and increasing access to innovative therapies. The country is becoming a key market for auto-injectors, smart inhalers, and digital pill technologies, particularly for home care and outpatient settings. Government programs promoting affordable healthcare and digital health integration are supporting adoption. Moreover, increasing investments from domestic and multinational companies in R&D and localized manufacturing are further boosting accessibility, making India one of the fastest-growing drug-device combination markets in APAC.
South Korea Drug‑Device Combination Market Insight
The South Korea market is expected to grow at a substantial CAGR during the forecast period, driven by the country’s technologically advanced healthcare infrastructure, high digital literacy, and growing adoption of smart medical devices. South Korean patients and healthcare providers are increasingly leveraging connected auto-injectors, smart inhalers, and digital pills for chronic disease management and outpatient care. Integration of these devices with mobile health apps and telemedicine platforms is enhancing patient adherence and clinical monitoring. Government support for healthcare innovation and reimbursement policies for advanced therapies further accelerate market adoption. In addition, collaborations between domestic device manufacturers and multinational pharmaceutical companies are fostering the development of innovative, patient-centric drug-device solutions.
Asia-Pacific Drug-Device Combination Market Share
The Asia-Pacific Drug-Device Combination industry is primarily led by well-established companies, including:
- Abbott (U.S.)
- BD (U.S.)
- Boston Scientific Corporation (U.S.)
- Medtronic (Ireland)
- Novartis AG (Switzerland)
- Novo Nordisk A/S (Denmark)
- Sanofi (France)
- Eli Lilly and Company (U.S.)
- GSK plc (U.K.)
- Teva Pharmaceutical Industries Ltd. (Israel)
- Terumo Corporation (Japan)
- West Pharmaceutical Services, Inc. (U.S.)
- Bayer AG (Germany)
- Merck KGaA (Germany)
- B. Braun SE (Germany)
- WuXi AppTec Co., Ltd. (China)
- Meril Life Sciences (India)
- Dr. Reddy’s Laboratories Ltd. (India)
What are the Recent Developments in Asia-Pacific Drug-Device Combination Market?
- In December 2025, Cipla Limited launched Afrezza® (insulin human) Inhalation Powder in India, introducing a needle‑free, rapid‑acting inhaled insulin delivered via an inhaler device to support easier diabetes management and improve patient adherence by offering a user‑friendly alternative to injections for adults with type 1 and type 2 diabetes
- In July 2025, Terumo Corporation launched the Immucise Intradermal Injection System in the Asia‑Pacific region, a new method for delivering vaccines and drugs intradermally that enhances convenience and precision for drug‑device delivery in clinical and public health applications
- In June 2025, Ypsomed AG opened its first dedicated production site in China, aimed at producing up to 100 million injection devices per year, significantly strengthening local manufacturing capacity for self‑injectable drug‑device products in the Asia‑Pacific region
- In April 2025, the injectable facility of Lupin in Nagpur, India received a U.S. FDA Establishment Inspection Report (EIR) specifically for drug‑medical device combination products, reinforcing compliance and quality for combination therapies manufactured in the region for global markets
- In October 2024, BD and Ypsomed announced a collaboration to advance self‑injection solutions for high‑viscosity biologic drugs, addressing delivery challenges for complex therapies and supporting broader adoption of advanced auto‑injector drug‑device combinations in Asia‑Pacific healthcare systems
SKU-

- Interactive Data Analysis Dashboard
- Company Analysis Dashboard for high growth potential opportunities
- Research Analyst Access for customization & queries
- Competitor Analysis with Interactive dashboard
- Latest News, Updates & Trend analysis
- Harness the Power of Benchmark Analysis for Comprehensive Competitor Tracking
Data collection and base year analysis are done using data collection modules with large sample sizes. The stage includes obtaining market information or related data through various sources and strategies. It includes examining and planning all the data acquired from the past in advance. It likewise envelops the examination of information inconsistencies seen across different information sources. The market data is analysed and estimated using market statistical and coherent models. Also, market share analysis and key trend analysis are the major success factors in the market report. To know more, please request an analyst call or drop down your inquiry.
The key research methodology used by DBMR research team is data triangulation which involves data mining, analysis of the impact of data variables on the market and primary (industry expert) validation. Data models include Vendor Positioning Grid, Market Time Line Analysis, Market Overview and Guide, Company Positioning Grid, Patent Analysis, Pricing Analysis, Company Market Share Analysis, Standards of Measurement, Global versus Regional and Vendor Share Analysis. To know more about the research methodology, drop in an inquiry to speak to our industry experts.
Data Bridge Market Research is a leader in advanced formative research. We take pride in servicing our existing and new customers with data and analysis that match and suits their goal. The report can be customized to include price trend analysis of target brands understanding the market for additional countries (ask for the list of countries), clinical trial results data, literature review, refurbished market and product base analysis. Market analysis of target competitors can be analyzed from technology-based analysis to market portfolio strategies. We can add as many competitors that you require data about in the format and data style you are looking for. Our team of analysts can also provide you data in crude raw excel files pivot tables (Fact book) or can assist you in creating presentations from the data sets available in the report.


