
Asia Pacific Food Micronized Salt Market
Market Size in USD Billion
 USD
1.03 Billion
USD
1.36 Billion
2025
2033
USD
1.03 Billion
USD
1.36 Billion
2025
2033
| 2026 - 2033 | |
| USD 1.03 Billion | |
| USD 1.36 Billion | |
| % | |
|
Asia- Pacific Food Micronized Salt Market Size
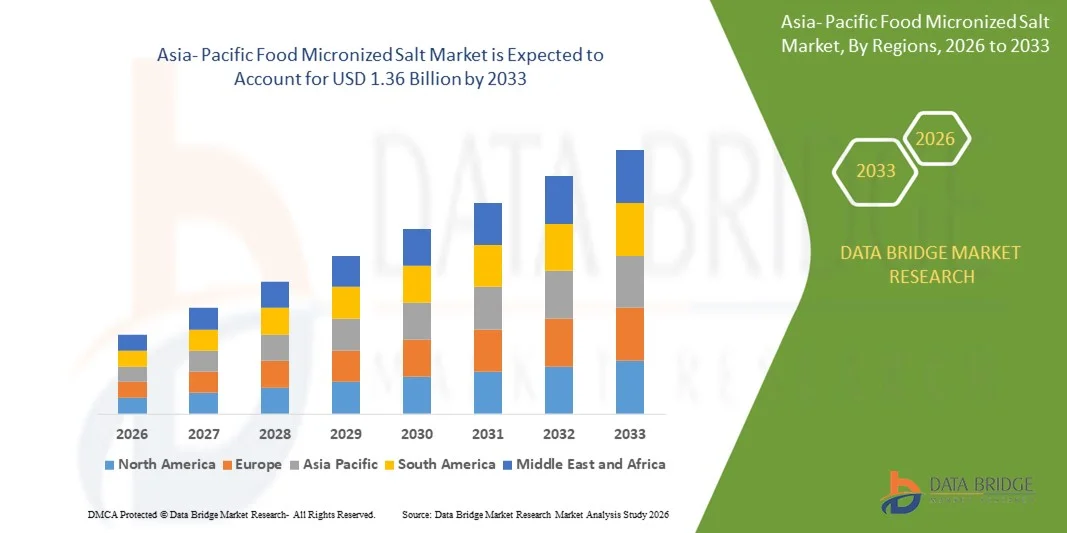
- The Asia- Pacific food micronized salt market size was valued at USD 1.03 billion in 2025 and is expected to reach USD 1.36 billion by 2033, at a CAGR of 3.5% during the forecast period
- The market growth is largely fueled by the rising demand for processed and packaged food products, where micronized salt is widely used to ensure uniform dispersion, controlled salt content, and consistent taste profiles across large-scale production. In addition, increasing focus on product quality, texture enhancement, and efficient seasoning in industrial food processing is accelerating the adoption of micronized salt across multiple food applications
- Furthermore, growing consumer preference for convenience foods, clean-label formulations, and portion-controlled seasoning is encouraging food manufacturers to adopt finely milled salt solutions. These converging factors are driving higher utilization of food micronized salt in bakery, confectionery, dairy, and prepared meals, thereby significantly boosting overall market growth
Asia- Pacific Food Micronized Salt Market Analysis
- Food micronized salt, characterized by its fine particle size and rapid solubility, plays a critical role in modern food processing by improving flavor consistency, processing efficiency, and product uniformity across both solid and liquid formulations. Its application spans a wide range of food categories, supporting manufacturers in meeting quality standards and large-volume production requirements
- The increasing demand for food micronized salt is primarily driven by the expansion of the global food processing industry, rising consumption of ready-to-eat and convenience foods, and the need for precise salt distribution to meet regulatory and health-related sodium control guidelines
- China dominated the food micronized salt market in 2025, due to its expansive food processing industry, high consumption of packaged and convenience foods, and strong demand for consistent seasoning solutions across large-scale manufacturing
- India is expected to be the fastest growing country in the food micronized salt market during the forecast period due to rapid expansion of the processed food industry and rising consumption of packaged and ready-to-eat foods
- Purity 98% - 99.5% segment dominated the market with a market share of 58.3% in 2025, due to its widespread use across a broad range of food processing applications and cost-effectiveness. This grade is preferred by manufacturers for its consistent quality, ease of handling, and suitability in standard food formulations. The segment’s dominance is also supported by its compatibility with various micronization techniques that enhance solubility and texture in end products. Food producers often choose this grade to maintain a balance between performance and operational efficiency. Its widespread adoption in processed foods, bakery items, and beverages further reinforces its leading position
Report Scope and Food Micronized Salt Market Segmentation
|
Attributes |
Food Micronized Salt Key Market Insights |
|
Segments Covered |
|
|
Countries Covered |
Asia-Pacific
|
|
Key Market Players |
|
|
Market Opportunities |
|
|
Value Added Data Infosets |
In addition to the insights on market scenarios such as market value, growth rate, segmentation, geographical coverage, and major players, the market reports curated by the Data Bridge Market Research also include in-depth expert analysis, pricing analysis, brand share analysis, consumer survey, demography analysis, supply chain analysis, value chain analysis, raw material/consumables overview, vendor selection criteria, PESTLE Analysis, Porter Analysis, and regulatory framework. |
Asia- Pacific Food Micronized Salt Market Trends
Rising Adoption of Micronized Ingredients for Consistent Flavor and Texture
- A major trend in the food micronized salt market is the increasing adoption of finely milled salt to achieve uniform flavor distribution and texture consistency across industrial food production. Food manufacturers are increasingly prioritizing micronized salt as it dissolves rapidly and blends evenly, supporting precise formulation control in large-scale processing environments
- For instance, companies such as Cargill Incorporated supply micronized salt solutions to food processors seeking improved solubility and consistent seasoning in bakery, confectionery, and ready-meal applications. These products help manufacturers maintain standardized taste profiles while optimizing processing efficiency
- The demand for micronized salt is rising in bakery and confectionery production where controlled salt dispersion is essential for dough performance, shelf stability, and flavor balance. This trend supports the production of high-volume baked goods while ensuring consistent product quality across batches
- In dairy and dairy alternative formulations, micronized salt is increasingly used to enhance solubility and prevent graininess in liquid and semi-solid products. This supports the growing consumption of processed dairy items and plant-based alternatives that require smooth texture and stable taste
- Food processors focusing on portion control and reduced sodium formulations are also adopting micronized salt to achieve better salt perception with lower quantities. This trend aligns with industry efforts to meet regulatory guidelines and evolving consumer preferences
- Overall, the rising use of micronized ingredients reflects a broader shift toward precision food processing, where consistency, efficiency, and controlled flavor delivery are becoming critical differentiators in competitive food markets
Asia- Pacific Food Micronized Salt Market Dynamics
Driver
Growing Demand for Processed, Packaged, and Convenience Food Products
- The expanding consumption of processed, packaged, and convenience foods is a key driver for the food micronized salt market, as manufacturers require reliable ingredients that ensure uniform seasoning and efficient production. Micronized salt supports high-speed processing lines by dissolving quickly and distributing evenly in complex formulations
- For instance, ADM supplies food-grade salt ingredients to manufacturers producing packaged meals, snacks, and bakery products, where consistent taste and quality are critical. The use of micronized salt helps these producers maintain standardization across large production volumes
- The growth of urban populations and changing lifestyles has increased reliance on ready-to-eat and ready-to-cook food products, directly boosting demand for advanced seasoning solutions. Micronized salt enables manufacturers to enhance flavor while maintaining operational efficiency in mass production
- Food processors are increasingly scaling operations to meet global demand, which requires ingredients that perform consistently across diverse processing conditions. Micronized salt supports this scalability by improving blending accuracy and reducing formulation variability
- The rising penetration of private-label and branded packaged foods is further strengthening this driver, as companies compete on taste consistency and product reliability. This sustained demand reinforces the role of micronized salt as a foundational ingredient in modern food processing
Restraint/Challenge
Volatility in Raw Material Prices and Energy Costs
- The food micronized salt market faces challenges due to fluctuations in raw salt prices and rising energy costs associated with grinding and micronization processes. These cost variations can impact production margins and create pricing pressure for manufacturers
- For instance, companies such as Tata Chemicals operate large-scale salt processing facilities where energy-intensive milling and purification processes are required to produce micronized grades. Increases in energy and transportation costs directly affect overall production economics
- Maintaining consistent particle size and purity levels requires advanced processing equipment and strict quality control, which further elevates operational expenses. These factors make it difficult for manufacturers to absorb cost increases without affecting product pricing
- Supply chain disruptions and variability in raw salt availability can also impact production continuity, particularly for high-purity micronized grades used in sensitive food applications. This adds complexity to inventory planning and cost management
- As competition intensifies, manufacturers must balance cost efficiency with quality expectations, which remains a key challenge for market participants. These constraints may limit short-term expansion for smaller
Asia- Pacific Food Micronized Salt Market Scope
The market is segmented on the basis of grade and application.
- By Grade
On the basis of grade, the food micronized salt market is segmented into Purity 98%–99.5% and Purity Above 99.5%. The Purity 98%–99.5% segment dominated the market with the largest revenue share of 58.3% in 2025, driven by its widespread use across a broad range of food processing applications and cost-effectiveness. This grade is preferred by manufacturers for its consistent quality, ease of handling, and suitability in standard food formulations. The segment’s dominance is also supported by its compatibility with various micronization techniques that enhance solubility and texture in end products. Food producers often choose this grade to maintain a balance between performance and operational efficiency. Its widespread adoption in processed foods, bakery items, and beverages further reinforces its leading position.
The Purity Above 99.5% segment is anticipated to witness the fastest growth rate from 2026 to 2033, fueled by rising demand in premium and functional food applications where higher purity is critical. For instance, companies such as Morton Salt are increasingly supplying high-purity micronized salt for specialized confectionery and dairy applications. This grade offers superior solubility, minimal impurities, and enhanced flavor consistency, which is essential for high-end and health-focused food products. The growing consumer preference for clean-label and minimally processed foods also drives adoption of this grade. Its application in sensitive formulations such as chocolate, functional beverages, and dietary supplements further contributes to its rapid market expansion.
- By Application
On the basis of application, the food micronized salt market is segmented into Chocolate & Confectionery, Bakery, Functional Food, Dairy Products, Dairy Alternatives, Processed Meat, Poultry and Seafood, Canned/Preserved Fruits & Vegetables, Prepared Meals, Beverages, and Others. The Bakery segment dominated the market with the largest revenue share in 2025, driven by the high volume of bakery production and the need for uniform salt dispersion to maintain product texture and taste. Salt in micronized form allows precise control over salt levels in dough and batters, enhancing quality consistency. Its widespread use in commercial bakeries and large-scale production facilities further solidifies its dominance. Manufacturers prioritize micronized salt in bakery applications due to its rapid solubility and ease of integration in automated processing lines. The segment also benefits from ongoing product innovations in baked goods and the growing bakery consumption across urban populations.
The Chocolate & Confectionery segment is expected to witness the fastest growth rate from 2026 to 2033, driven by the increasing demand for high-quality chocolates and confectionery products with precise flavor profiles. For instance, Barry Callebaut is adopting micronized salt in premium chocolate applications to enhance taste and mouthfeel without affecting texture. Micronized salt ensures even distribution, better solubility, and controlled saltiness in delicate confections. The rising popularity of gourmet and artisanal chocolates, as well as functional confectionery products with added health benefits, contributes to rapid adoption. The segment’s growth is further supported by expanding global chocolate consumption and rising consumer awareness regarding product quality and taste enhancement.
Asia- Pacific Food Micronized Salt Market Regional Analysis
- China dominated the food micronized salt market with the largest revenue share in 2025, driven by its expansive food processing industry, high consumption of packaged and convenience foods, and strong demand for consistent seasoning solutions across large-scale manufacturing
- Robust growth in bakery, confectionery, dairy, and ready-meal production, combined with ongoing investments in modern food processing infrastructure, continues to reinforce China’s leadership in the regional market
- The presence of major domestic salt producers, integration with global food supply chains, and increasing emphasis on food quality and standardization further consolidate China’s dominant position during the forecast period. Expanding urban consumption and rising adoption of precision ingredients in industrial food processing strengthen market penetration across the country
Japan Food Micronized Salt Market Insight
The Japan market is anticipated to grow steadily from 2026 to 2033, supported by its mature food processing sector and strong focus on quality, consistency, and regulatory compliance. Japanese food manufacturers increasingly utilize micronized salt to achieve precise flavor control and texture uniformity in premium bakery, confectionery, and processed food products. The demand for high-purity and finely milled ingredients aligns with the country’s emphasis on product refinement and consumer expectations for superior taste. Continuous technological upgrades and adherence to strict food safety standards reinforce Japan’s stable growth outlook and strong regional positioning.
India Food Micronized Salt Market Insight
India is projected to register the fastest CAGR in the Asia Pacific food micronized salt market during 2026–2033, fueled by rapid expansion of the processed food industry and rising consumption of packaged and ready-to-eat foods. Increasing urbanization, changing dietary habits, and growth of organized food manufacturing are accelerating adoption of standardized ingredients such as micronized salt. Demand is particularly strong across bakery, snacks, dairy, and prepared meals as manufacturers scale production and focus on consistency. Government support for food processing infrastructure and expanding distribution networks further position India as the fastest-growing market in the region.
Asia- Pacific Food Micronized Salt Market Share
The food micronized salt industry is primarily led by well-established companies, including:
- DuPont (U.S.)
- ADM (U.S.)
- Tate & Lyle (U.K.)
- Ingredion Incorporated (U.S.)
- Cargill Incorporated (U.S.)
- Roquette Frères (France)
- PureCircle Ltd (U.S.)
- MacAndrews & Forbes Holdings Inc. (U.S.)
- JK Sucralose Inc. (China)
- Ajinomoto Co. (Japan)
- Südzucker AG (Germany)
- Guilin Layn Natural Ingredients Corp. (China)
- Zhucheng Haotian Pharm Co., Ltd. (China)
- HSWT France SAS (France)
Latest Developments in Asia- Pacific Food Micronized Salt Market
- In February 2025 Cargill announced a significant $30 million investment to expand its micronized salt production capacity at its Michigan facility, enabling the company to scale up output to meet rising demand from both food processing and pharmaceutical sectors. This expansion reflects strong market confidence and underscores the growing reliance on micronized salt in diverse applications, where enhanced supply capabilities can reduce lead times and support large‑scale food manufacturers. The investment is expected to improve Cargill’s competitive positioning and help stabilize pricing by addressing capacity constraints. It may also encourage other players to bolster their production infrastructure, accelerating overall industry growth and ensuring broader geographic distribution of micronized salt products
- In January 2025 Tata Chemicals secured regulatory approval to export its micronized salt products to Japan, opening the Asia‑Pacific region to higher‑purity micronized salt formulations. This strategic breakthrough enables Tata Chemicals to tap into one of the world’s most quality‑demanding food markets and diversifies its revenue streams. The approval enhances the attractiveness of micronized salt in premium food processing use cases where stringent safety and quality standards are mandatory. It also positions the company for stronger international partnerships and contributes to market expansion by increasing global trade flows of micronized salt
- In 2024 K+S AG announced a strategic partnership with a leading European food manufacturer for micronized salt supply, strengthening its presence in the value‑added salt segment. This commercial collaboration is designed to secure long‑term demand and streamline supply chains, enhancing product availability for large food processors. The agreement bolsters industry confidence in micronized salt’s role as a critical ingredient for consistent seasoning, flavor enhancement, and product quality. It also highlights a trend toward integrated supply agreements, which can reduce volatility and support innovation in salt‑dependent food formulations across Europe
- In October 2020 Cargill, Incorporated expanded its portfolio by adding a new consumer-friendly size of Diamond Crystal Kosher salt with 26 ounces to the shelf. With a diverse product portfolio, the launch has helped attract customers, improve brand visibility, and meet evolving consumer convenience preferences. This expansion enables Cargill to cater to a wider audience, supporting growth in retail and home cooking applications
- In September 2020 ZOUTMAN launched sea salt, pepper, and fleur de sel products in portion sachets for the food service industry. The rising demand for portion packs encouraged the company to introduce new products, accelerating market growth. With the product launch, the company attracted more consumers, which enhanced sales and revenue while reinforcing the importance of convenience-oriented formats in food service seasoning applications
SKU-

- Interactive Data Analysis Dashboard
- Company Analysis Dashboard for high growth potential opportunities
- Research Analyst Access for customization & queries
- Competitor Analysis with Interactive dashboard
- Latest News, Updates & Trend analysis
- Harness the Power of Benchmark Analysis for Comprehensive Competitor Tracking
Asia Pacific Food Micronized Salt Market, Supply Chain Analysis and Ecosystem Framework
To support market growth and help clients navigate the impact of geopolitical shifts, DBMR has integrated in-depth supply chain analysis into its Asia Pacific Food Micronized Salt Market research reports. This addition empowers clients to respond effectively to global changes affecting their industries. The supply chain analysis section includes detailed insights such as Asia Pacific Food Micronized Salt Market consumption and production by country, price trend analysis, the impact of tariffs and geopolitical developments, and import and export trends by country and HSN code. It also highlights major suppliers with data on production capacity and company profiles, as well as key importers and exporters. In addition to research, DBMR offers specialized supply chain consulting services backed by over a decade of experience, providing solutions like supplier discovery, supplier risk assessment, price trend analysis, impact evaluation of inflation and trade route changes, and comprehensive market trend analysis.
Data collection and base year analysis are done using data collection modules with large sample sizes. The stage includes obtaining market information or related data through various sources and strategies. It includes examining and planning all the data acquired from the past in advance. It likewise envelops the examination of information inconsistencies seen across different information sources. The market data is analysed and estimated using market statistical and coherent models. Also, market share analysis and key trend analysis are the major success factors in the market report. To know more, please request an analyst call or drop down your inquiry.
The key research methodology used by DBMR research team is data triangulation which involves data mining, analysis of the impact of data variables on the market and primary (industry expert) validation. Data models include Vendor Positioning Grid, Market Time Line Analysis, Market Overview and Guide, Company Positioning Grid, Patent Analysis, Pricing Analysis, Company Market Share Analysis, Standards of Measurement, Global versus Regional and Vendor Share Analysis. To know more about the research methodology, drop in an inquiry to speak to our industry experts.
Data Bridge Market Research is a leader in advanced formative research. We take pride in servicing our existing and new customers with data and analysis that match and suits their goal. The report can be customized to include price trend analysis of target brands understanding the market for additional countries (ask for the list of countries), clinical trial results data, literature review, refurbished market and product base analysis. Market analysis of target competitors can be analyzed from technology-based analysis to market portfolio strategies. We can add as many competitors that you require data about in the format and data style you are looking for. Our team of analysts can also provide you data in crude raw excel files pivot tables (Fact book) or can assist you in creating presentations from the data sets available in the report.


