
Asia Pacific Frozen Fruits And Vegetables Market
Market Size in USD Billion
 USD
10.53 Billion
USD
19.21 Billion
2025
2033
USD
10.53 Billion
USD
19.21 Billion
2025
2033
| 2026 - 2033 | |
| USD 10.53 Billion | |
| USD 19.21 Billion | |
| % | |
|
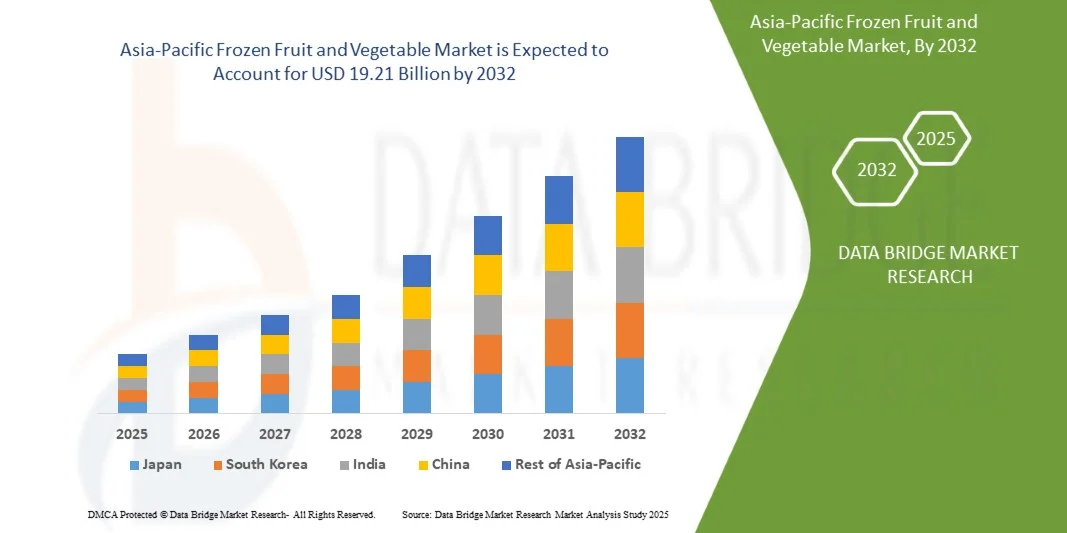
Asia-Pacific Frozen Fruit and Vegetable Market Size
- The Asia-Pacific Frozen Fruit and Vegetable Market was valued at USD 10.53 billion in 2024 and is expected to reach USD 19.21 billion by 2032, at a CAGR of 7.9% during the forecast period
- The market is primarily driven by rising cancer prevalence, increasing healthcare expenditure, and growing awareness of advanced treatment options. Expansion of hospital networks, specialized cancer treatment centers, and improved access to innovative therapies further support market development.
- This growth is driven by factors such as government initiatives promoting early cancer diagnosis, adoption of targeted therapies and immunotherapies, and increasing investments by international and local pharmaceutical companies, which collectively drive the demand and accessibility of oncology drugs across Mexico.
Asia-Pacific Frozen Fruit and Vegetable Market Analysis
- The Asia-Pacific Frozen Fruit and Vegetable Market is experiencing steady growth, driven by growing urbanization and increased adoption of healthy lifestyle, increasing consumption of canned and frozen food, increasing vegan population is expected to drive the market growth, and expansion of convenience stores.
- However, higher amount of vegetable and fruit wastage, lack of cold chain infrastructure remain key restraints, while digitalization of the retail industry, increasing number of initiatives taken by frozen fruit and vegetable manufacturers, increasing demand for fruits and vegetables with longer self-life, advancements in freezing technology to retain the quality of fruits and vegetables present significant growth opportunities
- China is expected to dominate the Asia-Pacific Frozen Fruit and Vegetable Market with the largest revenue share of 16.87% in 2025, supported by its favorable climate for year-round cultivation, strong agricultural infrastructure, high production capacity, and well-established export and distribution networks. Additionally, increasing domestic consumption and growing demand for convenient, healthy food options further bolster Italy’s market leadership.
- Japan is expected to be the fastest-growing region in the Asia-Pacific Frozen Fruit and Vegetable Market during the forecast period with a CAGR of 9.1% fueled by rising consumer demand for convenient and healthy food options, expansion of modern retail chains, increased investment in cold storage and processing facilities, and strong government support for the agribusiness sector.
- The Frozen Vegetable segment is expected to dominate the Asia-Pacific Frozen Fruit and Vegetable Market with a market share of 90.65% in 2025, driven by their wide availability, affordability, longer shelf life, and extensive use in daily meals and foodservice industries. The growing consumer preference for convenient, ready-to-cook, and nutrient-rich food options further supports the segment’s strong market position.
Report Scope and Asia-Pacific Frozen Fruit and Vegetable Market Segmentation
|
Attributes |
Asia-Pacific Frozen Fruit and Vegetable Market Insights |
|
Segments Covered |
|
|
Countries Covered |
Europe
|
|
Key Market Players |
|
|
Market Opportunities |
|
|
Value Added Data Infosets |
In addition to the insights on market scenarios such as market value, growth rate, segmentation, geographical coverage, and major players, the market reports curated by the Data Bridge Market Research also include in-depth expert analysis, patient epidemiology, pipeline analysis, pricing analysis, and regulatory framework. |
Asia-Pacific Frozen Fruit and Vegetable Market Trends
“Advancements in freezing technology to retain the quality of fruits and vegetables”
- Freezing is one of the oldest and most widely used methods of fruits and vegetable preservation, which allows preservation of taste, texture, and nutritional value in fruits and vegetables better than any other method. The freezing process combines the beneficial effects of low temperatures at which microorganisms cannot grow, reduced chemical reactions, and delayed cellular metabolic reactions.
- The frozen fruits and vegetables industry is highly based on modern science and technology. Starting with the first historical development in freezing preservation of fruits and vegetables today, a combination of several factors influences the commercialization and usage of freezing technology. The future growth of frozen fruits and vegetables will mostly be affected by economic and technological factors.
- Isochoric freezing (ICF) is a new cooling technology that allows the storage of Food and vegetables at below-freezing temperatures without the formation of ice in products. The isochoric cooling method (constant volume) represents the standard food refrigeration technology that uses isobaric (constant pressure). ICF is considered a freezing compression method, in which the pressure increases by lowering the temperature below a constant volume
In October 2023, According to a study by the U.S. Department of Agriculture’s Agricultural Research Service (ARS) and the University of California, Berkeley, isochoric freezing retained the cellular structure and color of produce such as tomatoes and blueberries better than traditional freezing methods. Research published in Sustainable Food Technology (2023) further confirmed that ICF can reduce energy use by up to 20% compared to conventional freezing.
Asia-Pacific Frozen Fruit and Vegetable Market Dynamics
Driver
“Expansions of convenience stores”
- As remote work has grown in popularity, so has the amount of time people spend at home. As a result, frozen Food, particularly frozen Food that aims toward the convenience and simplicity of convenience stores, is gaining popularity leading to the growth of the frozen fruits and vegetable market. When consumers are short on time and ideas, nothing beats going by their neighborhood convenience shop and getting frozen fruits and vegetables. As a result, convenience store sellers keep the frozen food sector on top.
- Also, the convenience store is looking for new opportunities, such as selling frozen veggies and fruits. Furthermore, the expanding selection of frozen fruits and vegetables in convenience stores is projected to increase revenue share shortly. Therefore, more than a third of businesses have added freezer space to meet demand. The most significant increases have been seen in frozen fruit, resulting in a major driver of the Asia-Pacific Frozen Fruit and Vegetable Market.
- In October 2024, 7-Eleven plans to close 444 underperforming stores and shift its focus to high-quality food offerings, including fresh-baked items, self-serve options, and specialty drinks like espresso and lattes.
- In January 2023, Frozen food sales in the U.S. increased by 8.6% in 2022, reaching $72.2 billion. Unit sales remained 5% above pre-pandemic levels, indicating sustained consumer interest in frozen food options.
- In April 2022, according to the Fuels Market News, Prepared food sales, which account for 66.7 percent of foodservice sales dollars, climbed by 25.9 % in 2021 and were 15.2 % higher than in 2019, while frozen dispensed beverage sales increased by 5.8%
Restraint/Challenge
“High cold-chain costs and limited infrastructure”
- Maintaining uninterrupted low-temperature logistics requires expensive refrigeration systems, specialized transport, and continuous monitoring, increasing overall operational costs for manufacturers and distributors. These elevated costs make frozen products less affordable and limit competitive pricing, especially in cost-sensitive markets.
- Significant upfront investment is needed for advanced cold-storage facilities, blast freezers, and temperature-controlled warehouses. Small and medium enterprises struggle to enter the market due to high capital barriers, restricting competition and slowing industry expansion.
- Rising electricity and fuel costs directly increase the expenses of freezing, storing, and transporting products. This reduces margins and forces companies to either raise prices or limit availability, affecting consumer adoption.
- Meeting strict temperature-compliance standards requires frequent maintenance, sensor upgrades, and backup energy systems. These recurring costs are essential for preventing spoilage but add long-term financial strain on companies.
- High operational costs across the cold-chain reduce flexibility in distribution and inventory management. Companies often restrict delivery networks to control expenses, limiting frozen products’ access in semi-urban and rural markets.
Asia-Pacific Frozen Fruit and Vegetable Market Scope
The market is segmented on the basis of type, category, technology, end user and distribution channel.
- By Type
On the basis of Type, Asia-Pacific Frozen Fruit and Vegetable Market is segmented into frozen vegetable, and frozen fruit. In 2025, the Frozen Vegetable segment is expected to dominate the market with a market share of 90.65%, driven by widespread consumption, longer shelf life, ease of storage and preparation, and strong demand from households and the foodservice industry.
Frozen Vegetable is the fastest-growing segment with the highest CAGR of 8.0%in the Asia-Pacific Frozen Fruit and Vegetable Market due to rising consumer demand for convenient, healthy, and ready-to-cook food options, increasing adoption in the foodservice sector, expansion of modern retail chains, and improvements in cold storage and distribution infrastructure.
- By category
On the basis of category, the Asia-Pacific Frozen Fruit and Vegetable Market is segmented into organic and conventional. In 2025, the conventional segment is expected to dominate the market with a market share of 80.99% owing to wider availability, lower cost, established supply chains, and strong consumer preference for affordable and readily accessible frozen produce across households and the foodservice industry.
The organic segment is the fastest growing of CAGR of 8.1%in the Asia-Pacific Frozen Fruit and Vegetable Market due to rising health consciousness among consumers, increasing demand for chemical-free and nutrient-rich produce, expansion of organic farming, and growing availability of organic frozen products in modern retail and online channels.
- By Technology
On the basis of Technology, the Asia-Pacific Frozen Fruit and Vegetable Market is segmented into flash-freezing/ individual quick freezing (IQF), belt freezing, high pressure-assisted freezing, and others, And Others. In 2025, the flash-freezing/ individual quick freezing (IQF) segment is expected to dominate the market with 49.70% market share due to its ability to preserve the natural taste, texture, and nutritional value of fruits and vegetables, high efficiency in processing, and widespread adoption across commercial and industrial food processing facilities.
flash-freezing/ individual quick freezing (IQF) is the fastest-growing segment with a CAGR of 8.1% in the Asia-Pacific Frozen Fruit and Vegetable Market due to its superior ability to preserve freshness, texture, and nutritional content, growing demand from foodservice and retail sectors, increased adoption by manufacturers for convenience products, and advancements in freezing technology that enhance efficiency and product quality.
- By End User
On the basis of End User, the Asia-Pacific Frozen Fruit and Vegetable Market is segmented into Food Service Sector, and Household/Retail Sector. In 2025, the Household/Retail Sector segment is expected to dominate the market with 45.00% market share due to rising consumer demand for convenient, ready-to-cook frozen products, increasing availability in supermarkets and online retail channels, and growing awareness of nutritious frozen fruits and vegetables among households.
Household/Retail Sector is the fastest-growing segment with CAGR of 8.3% in the Asia-Pacific Frozen Fruit and Vegetable Market due to increasing consumer preference for convenient, ready-to-cook, and nutritious frozen products, expansion of modern retail and e-commerce channels, rising health consciousness, and growing urbanization that drives demand for time-saving food solutions.
- By Distribution Channel
On the basis of Distribution Channel, the Asia-Pacific Frozen Fruit and Vegetable Market is segmented into Store Based Retailer, and Non-Store Retailers. In 2025, the store based retailers segment is expected to dominate the market with 82.65% market share due to the widespread presence of supermarkets and hypermarkets, consumer preference for physically inspecting products before purchase, well-established supply chains, and strong brand visibility in traditional retail outlets.
The Store Based Retailer segment is the fastest growing segment with CAGR of 8.2% in the Asia-Pacific Frozen Fruit and Vegetable Market due to rapid expansion of modern retail chains, increasing consumer preference for in-store shopping for quality and freshness, greater product visibility and promotions, and the convenience offered by supermarkets and hypermarkets for purchasing frozen fruits and vegetables.
Asia-Pacific Frozen Fruit and Vegetable Market Regional Analysis
- China is expected to dominate the Asia-Pacific Frozen Fruit and Vegetable Market with the largest revenue share of 16.87% in 2025, supported by favorable climate for year-round cultivation, high production capacity, well-established supply chains, strong export infrastructure, and increasing domestic consumption of frozen fruits and vegetables.
- Japan is expected to be the fastest-growing region in the Asia-Pacific Frozen Fruit and Vegetable Market during the forecast period with a CAGR of 9.1% fueled by rising consumer demand for convenient and healthy food options, expansion of modern retail and e-commerce channels, growing investments in cold storage and processing infrastructure, and supportive government initiatives in the agribusiness sector.
China Asia-Pacific Frozen Fruit and Vegetable Market Insight
The China Asia-Pacific Frozen Fruit and Vegetable Market plays a significant role in the Europe cancer treatment landscape, fueled by its favorable climate for year-round cultivation, large-scale production capacity, strong distribution networks, growing consumer demand for convenient and healthy food options, and increasing adoption of modern retail and e-commerce channels.
Japan Asia-Pacific Frozen Fruit and Vegetable Market Insight
The Japan Asia-Pacific Frozen Fruit and Vegetable Market is projected to grow steadily, supported by a favorable agricultural environment, strong production and export capabilities, increasing consumer demand for convenient and nutritious frozen products, and expansion of modern retail and cold chain infrastructure.
The Major Market Leaders Operating in the Market Are:
- Grupo Virto (Spain)
- SFI LLC. (China)
- Simplot Company (U.S.)
- Twin City Foods Inc. (U.S.)
- Goya Foods, Inc. (U.S.)
- Alasko Foods Inc. (Canada)
- Ardo (Belgium)
- BC Frozen Foods (Canada)
- Bonduelle (France)
- Bsfoods (Netherlands)
- Capricorn Food Products India Ltd. (India)
- Cascadian Farm Organic (U.S.)
- Conagra Brands, Inc. (U.S.)
- FINDUS SVERIGE AB (Sweden)
- Fruktana (North Macedonia)
- General Mills Inc. (U.S.)
- Hanover Foods (U.S.)
- HEALTHY PAC CORP (U.S.)
- Stahlbush Island Farms (U.S.)
- SunOpta (Canada)
Latest Developments in Asia-Pacific Frozen Fruit and Vegetable Market
- In February 2022, J.R. Simplot Company made a multi-year agreement with the Kraft Heinz Company. This has helped the company to add capacity and distribution capabilities.
- In August 2021, Ardo received the Voka Charter Corporate Sustainability award 2021. This award has helped the company to attract a more customer base.
- In July 2021, Bonduelle expanded its canned and frozen vegetable plant and invested $5 million in expansion operations at its facility in Lebanon, Pa. This has helped the company to increase its production facility.
- In May 2021, Grupo Virto has made 56,000 pallet clad-rack warehouse for frozen products. The new clad-rack warehouse, which covers 11,020 m2 and will be 38 metres high, will have a storage capacity for 56,166 europallets, which will allow Virto Group to have a stock of between 50 and 70 million kilos of frozen products. This has helped the company to expand its storage capacity.
- In 2020, SunOpta announced an expansion in Alexandria in November and invested $26 million in it. This expansion has helped the company to widen its production capacity.
SKU-

- Interactive Data Analysis Dashboard
- Company Analysis Dashboard for high growth potential opportunities
- Research Analyst Access for customization & queries
- Competitor Analysis with Interactive dashboard
- Latest News, Updates & Trend analysis
- Harness the Power of Benchmark Analysis for Comprehensive Competitor Tracking
Table of Content
1 INTRODUCTION
1.1 OBJECTIVES OF THE STUDY
1.2 MARKET DEFINITION
1.3 OVERVIEW OF ASIA-PACIFIC FROZEN FRUIT AND VEGETABLE MARKET
1.4 LIMITATIONS
1.5 MARKETS COVERED
2 MARKET SEGMENTATION
2.1 MARKETS COVERED
2.2 GEOGRAPHICAL SCOPE
2.3 YEARS CONSIDERED FOR THE STUDY
2.4 CURRENCY AND PRICING
2.5 DBMR TRIPOD DATA VALIDATION MODEL
2.6 MULTIVARIATE MODELLING
2.7 PRIMARY INTERVIEWS WITH KEY OPINION LEADERS
2.8 DBMR MARKET POSITION GRID
2.9 MARKET TYPE COVERAGE GRID
2.1 VENDOR SHARE ANALYSIS
2.11 SECONDARY SOURCES
2.12 ASSUMPTIONS
3 EXECUTIVE SUMMARY
4 PREMIUM INSIGHTS
4.1 PORTER’S FIVE FORCES
4.1.1 THREAT OF NEW ENTRANTS
4.1.2 BARGAINING POWER OF SUPPLIERS
4.1.3 BARGAINING POWER OF BUYERS
4.1.4 THREAT OF SUBSTITUTES
4.1.5 INDUSTRY RIVALRY
4.2 PESTEL ANALYSIS
4.2.1 POLITICAL FACTORS
4.2.2 ECONOMIC FACTORS
4.2.3 SOCIAL FACTORS
4.2.4 TECHNOLOGICAL FACTORS
4.2.5 ENVIRONMENTAL FACTORS
4.2.6 LEGAL FACTORS
4.3 VENDOR SELECTION CRITERIA
4.4 INNOVATION TRACKER AND STRATEGIC ANALYSIS
4.4.1 MAJOR DEALS AND STRATEGIC ALLIANCES ANALYSIS
4.4.1.1 JOINT VENTURES
4.4.1.2 MERGERS AND ACQUISITIONS
4.4.1.3 LICENSING AND PARTNERSHIP
4.4.1.4 TECHNOLOGY COLLABORATIONS
4.4.1.5 STRATEGIC DIVESTMENTS
4.4.2 NUMBER OF PRODUCTS IN DEVELOPMENT
4.4.3 STAGE OF DEVELOPMENT
4.4.4 TIMELINES AND MILESTONES
4.4.5 INNOVATION STRATEGIES AND METHODOLOGIES
4.4.6 RISK ASSESSMENT AND MITIGATION
4.4.7 FUTURE OUTLOOK
4.5 CLIMATE CHANGE SCENARIO
4.5.1 ENVIRONMENTAL CONCERNS
4.5.2 INDUSTRY RESPONSE
4.5.3 GOVERNMENT’S ROLE
4.5.4 ANALYST RECOMMENDATIONS
4.6 TECHNOLOGICAL ADVANCEMENTS
4.6.1 INDIVIDUAL QUICK FREEZING (IQF) TECHNOLOGY
4.6.2 CRYOGENIC FREEZING TECHNOLOGY
4.6.3 SMART COLD CHAIN MONITORING SYSTEMS
4.6.4 HIGH-PRESSURE PROCESSING (HPP)
4.6.5 MODIFIED ATMOSPHERE FREEZING (MAF)
4.6.6 ADVANCED BLANCHING TECHNIQUES
4.7 SUPPLY CHAIN ANALYSIS
4.7.1 RAW MATERIAL PROCUREMENT
4.7.2 MANUFACTURING PROCESS
4.7.3 MARKETING AND DISTRIBUTION
4.7.4 END USERS
5 REGULATIONS
5.1 US STANDARDS
6 MARKET OVERVIEW
6.1 DRIVERS
6.1.1 GROWING URBANIZATION AND INCREASED ADOPTION OF HEALTHY LIFESTYLE
6.1.2 INCREASING CONSUMPTION OF CANNED AND FROZEN FOOD
6.1.3 THE INCREASING VEGAN POPULATION IS EXPECTED TO DRIVE THE MARKET GROWTH
6.1.4 EXPANSIONS OF CONVENIENCE STORES
6.2 RESTRAINTS
6.2.1 HIGHER AMOUNT OF VEGETABLE AND FRUIT WASTAGE
6.2.2 LACK OF COLD CHAIN INFRASTRUCTURE
6.3 OPPORTUNITIES
6.3.1 DIGITALIZATION OF THE RETAIL INDUSTRY
6.3.2 INCREASING NUMBER OF INITIATIVES TAKEN BY FROZEN FRUIT AND VEGETABLE MANUFACTURERS
6.3.3 INCREASING DEMAND FOR FRUITS AND VEGETABLES WITH LONGER SHELF-LIFE
6.3.4 ADVANCEMENTS IN FREEZING TECHNOLOGY TO RETAIN THE QUALITY OF FRUITS AND VEGETABLES
6.4 CHALLENGES
6.4.1 HIGH COMPETITION AMONG THE MARKET PLAYERS
6.4.2 HIGH INVESTMENT COST FOR THE PRODUCTION OF CANNED AND FROZEN VEGETABLES AND FRUITS
7 ASIA-PACIFIC FROZEN FRUIT AND VEGETABLE MARKET, BY TYPE
7.1 OVERVIEW
7.2 FROZEN VEGETABLE
7.3 FROZEN FRUIT
7.3.1 BERRIES
7.3.2 PEACH
7.3.3 MANGO
7.3.4 APRICOTS
7.3.5 AVOCADOS
7.3.6 KIWI
7.3.7 PINEAPPLE
7.3.8 POMEGRANATE
7.3.9 APPLE
7.3.10 GRAPES
7.3.11 BANANA
7.3.12 MIXED-FRUITS
7.3.13 FIGS
7.3.14 PLUMS
7.3.15 PEARS
7.3.16 OTHERS (CHERRIES, LYCHEES, PAW PAW)
8 ASIA-PACIFIC FROZEN FRUIT AND VEGETABLE MARKET, BY CATEGORY
8.1 OVERVIEW
8.2 CONVENTIONAL
8.3 ORGANIC
9 ASIA-PACIFIC FROZEN FRUIT AND VEGETABLE MARKET, BY TECHNOLOGY
9.1 OVERVIEW
9.2 FLASH-FREEZING/ INDIVIDUAL QUICK FREEZING (IQF)
9.3 BELT FREEZING
9.4 HIGH PRESSURE-ASSISTED FREEZING
9.5 OTHERS
10 ASIA-PACIFIC FROZEN FRUIT AND VEGETABLE MARKET, BY END USER
10.1 OVERVIEW
10.2 FOOD SERVICE SECTOR
10.2.1 RESTAURANTS
10.3 CAFES
10.3.1 HOTELS
10.3.2 OTHERS
10.4 HOUSEHOLD/RETAIL SECTOR
11 ASIA-PACIFIC FROZEN FRUIT AND VEGETABLE MARKET, BY DISTRIBUTION CHANNEL
11.1 OVERVIEW
11.2 STORE BASED RETAILER
11.3 NON-STORE RETAILERS
11.3.1 ONLINE
11.3.2 COMPANY WEBSITE
12 ASIA-PACIFIC FROZEN FRUIT AND VEGETABLE MARKET, BY REGION
12.1 ASIA-PACIFIC
12.1.1 CHINA
12.1.2 JAPAN
12.1.3 SOUTH KOREA
12.1.4 VIETNAM
12.1.5 INDONESIA
12.1.6 INDIA
12.1.7 PHILIPPINES
12.1.8 THAILAND
12.1.9 SINGAPORE
12.1.10 NEW ZEALAND
12.1.11 MALAYSIA
12.1.12 AUSTRALIA
12.1.13 REST OF ASIA-PACIFIC
13 ASIA-PACIFIC FROZEN FRUITS AND VEGETABLES MARKET, COMPANY LANDSCAPE
13.1 COMPANY SHARE ANALYSIS: GLOBAL
14 SWOT ANALYSIS
15 COMPANY PROFILE
15.1 GRUPO VIRTO
15.1.1 COMPANY SNAPSHOT
15.1.2 COMPANY SHARE ANALYSIS
15.1.3 PRODUCT PORTFOLIO
15.1.4 RECENT DEVELOPMENTS
15.2 SFI LLC.
15.2.1 COMPANY SNAPSHOT
15.2.2 COMPANY SHARE ANALYSIS
15.2.3 PRODUCT PORTFOLIO
15.2.4 RECENT DEVELOPMENTS
15.3 SIMPLOT COMPANY.
15.3.1 COMPANY SNAPSHOT
15.3.2 COMPANY SHARE ANALYSIS
15.3.3 PRODUCT PORTFOLIO
15.3.4 RECENT DEVELOPMENTS
15.4 TWIN CITY FOODS INC.
15.4.1 COMPANY SNAPSHOT
15.4.2 COMPANY SHARE ANALYSIS
15.4.3 PRODUCT PORTFOLIO
15.4.4 RECENT DEVELOPMENTS
15.5 GOYA FOODS, INC.
15.5.1 COMPANY SNAPSHOT
15.5.2 COMPANY SHARE ANALYSIS
15.5.3 PRODUCT PORTFOLIO
15.5.4 RECENT DEVELOPMENTS
15.6 ALASKO FOODS INC.
15.6.1 COMPANY SNAPSHOT
15.6.2 PRODUCT PORTFOLIO
15.6.3 RECENT DEVELOPMENT
15.7 ARDO
15.7.1 COMPANY SNAPSHOT
15.7.2 PRODUCT PORTFOLIO
15.7.3 RECENT DEVELOPMENTS
15.8 BC FROZEN FOODS.
15.8.1 COMPANY SNAPSHOT
15.8.2 PRODUCT PORTFOLIO
15.8.3 RECENT DEVELOPMENTS
15.9 BONDUELLE
15.9.1 COMPANY SNAPSHOT
15.9.2 REVENUE ANALYSIS
15.9.3 PRODUCT PORTFOLIO
15.9.4 RECENT DEVELOPMENTS
15.1 BSFOODS
15.10.1 COMPANY SNAPSHOT
15.10.2 PRODUCT PORTFOLIO
15.10.3 RECENT DEVELOPMENTS
15.11 CAPRICORN FOOD PRODUCTS INDIA LTD.
15.11.1 COMPANY SNAPSHOT
15.11.2 PRODUCT PORTFOLIO
15.11.3 RECENT DEVELOPMENTS
15.12 CASCADIAN FARM ORGANIC.
15.12.1 COMPANY SNAPSHOT
15.12.2 PRODUCT PORTFOLIO
15.12.3 RECENT DEVELOPMENT
15.13 CONAGRA BRANDS, INC.
15.13.1 COMPANY SNAPSHOT
15.13.2 REVENUE ANALYSIS
15.13.3 PRODUCT PORTFOLIO
15.13.4 RECENT DEVELOPMENTS
15.14 FINDUS SVERIGE AB
15.14.1 COMPANY SNAPSHOT
15.14.2 RECENT DEVELOPMENTS
15.15 FRUKTANA
15.15.1 COMPANY SNAPSHOT
15.15.2 PRODUCT PORTFOLIO
15.15.3 RECENT DEVELOPMENTS
15.16 GENERAL MILLS INC.
15.16.1 COMPANY SNAPSHOT
15.16.2 REVENUE ANALYSIS
15.16.3 PRODUCT PORTFOLIO
15.16.4 RECENT DEVELOPMENTS
15.17 HANOVER FOODS
15.17.1 COMPANY SNAPSHOT
15.17.2 PRODUCT PORTFOLIO
15.17.3 RECENT DEVELOPMENTS
15.18 HEALTHY PAC CORP
15.18.1 COMPANY SNAPSHOT
15.18.2 PRODUCT PORTFOLIO
15.18.3 RECENT DEVELOPMENTS
15.19 STAHLBUSH ISLAND FARMS
15.19.1 COMPANY SNAPSHOT
15.19.2 PRODUCT PORTFOLIO
15.19.3 RECENT DEVELOPMENTS
15.2 SUNOPTA
15.20.1 COMPANY SNAPSHOT
15.20.2 REVENUE ANALYSIS
15.20.3 PRODUCT PORTFOLIO
15.20.4 RECENT DEVELOPMENT
16 QUESTIONNAIRE
17 RELATED REPORTS
List of Table
TABLE 1 52 WEEKS ENDING MAY 30, 2021.
TABLE 2 ASIA-PACIFIC FROZEN FRUIT AND VEGETABLE MARKET, BY TYPE, 2018-2032 (USD THOUSAND)
TABLE 3 ASIA-PACIFIC FROZEN FRUIT AND VEGETABLE MARKET, BY TYPE, 2018-2032 (UNITS)
TABLE 4 ASIA-PACIFIC FROZEN VEGETABLE IN FROZEN FRUIT AND VEGETABLE MARKET, BY TYPE, 2018-2032 (USD THOUSAND)
TABLE 5 ASIA-PACIFIC FROZEN FRUIT IN FROZEN FRUIT AND VEGETABLE MARKET, BY TYPE, 2018-2032 (USD THOUSAND)
TABLE 6 ASIA-PACIFIC BERRIES IN FROZEN FRUIT AND VEGETABLE MARKET, BY TYPE, 2018-2032 (USD THOUSAND)
TABLE 7 ASIA-PACIFIC FROZEN FRUIT AND VEGETABLE MARKET, BY CATEGORY, 2018-2032 (USD THOUSAND)
TABLE 8 ASIA-PACIFIC FROZEN FRUIT AND VEGETABLE MARKET, BY TECHNOLOGY, 2018-2032 (USD THOUSAND)
TABLE 9 ASIA-PACIFIC FROZEN FRUIT AND VEGETABLE MARKET, BY END USER, 2018-2032 (USD THOUSAND)
TABLE 10 ASIA-PACIFIC FOOD SERVICE SECTOR IN FROZEN FRUIT AND VEGETABLE MARKET, BY END USER,2018-2032 (USD THOUSAND)
TABLE 11 ASIA-PACIFIC RESTAURANTS IN FROZEN FRUIT AND VEGETABLE MARKET, BY END USER,2018-2032 (USD THOUSAND)
TABLE 12 ASIA-PACIFIC FROZEN FRUIT AND VEGETABLE MARKET, BY DISTRIBUTION CHANNEL,2018-2032 (USD THOUSAND)
TABLE 13 ASIA-PACIFIC STORE-BASED RETAILERS IN FROZEN FRUIT AND VEGETABLE MARKET, BY DISTRIBUTION CHANNEL,2018-2032 (USD THOUSAND)
TABLE 14 ASIA-PACIFIC NON-STORE RETAILERS IN FROZEN FRUIT AND VEGETABLE MARKET, BY DISTRIBUTION CHANNEL,2018-2032 (USD THOUSAND)
TABLE 15 ASIA-PACIFIC FROZEN FRUIT AND VEGETABLE MARKET, BY COUNTRY, 2018-2032 (USD THOUSAND)
TABLE 16 ASIA-PACIFIC FROZEN FRUIT AND VEGETABLE MARKET, BY COUNTRY, 2018-2032 (THOUSAND TONS)
TABLE 17 ASIA-PACIFIC FROZEN FRUIT AND VEGETABLE MARKET, BY TYPE, 2018-2032 (USD THOUSAND)
TABLE 18 ASIA-PACIFIC FROZEN FRUIT AND VEGETABLE MARKET, BY TYPE, 2018-2032 (THOUSAND TONS)
TABLE 19 ASIA-PACIFIC FROZEN VEGETABLE IN FROZEN FRUIT AND VEGETABLE MARKET, BY TYPE, 2018-2032 (USD THOUSAND)
TABLE 20 ASIA-PACIFIC FROZEN FRUIT IN FROZEN FRUIT AND VEGETABLE MARKET, BY TYPE, 2018-2032 (USD THOUSAND)
TABLE 21 ASIA-PACIFIC BERRIES IN FROZEN FRUIT AND VEGETABLE MARKET, BY TYPE, 2018-2032 (USD THOUSAND)
TABLE 22 ASIA-PACIFIC FROZEN FRUIT AND VEGETABLE MARKET, BY CATEGORY, 2018-2032 (USD THOUSAND)
TABLE 23 ASIA-PACIFIC FROZEN FRUIT AND VEGETABLE MARKET, BY TECHNOLOGY, 2018-2032 (USD THOUSAND)
TABLE 24 ASIA-PACIFIC FROZEN FRUIT AND VEGETABLE MARKET, BY END USER, 2018-2032 (USD THOUSAND)
TABLE 25 ASIA-PACIFIC FOOD SERVICE SECTOR IN FROZEN FRUIT AND VEGETABLE MARKET, BY END USER,2018-2032 (USD THOUSAND)
TABLE 26 ASIA-PACIFIC RESTAURANTS IN FROZEN FRUIT AND VEGETABLE MARKET, BY END USER,2018-2032 (USD THOUSAND)
TABLE 27 ASIA-PACIFIC FROZEN FRUIT AND VEGETABLE MARKET, BY DISTRIBUTION CHANNEL,2018-2032 (USD THOUSAND)
TABLE 28 ASIA-PACIFIC STORE-BASED RETAILERS IN FROZEN FRUIT AND VEGETABLE MARKET, BY DISTRIBUTION CHANNEL,2018-2032 (USD THOUSAND)
TABLE 29 ASIA-PACIFIC NON-STORE RETAILERS IN FROZEN FRUIT AND VEGETABLE MARKET, BY DISTRIBUTION CHANNEL,2018-2032 (USD THOUSAND)
TABLE 30 CHINA FROZEN FRUIT AND VEGETABLE MARKET, 2018-2032 (USD THOUSAND)
TABLE 31 CHINA FROZEN FRUIT AND VEGETABLE MARKET, BY TYPE, 2018-2032 (USD THOUSAND)
TABLE 32 CHINA FROZEN FRUIT AND VEGETABLE MARKET, BY TYPE, 2018-2032 (THOUSAND TONS)
TABLE 33 CHINA FROZEN VEGETABLE IN FROZEN FRUIT AND VEGETABLE MARKET, BY TYPE, 2018-2032 (USD THOUSAND)
TABLE 34 CHINA FROZEN FRUIT IN FROZEN FRUIT AND VEGETABLE MARKET, BY TYPE, 2018-2032 (USD THOUSAND)
TABLE 35 CHINA BERRIES IN FROZEN FRUIT AND VEGETABLE MARKET, BY TYPE, 2018-2032 (USD THOUSAND)
TABLE 36 CHINA FROZEN FRUIT AND VEGETABLE MARKET, BY CATEGORY, 2018-2032 (USD THOUSAND)
TABLE 37 CHINA FROZEN FRUIT AND VEGETABLE MARKET, BY TECHNOLOGY, 2018-2032 (USD THOUSAND)
TABLE 38 CHINA FROZEN FRUIT AND VEGETABLE MARKET, BY END USER, 2018-2032 (USD THOUSAND)
TABLE 39 CHINA FOOD SERVICE SECTOR IN FROZEN FRUIT AND VEGETABLE MARKET, BY END USER,2018-2032 (USD THOUSAND)
TABLE 40 CHINA RESTAURANTS IN FROZEN FRUIT AND VEGETABLE MARKET, BY END USER,2018-2032 (USD THOUSAND)
TABLE 41 CHINA FROZEN FRUIT AND VEGETABLE MARKET, BY DISTRIBUTION CHANNEL,2018-2032 (USD THOUSAND)
TABLE 42 CHINA STORE-BASED RETAILERS IN FROZEN FRUIT AND VEGETABLE MARKET, BY DISTRIBUTION CHANNEL,2018-2032 (USD THOUSAND)
TABLE 43 CHINA NON-STORE RETAILERS IN FROZEN FRUIT AND VEGETABLE MARKET, BY DISTRIBUTION CHANNEL,2018-2032 (USD THOUSAND)
TABLE 44 JAPAN FROZEN FRUIT AND VEGETABLE MARKET, 2018-2032 (USD THOUSAND)
TABLE 45 JAPAN FROZEN FRUIT AND VEGETABLE MARKET, BY TYPE, 2018-2032 (USD THOUSAND)
TABLE 46 JAPAN FROZEN FRUIT AND VEGETABLE MARKET, BY TYPE, 2018-2032 (THOUSAND TONS)
TABLE 47 JAPAN FROZEN VEGETABLE IN FROZEN FRUIT AND VEGETABLE MARKET, BY TYPE, 2018-2032 (USD THOUSAND)
TABLE 48 JAPAN FROZEN FRUIT IN FROZEN FRUIT AND VEGETABLE MARKET, BY TYPE, 2018-2032 (USD THOUSAND)
TABLE 49 JAPAN BERRIES IN FROZEN FRUIT AND VEGETABLE MARKET, BY TYPE, 2018-2032 (USD THOUSAND)
TABLE 50 JAPAN FROZEN FRUIT AND VEGETABLE MARKET, BY CATEGORY, 2018-2032 (USD THOUSAND)
TABLE 51 JAPAN FROZEN FRUIT AND VEGETABLE MARKET, BY TECHNOLOGY, 2018-2032 (USD THOUSAND)
TABLE 52 JAPAN FROZEN FRUIT AND VEGETABLE MARKET, BY END USER, 2018-2032 (USD THOUSAND)
TABLE 53 JAPAN FOOD SERVICE SECTOR IN FROZEN FRUIT AND VEGETABLE MARKET, BY END USER,2018-2032 (USD THOUSAND)
TABLE 54 JAPAN RESTAURANTS IN FROZEN FRUIT AND VEGETABLE MARKET, BY END USER,2018-2032 (USD THOUSAND)
TABLE 55 JAPAN FROZEN FRUIT AND VEGETABLE MARKET, BY DISTRIBUTION CHANNEL,2018-2032 (USD THOUSAND)
TABLE 56 JAPAN STORE-BASED RETAILERS IN FROZEN FRUIT AND VEGETABLE MARKET, BY DISTRIBUTION CHANNEL,2018-2032 (USD THOUSAND)
TABLE 57 JAPAN NON-STORE RETAILERS IN FROZEN FRUIT AND VEGETABLE MARKET, BY DISTRIBUTION CHANNEL,2018-2032 (USD THOUSAND)
TABLE 58 SOUTH KOREA FROZEN FRUIT AND VEGETABLE MARKET, 2018-2032 (USD THOUSAND)
TABLE 59 SOUTH KOREA FROZEN FRUIT AND VEGETABLE MARKET, BY TYPE, 2018-2032 (USD THOUSAND)
TABLE 60 SOUTH KOREA FROZEN FRUIT AND VEGETABLE MARKET, BY TYPE, 2018-2032 (THOUSAND TONS)
TABLE 61 SOUTH KOREA FROZEN VEGETABLE IN FROZEN FRUIT AND VEGETABLE MARKET, BY TYPE, 2018-2032 (USD THOUSAND)
TABLE 62 SOUTH KOREA FROZEN FRUIT IN FROZEN FRUIT AND VEGETABLE MARKET, BY TYPE, 2018-2032 (USD THOUSAND)
TABLE 63 SOUTH KOREA BERRIES IN FROZEN FRUIT AND VEGETABLE MARKET, BY TYPE, 2018-2032 (USD THOUSAND)
TABLE 64 SOUTH KOREA FROZEN FRUIT AND VEGETABLE MARKET, BY CATEGORY, 2018-2032 (USD THOUSAND)
TABLE 65 SOUTH KOREA FROZEN FRUIT AND VEGETABLE MARKET, BY TECHNOLOGY, 2018-2032 (USD THOUSAND)
TABLE 66 SOUTH KOREA FROZEN FRUIT AND VEGETABLE MARKET, BY END USER, 2018-2032 (USD THOUSAND)
TABLE 67 SOUTH KOREA FOOD SERVICE SECTOR IN FROZEN FRUIT AND VEGETABLE MARKET, BY END USER,2018-2032 (USD THOUSAND)
TABLE 68 SOUTH KOREA RESTAURANTS IN FROZEN FRUIT AND VEGETABLE MARKET, BY END USER,2018-2032 (USD THOUSAND)
TABLE 69 SOUTH KOREA FROZEN FRUIT AND VEGETABLE MARKET, BY DISTRIBUTION CHANNEL,2018-2032 (USD THOUSAND)
TABLE 70 SOUTH KOREA STORE-BASED RETAILERS IN FROZEN FRUIT AND VEGETABLE MARKET, BY DISTRIBUTION CHANNEL,2018-2032 (USD THOUSAND)
TABLE 71 SOUTH KOREA NON-STORE RETAILERS IN FROZEN FRUIT AND VEGETABLE MARKET, BY DISTRIBUTION CHANNEL,2018-2032 (USD THOUSAND)
TABLE 72 VIETNAM FROZEN FRUIT AND VEGETABLE MARKET, 2018-2032 (USD THOUSAND)
TABLE 73 VIETNAM FROZEN FRUIT AND VEGETABLE MARKET, BY TYPE, 2018-2032 (USD THOUSAND)
TABLE 74 VIETNAM FROZEN FRUIT AND VEGETABLE MARKET, BY TYPE, 2018-2032 (THOUSAND TONS)
TABLE 75 VIETNAM FROZEN VEGETABLE IN FROZEN FRUIT AND VEGETABLE MARKET, BY TYPE, 2018-2032 (USD THOUSAND)
TABLE 76 VIETNAM FROZEN FRUIT IN FROZEN FRUIT AND VEGETABLE MARKET, BY TYPE, 2018-2032 (USD THOUSAND)
TABLE 77 VIETNAM BERRIES IN FROZEN FRUIT AND VEGETABLE MARKET, BY TYPE, 2018-2032 (USD THOUSAND)
TABLE 78 VIETNAM FROZEN FRUIT AND VEGETABLE MARKET, BY CATEGORY, 2018-2032 (USD THOUSAND)
TABLE 79 VIETNAM FROZEN FRUIT AND VEGETABLE MARKET, BY TECHNOLOGY, 2018-2032 (USD THOUSAND)
TABLE 80 VIETNAM FROZEN FRUIT AND VEGETABLE MARKET, BY END USER, 2018-2032 (USD THOUSAND)
TABLE 81 VIETNAM FOOD SERVICE SECTOR IN FROZEN FRUIT AND VEGETABLE MARKET, BY END USER,2018-2032 (USD THOUSAND)
TABLE 82 VIETNAM RESTAURANTS IN FROZEN FRUIT AND VEGETABLE MARKET, BY END USER,2018-2032 (USD THOUSAND)
TABLE 83 VIETNAM FROZEN FRUIT AND VEGETABLE MARKET, BY DISTRIBUTION CHANNEL,2018-2032 (USD THOUSAND)
TABLE 84 VIETNAM STORE-BASED RETAILERS IN FROZEN FRUIT AND VEGETABLE MARKET, BY DISTRIBUTION CHANNEL,2018-2032 (USD THOUSAND)
TABLE 85 VIETNAM NON-STORE RETAILERS IN FROZEN FRUIT AND VEGETABLE MARKET, BY DISTRIBUTION CHANNEL,2018-2032 (USD THOUSAND)
TABLE 86 INDONESIA FROZEN FRUIT AND VEGETABLE MARKET, 2018-2032 (USD THOUSAND)
TABLE 87 INDONESIA FROZEN FRUIT AND VEGETABLE MARKET, BY TYPE, 2018-2032 (USD THOUSAND)
TABLE 88 INDONESIA FROZEN FRUIT AND VEGETABLE MARKET, BY TYPE, 2018-2032 (THOUSAND TONS)
TABLE 89 INDONESIA FROZEN VEGETABLE IN FROZEN FRUIT AND VEGETABLE MARKET, BY TYPE, 2018-2032 (USD THOUSAND)
TABLE 90 INDONESIA FROZEN FRUIT IN FROZEN FRUIT AND VEGETABLE MARKET, BY TYPE, 2018-2032 (USD THOUSAND)
TABLE 91 INDONESIA BERRIES IN FROZEN FRUIT AND VEGETABLE MARKET, BY TYPE, 2018-2032 (USD THOUSAND)
TABLE 92 INDONESIA FROZEN FRUIT AND VEGETABLE MARKET, BY CATEGORY, 2018-2032 (USD THOUSAND)
TABLE 93 INDONESIA FROZEN FRUIT AND VEGETABLE MARKET, BY TECHNOLOGY, 2018-2032 (USD THOUSAND)
TABLE 94 INDONESIA FROZEN FRUIT AND VEGETABLE MARKET, BY END USER, 2018-2032 (USD THOUSAND)
TABLE 95 INDONESIA FOOD SERVICE SECTOR IN FROZEN FRUIT AND VEGETABLE MARKET, BY END USER,2018-2032 (USD THOUSAND)
TABLE 96 INDONESIA RESTAURANTS IN FROZEN FRUIT AND VEGETABLE MARKET, BY END USER,2018-2032 (USD THOUSAND)
TABLE 97 INDONESIA FROZEN FRUIT AND VEGETABLE MARKET, BY DISTRIBUTION CHANNEL,2018-2032 (USD THOUSAND)
TABLE 98 INDONESIA STORE-BASED RETAILERS IN FROZEN FRUIT AND VEGETABLE MARKET, BY DISTRIBUTION CHANNEL,2018-2032 (USD THOUSAND)
TABLE 99 INDONESIA NON-STORE RETAILERS IN FROZEN FRUIT AND VEGETABLE MARKET, BY DISTRIBUTION CHANNEL,2018-2032 (USD THOUSAND)
TABLE 100 INDIA FROZEN FRUIT AND VEGETABLE MARKET, 2018-2032 (USD THOUSAND)
TABLE 101 INDIA FROZEN FRUIT AND VEGETABLE MARKET, BY TYPE, 2018-2032 (USD THOUSAND)
TABLE 102 INDIA FROZEN FRUIT AND VEGETABLE MARKET, BY TYPE, 2018-2032 (THOUSAND TONS)
TABLE 103 INDIA FROZEN VEGETABLE IN FROZEN FRUIT AND VEGETABLE MARKET, BY TYPE, 2018-2032 (USD THOUSAND)
TABLE 104 INDIA FROZEN FRUIT IN FROZEN FRUIT AND VEGETABLE MARKET, BY TYPE, 2018-2032 (USD THOUSAND)
TABLE 105 INDIA BERRIES IN FROZEN FRUIT AND VEGETABLE MARKET, BY TYPE, 2018-2032 (USD THOUSAND)
TABLE 106 INDIA FROZEN FRUIT AND VEGETABLE MARKET, BY CATEGORY, 2018-2032 (USD THOUSAND)
TABLE 107 INDIA FROZEN FRUIT AND VEGETABLE MARKET, BY TECHNOLOGY, 2018-2032 (USD THOUSAND)
TABLE 108 INDIA FROZEN FRUIT AND VEGETABLE MARKET, BY END USER, 2018-2032 (USD THOUSAND)
TABLE 109 INDIA FOOD SERVICE SECTOR IN FROZEN FRUIT AND VEGETABLE MARKET, BY END USER,2018-2032 (USD THOUSAND)
TABLE 110 INDIA RESTAURANTS IN FROZEN FRUIT AND VEGETABLE MARKET, BY END USER,2018-2032 (USD THOUSAND)
TABLE 111 INDIA FROZEN FRUIT AND VEGETABLE MARKET, BY DISTRIBUTION CHANNEL,2018-2032 (USD THOUSAND)
TABLE 112 INDIA STORE-BASED RETAILERS IN FROZEN FRUIT AND VEGETABLE MARKET, BY DISTRIBUTION CHANNEL,2018-2032 (USD THOUSAND)
TABLE 113 INDIA NON-STORE RETAILERS IN FROZEN FRUIT AND VEGETABLE MARKET, BY DISTRIBUTION CHANNEL,2018-2032 (USD THOUSAND)
TABLE 114 PHILIPPINES FROZEN FRUIT AND VEGETABLE MARKET, 2018-2032 (USD THOUSAND)
TABLE 115 PHILIPPINES FROZEN FRUIT AND VEGETABLE MARKET, BY TYPE, 2018-2032 (USD THOUSAND)
TABLE 116 PHILIPPINES FROZEN FRUIT AND VEGETABLE MARKET, BY TYPE, 2018-2032 (THOUSAND TONS)
TABLE 117 PHILIPPINES FROZEN VEGETABLE IN FROZEN FRUIT AND VEGETABLE MARKET, BY TYPE, 2018-2032 (USD THOUSAND)
TABLE 118 PHILIPPINES FROZEN FRUIT IN FROZEN FRUIT AND VEGETABLE MARKET, BY TYPE, 2018-2032 (USD THOUSAND)
TABLE 119 PHILIPPINES BERRIES IN FROZEN FRUIT AND VEGETABLE MARKET, BY TYPE, 2018-2032 (USD THOUSAND)
TABLE 120 PHILIPPINES FROZEN FRUIT AND VEGETABLE MARKET, BY CATEGORY, 2018-2032 (USD THOUSAND)
TABLE 121 PHILIPPINES FROZEN FRUIT AND VEGETABLE MARKET, BY TECHNOLOGY, 2018-2032 (USD THOUSAND)
TABLE 122 PHILIPPINES FROZEN FRUIT AND VEGETABLE MARKET, BY END USER, 2018-2032 (USD THOUSAND)
TABLE 123 PHILIPPINES FOOD SERVICE SECTOR IN FROZEN FRUIT AND VEGETABLE MARKET, BY END USER,2018-2032 (USD THOUSAND)
TABLE 124 PHILIPPINES RESTAURANTS IN FROZEN FRUIT AND VEGETABLE MARKET, BY END USER,2018-2032 (USD THOUSAND)
TABLE 125 PHILIPPINES FROZEN FRUIT AND VEGETABLE MARKET, BY DISTRIBUTION CHANNEL,2018-2032 (USD THOUSAND)
TABLE 126 PHILIPPINES STORE-BASED RETAILERS IN FROZEN FRUIT AND VEGETABLE MARKET, BY DISTRIBUTION CHANNEL,2018-2032 (USD THOUSAND)
TABLE 127 PHILIPPINES NON-STORE RETAILERS IN FROZEN FRUIT AND VEGETABLE MARKET, BY DISTRIBUTION CHANNEL,2018-2032 (USD THOUSAND)
TABLE 128 THAILAND FROZEN FRUIT AND VEGETABLE MARKET, 2018-2032 (USD THOUSAND)
TABLE 129 THAILAND FROZEN FRUIT AND VEGETABLE MARKET, BY TYPE, 2018-2032 (USD THOUSAND)
TABLE 130 THAILAND FROZEN FRUIT AND VEGETABLE MARKET, BY TYPE, 2018-2032 (THOUSAND TONS)
TABLE 131 THAILAND FROZEN VEGETABLE IN FROZEN FRUIT AND VEGETABLE MARKET, BY TYPE, 2018-2032 (USD THOUSAND)
TABLE 132 THAILAND FROZEN FRUIT IN FROZEN FRUIT AND VEGETABLE MARKET, BY TYPE, 2018-2032 (USD THOUSAND)
TABLE 133 THAILAND BERRIES IN FROZEN FRUIT AND VEGETABLE MARKET, BY TYPE, 2018-2032 (USD THOUSAND)
TABLE 134 THAILAND FROZEN FRUIT AND VEGETABLE MARKET, BY CATEGORY, 2018-2032 (USD THOUSAND)
TABLE 135 THAILAND FROZEN FRUIT AND VEGETABLE MARKET, BY TECHNOLOGY, 2018-2032 (USD THOUSAND)
TABLE 136 THAILAND FROZEN FRUIT AND VEGETABLE MARKET, BY END USER, 2018-2032 (USD THOUSAND)
TABLE 137 THAILAND FOOD SERVICE SECTOR IN FROZEN FRUIT AND VEGETABLE MARKET, BY END USER,2018-2032 (USD THOUSAND)
TABLE 138 THAILAND RESTAURANTS IN FROZEN FRUIT AND VEGETABLE MARKET, BY END USER,2018-2032 (USD THOUSAND)
TABLE 139 THAILAND FROZEN FRUIT AND VEGETABLE MARKET, BY DISTRIBUTION CHANNEL,2018-2032 (USD THOUSAND)
TABLE 140 THAILAND STORE-BASED RETAILERS IN FROZEN FRUIT AND VEGETABLE MARKET, BY DISTRIBUTION CHANNEL,2018-2032 (USD THOUSAND)
TABLE 141 THAILAND NON-STORE RETAILERS IN FROZEN FRUIT AND VEGETABLE MARKET, BY DISTRIBUTION CHANNEL,2018-2032 (USD THOUSAND)
TABLE 142 SINGAPORE FROZEN FRUIT AND VEGETABLE MARKET, 2018-2032 (USD THOUSAND)
TABLE 143 SINGAPORE FROZEN FRUIT AND VEGETABLE MARKET, BY TYPE, 2018-2032 (USD THOUSAND)
TABLE 144 SINGAPORE FROZEN FRUIT AND VEGETABLE MARKET, BY TYPE, 2018-2032 (THOUSAND TONS)
TABLE 145 SINGAPORE FROZEN VEGETABLE IN FROZEN FRUIT AND VEGETABLE MARKET, BY TYPE, 2018-2032 (USD THOUSAND)
TABLE 146 SINGAPORE FROZEN FRUIT IN FROZEN FRUIT AND VEGETABLE MARKET, BY TYPE, 2018-2032 (USD THOUSAND)
TABLE 147 SINGAPORE BERRIES IN FROZEN FRUIT AND VEGETABLE MARKET, BY TYPE, 2018-2032 (USD THOUSAND)
TABLE 148 SINGAPORE FROZEN FRUIT AND VEGETABLE MARKET, BY CATEGORY, 2018-2032 (USD THOUSAND)
TABLE 149 SINGAPORE FROZEN FRUIT AND VEGETABLE MARKET, BY TECHNOLOGY, 2018-2032 (USD THOUSAND)
TABLE 150 SINGAPORE FROZEN FRUIT AND VEGETABLE MARKET, BY END USER, 2018-2032 (USD THOUSAND)
TABLE 151 SINGAPORE FOOD SERVICE SECTOR IN FROZEN FRUIT AND VEGETABLE MARKET, BY END USER,2018-2032 (USD THOUSAND)
TABLE 152 SINGAPORE RESTAURANTS IN FROZEN FRUIT AND VEGETABLE MARKET, BY END USER,2018-2032 (USD THOUSAND)
TABLE 153 SINGAPORE FROZEN FRUIT AND VEGETABLE MARKET, BY DISTRIBUTION CHANNEL,2018-2032 (USD THOUSAND)
TABLE 154 SINGAPORE STORE-BASED RETAILERS IN FROZEN FRUIT AND VEGETABLE MARKET, BY DISTRIBUTION CHANNEL,2018-2032 (USD THOUSAND)
TABLE 155 SINGAPORE NON-STORE RETAILERS IN FROZEN FRUIT AND VEGETABLE MARKET, BY DISTRIBUTION CHANNEL,2018-2032 (USD THOUSAND)
TABLE 156 NEW ZEALAND FROZEN FRUIT AND VEGETABLE MARKET, 2018-2032 (USD THOUSAND)
TABLE 157 NEW ZEALAND FROZEN FRUIT AND VEGETABLE MARKET, BY TYPE, 2018-2032 (USD THOUSAND)
TABLE 158 NEW ZEALAND FROZEN FRUIT AND VEGETABLE MARKET, BY TYPE, 2018-2032 (THOUSAND TONS)
TABLE 159 NEW ZEALAND FROZEN VEGETABLE IN FROZEN FRUIT AND VEGETABLE MARKET, BY TYPE, 2018-2032 (USD THOUSAND)
TABLE 160 NEW ZEALAND FROZEN FRUIT IN FROZEN FRUIT AND VEGETABLE MARKET, BY TYPE, 2018-2032 (USD THOUSAND)
TABLE 161 NEW ZEALAND BERRIES IN FROZEN FRUIT AND VEGETABLE MARKET, BY TYPE, 2018-2032 (USD THOUSAND)
TABLE 162 NEW ZEALAND FROZEN FRUIT AND VEGETABLE MARKET, BY CATEGORY, 2018-2032 (USD THOUSAND)
TABLE 163 NEW ZEALAND FROZEN FRUIT AND VEGETABLE MARKET, BY TECHNOLOGY, 2018-2032 (USD THOUSAND)
TABLE 164 NEW ZEALAND FROZEN FRUIT AND VEGETABLE MARKET, BY END USER, 2018-2032 (USD THOUSAND)
TABLE 165 NEW ZEALAND FOOD SERVICE SECTOR IN FROZEN FRUIT AND VEGETABLE MARKET, BY END USER,2018-2032 (USD THOUSAND)
TABLE 166 NEW ZEALAND RESTAURANTS IN FROZEN FRUIT AND VEGETABLE MARKET, BY END USER,2018-2032 (USD THOUSAND)
TABLE 167 NEW ZEALAND FROZEN FRUIT AND VEGETABLE MARKET, BY DISTRIBUTION CHANNEL,2018-2032 (USD THOUSAND)
TABLE 168 NEW ZEALAND STORE-BASED RETAILERS IN FROZEN FRUIT AND VEGETABLE MARKET, BY DISTRIBUTION CHANNEL,2018-2032 (USD THOUSAND)
TABLE 169 NEW ZEALAND NON-STORE RETAILERS IN FROZEN FRUIT AND VEGETABLE MARKET, BY DISTRIBUTION CHANNEL,2018-2032 (USD THOUSAND)
TABLE 170 MALAYSIA FROZEN FRUIT AND VEGETABLE MARKET, 2018-2032 (USD THOUSAND)
TABLE 171 MALAYSIA FROZEN FRUIT AND VEGETABLE MARKET, BY TYPE, 2018-2032 (USD THOUSAND)
TABLE 172 MALAYSIA FROZEN FRUIT AND VEGETABLE MARKET, BY TYPE, 2018-2032 (THOUSAND TONS)
TABLE 173 MALAYSIA FROZEN VEGETABLE IN FROZEN FRUIT AND VEGETABLE MARKET, BY TYPE, 2018-2032 (USD THOUSAND)
TABLE 174 MALAYSIA FROZEN FRUIT IN FROZEN FRUIT AND VEGETABLE MARKET, BY TYPE, 2018-2032 (USD THOUSAND)
TABLE 175 MALAYSIA BERRIES IN FROZEN FRUIT AND VEGETABLE MARKET, BY TYPE, 2018-2032 (USD THOUSAND)
TABLE 176 MALAYSIA FROZEN FRUIT AND VEGETABLE MARKET, BY CATEGORY, 2018-2032 (USD THOUSAND)
TABLE 177 MALAYSIA FROZEN FRUIT AND VEGETABLE MARKET, BY TECHNOLOGY, 2018-2032 (USD THOUSAND)
TABLE 178 MALAYSIA FROZEN FRUIT AND VEGETABLE MARKET, BY END USER, 2018-2032 (USD THOUSAND)
TABLE 179 MALAYSIA FOOD SERVICE SECTOR IN FROZEN FRUIT AND VEGETABLE MARKET, BY END USER,2018-2032 (USD THOUSAND)
TABLE 180 MALAYSIA RESTAURANTS IN FROZEN FRUIT AND VEGETABLE MARKET, BY END USER,2018-2032 (USD THOUSAND)
TABLE 181 MALAYSIA FROZEN FRUIT AND VEGETABLE MARKET, BY DISTRIBUTION CHANNEL,2018-2032 (USD THOUSAND)
TABLE 182 MALAYSIA STORE-BASED RETAILERS IN FROZEN FRUIT AND VEGETABLE MARKET, BY DISTRIBUTION CHANNEL,2018-2032 (USD THOUSAND)
TABLE 183 MALAYSIA NON-STORE RETAILERS IN FROZEN FRUIT AND VEGETABLE MARKET, BY DISTRIBUTION CHANNEL,2018-2032 (USD THOUSAND)
TABLE 184 AUSTRALIA FROZEN FRUIT AND VEGETABLE MARKET, 2018-2032 (USD THOUSAND)
TABLE 185 AUSTRALIA FROZEN FRUIT AND VEGETABLE MARKET, BY TYPE, 2018-2032 (USD THOUSAND)
TABLE 186 AUSTRALIA FROZEN FRUIT AND VEGETABLE MARKET, BY TYPE, 2018-2032 (THOUSAND TONS)
TABLE 187 AUSTRALIA FROZEN VEGETABLE IN FROZEN FRUIT AND VEGETABLE MARKET, BY TYPE, 2018-2032 (USD THOUSAND)
TABLE 188 AUSTRALIA FROZEN FRUIT IN FROZEN FRUIT AND VEGETABLE MARKET, BY TYPE, 2018-2032 (USD THOUSAND)
TABLE 189 AUSTRALIA BERRIES IN FROZEN FRUIT AND VEGETABLE MARKET, BY TYPE, 2018-2032 (USD THOUSAND)
TABLE 190 AUSTRALIA FROZEN FRUIT AND VEGETABLE MARKET, BY CATEGORY, 2018-2032 (USD THOUSAND)
TABLE 191 AUSTRALIA FROZEN FRUIT AND VEGETABLE MARKET, BY TECHNOLOGY, 2018-2032 (USD THOUSAND)
TABLE 192 AUSTRALIA FROZEN FRUIT AND VEGETABLE MARKET, BY END USER, 2018-2032 (USD THOUSAND)
TABLE 193 AUSTRALIA FOOD SERVICE SECTOR IN FROZEN FRUIT AND VEGETABLE MARKET, BY END USER,2018-2032 (USD THOUSAND)
TABLE 194 AUSTRALIA RESTAURANTS IN FROZEN FRUIT AND VEGETABLE MARKET, BY END USER,2018-2032 (USD THOUSAND)
TABLE 195 AUSTRALIA FROZEN FRUIT AND VEGETABLE MARKET, BY DISTRIBUTION CHANNEL,2018-2032 (USD THOUSAND)
TABLE 196 AUSTRALIA STORE-BASED RETAILERS IN FROZEN FRUIT AND VEGETABLE MARKET, BY DISTRIBUTION CHANNEL,2018-2032 (USD THOUSAND)
TABLE 197 AUSTRALIA NON-STORE RETAILERS IN FROZEN FRUIT AND VEGETABLE MARKET, BY DISTRIBUTION CHANNEL,2018-2032 (USD THOUSAND)
TABLE 198 REST OF ASIA-PACIFIC FROZEN FRUIT AND VEGETABLE MARKET, 2018-2032 (USD THOUSAND)
TABLE 199 REST OF ASIA-PACIFIC FROZEN FRUIT AND VEGETABLE MARKET, BY TYPE, 2018-2032 (USD THOUSAND)
TABLE 200 REST OF ASIA-PACIFIC FROZEN FRUIT AND VEGETABLE MARKET, BY TYPE, 2018-2032 (THOUSAND TONS)
List of Figure
FIGURE 1 ASIA-PACIFIC FROZEN FRUIT AND VEGETABLE MARKET: SEGMENTATION
FIGURE 2 ASIA-PACIFIC FROZEN FRUIT AND VEGETABLE MARKET: DATA TRIANGULATION
FIGURE 3 ASIA-PACIFIC FROZEN FRUIT AND VEGETABLE MARKET: DROC ANALYSIS
FIGURE 4 ASIA-PACIFIC FROZEN FRUIT AND VEGETABLE MARKET: ASIA-PACIFIC VS REGIONAL MARKET ANALYSIS
FIGURE 5 ASIA-PACIFIC FROZEN FRUIT AND VEGETABLE MARKET COMPANY RESEARCH ANALYSIS
FIGURE 6 ASIA-PACIFIC FROZEN FRUIT AND VEGETABLE MARKET: INTERVIEW DEMOGRAPHICS
FIGURE 7 ASIA-PACIFIC FROZEN FRUIT AND VEGETABLE MARKET: DBMR MARKET POSITION GRID
FIGURE 8 MARKET TYPE COVERAGE GRID
FIGURE 9 ASIA-PACIFIC FROZEN FRUIT AND VEGETABLE MARKET: VENDOR SHARE ANALYSIS
FIGURE 10 ASIA-PACIFIC FROZEN FRUIT AND VEGETABLE MARKET: SEGMENTATION
FIGURE 11 EXECUTIVE SUMMARY
FIGURE 12 TWO SEGMENTS COMPRISE THE ASIA-PACIFIC FROZEN FRUIT AND VEGETABLE MARKET BY TYPE – 2032
FIGURE 13 STRATEGIC DECISIONS
FIGURE 14 GROWING URBANIZATION AND INCREASED ADOPTION OF HEALTHY LIFESTYLE COUPLED WITH INCREASING DEMAND FOR FRUITS AND VEGETABLES WITH LONGER SHELF-LIFE IS LEADING THE GROWTH OF THE ASIA-PACIFIC FROZEN FRUIT AND VEGETABLE MARKET IN THE FORECAST PERIOD OF 2025 TO 2032
FIGURE 15 TYPE SEGMENT IS EXPECTED TO ACCOUNT FOR THE LARGEST SHARE OF THE ASIA-PACIFIC FROZEN FRUIT AND VEGETABLE MARKET IN 2025 & 2032
FIGURE 16 SUPPLY CHAIN ANALYSIS
FIGURE 17 DRIVERS, RESTRAINTS, OPPORTUNITIES, AND CHALLENGES OF ASIA-PACIFIC FROZEN FRUIT AND VEGETABLE MARKET
FIGURE 18 ASIA-PACIFIC FROZEN FRUIT AND VEGETABLE MARKET: BY TYPE, 2024
FIGURE 19 ASIA-PACIFIC FROZEN FRUIT AND VEGETABLE MARKET: BY CATEGORY, 2024
FIGURE 20 ASIA-PACIFIC FROZEN FRUIT AND VEGETABLE MARKET: BY TECHNOLOGY, 2024
FIGURE 21 ASIA-PACIFIC FROZEN FRUIT AND VEGETABLE MARKET: BY END USER, 2024
FIGURE 22 ASIA-PACIFIC FROZEN FRUIT AND VEGETABLE MARKET: BY DISTRIBUTION CHANNEL, 2024
FIGURE 23 ASIA-PACIFIC FROZEN FRUIT AND VEGETABLE MARKET: SNAPSHOT (2024)
FIGURE 24 ASIA-PACIFIC FROZEN FRUITS AND VEGETABLES MARKET: COMPANY SHARE 2024 (%)
Asia Pacific Frozen Fruits And Vegetables Market, Supply Chain Analysis and Ecosystem Framework
To support market growth and help clients navigate the impact of geopolitical shifts, DBMR has integrated in-depth supply chain analysis into its Asia Pacific Frozen Fruits And Vegetables Market research reports. This addition empowers clients to respond effectively to global changes affecting their industries. The supply chain analysis section includes detailed insights such as Asia Pacific Frozen Fruits And Vegetables Market consumption and production by country, price trend analysis, the impact of tariffs and geopolitical developments, and import and export trends by country and HSN code. It also highlights major suppliers with data on production capacity and company profiles, as well as key importers and exporters. In addition to research, DBMR offers specialized supply chain consulting services backed by over a decade of experience, providing solutions like supplier discovery, supplier risk assessment, price trend analysis, impact evaluation of inflation and trade route changes, and comprehensive market trend analysis.
Data collection and base year analysis are done using data collection modules with large sample sizes. The stage includes obtaining market information or related data through various sources and strategies. It includes examining and planning all the data acquired from the past in advance. It likewise envelops the examination of information inconsistencies seen across different information sources. The market data is analysed and estimated using market statistical and coherent models. Also, market share analysis and key trend analysis are the major success factors in the market report. To know more, please request an analyst call or drop down your inquiry.
The key research methodology used by DBMR research team is data triangulation which involves data mining, analysis of the impact of data variables on the market and primary (industry expert) validation. Data models include Vendor Positioning Grid, Market Time Line Analysis, Market Overview and Guide, Company Positioning Grid, Patent Analysis, Pricing Analysis, Company Market Share Analysis, Standards of Measurement, Global versus Regional and Vendor Share Analysis. To know more about the research methodology, drop in an inquiry to speak to our industry experts.
Data Bridge Market Research is a leader in advanced formative research. We take pride in servicing our existing and new customers with data and analysis that match and suits their goal. The report can be customized to include price trend analysis of target brands understanding the market for additional countries (ask for the list of countries), clinical trial results data, literature review, refurbished market and product base analysis. Market analysis of target competitors can be analyzed from technology-based analysis to market portfolio strategies. We can add as many competitors that you require data about in the format and data style you are looking for. Our team of analysts can also provide you data in crude raw excel files pivot tables (Fact book) or can assist you in creating presentations from the data sets available in the report.


