
Asia Pacific Graphite Market
Market Size in USD Million
 USD
8,810,314.29 Million
USD
15,913,167.87 Million
2022
2030
USD
8,810,314.29 Million
USD
15,913,167.87 Million
2022
2030
| 2023 - 2030 | |
| USD 8,810,314.29 Million | |
| USD 15,913,167.87 Million | |
| % | |
Asia-Pacific Graphite Market Analysis and Size
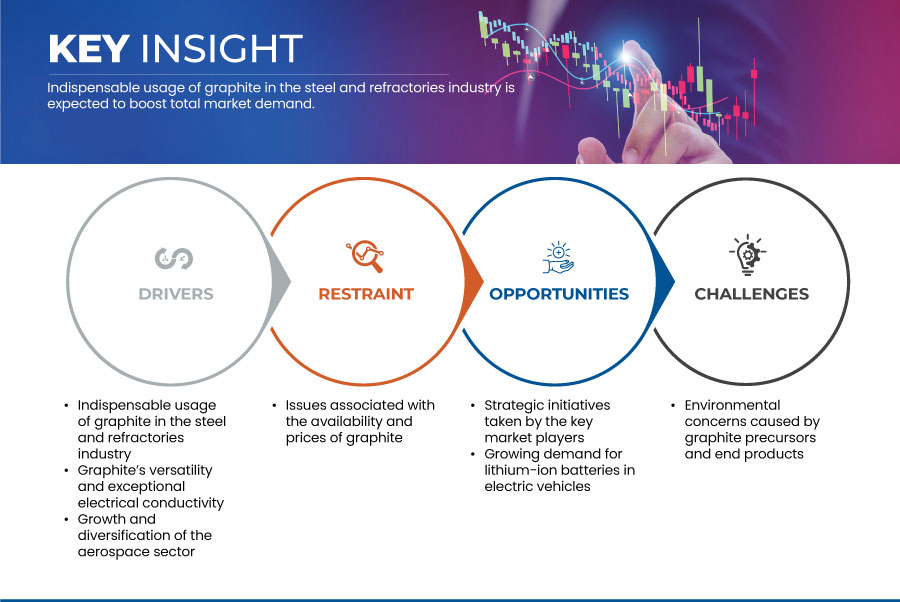
The indispensable usage of graphite in the steel and refractories industry and graphite’s versatility and exceptional electrical conductivity make it a fundamental material in the consumer electronics industry are some of the factors driving the market growth. However, the major restraint negatively impacting the market growth is issues associated with the availability and prices of graphite and its precursors.
Strategic initiatives taken by the key market players are expected to provide opportunities for market growth. However, environmental concerns caused by graphite precursors and end products are projected to challenge the market growth.
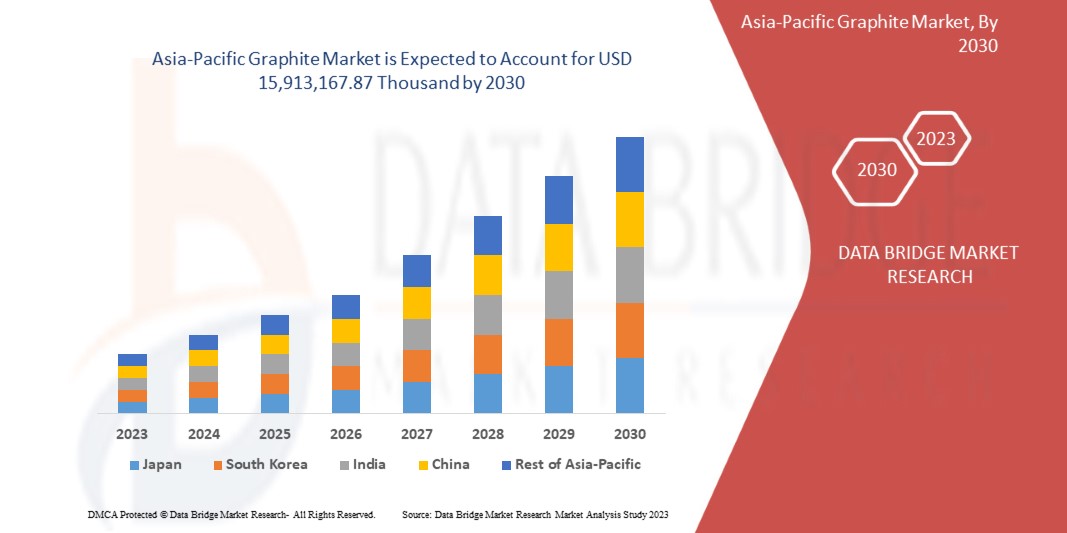
Data Bridge Market Research analyzes that the Asia-Pacific graphite market is expected to reach USD 15,913,167.87 thousand by 2030 from USD 8,810,314.29 thousand in 2022, growing with a substantial CAGR of 7.8% in the forecast period of 2023 to 2030.
|
Report Metric |
Details |
|
Forecast Period |
2023 to 2030 |
|
Base Year |
2022 |
|
Historic Year |
2021 (Customizable 2015-2020) |
|
Quantitative Units |
Revenue in USD Thousand |
|
Segments Covered |
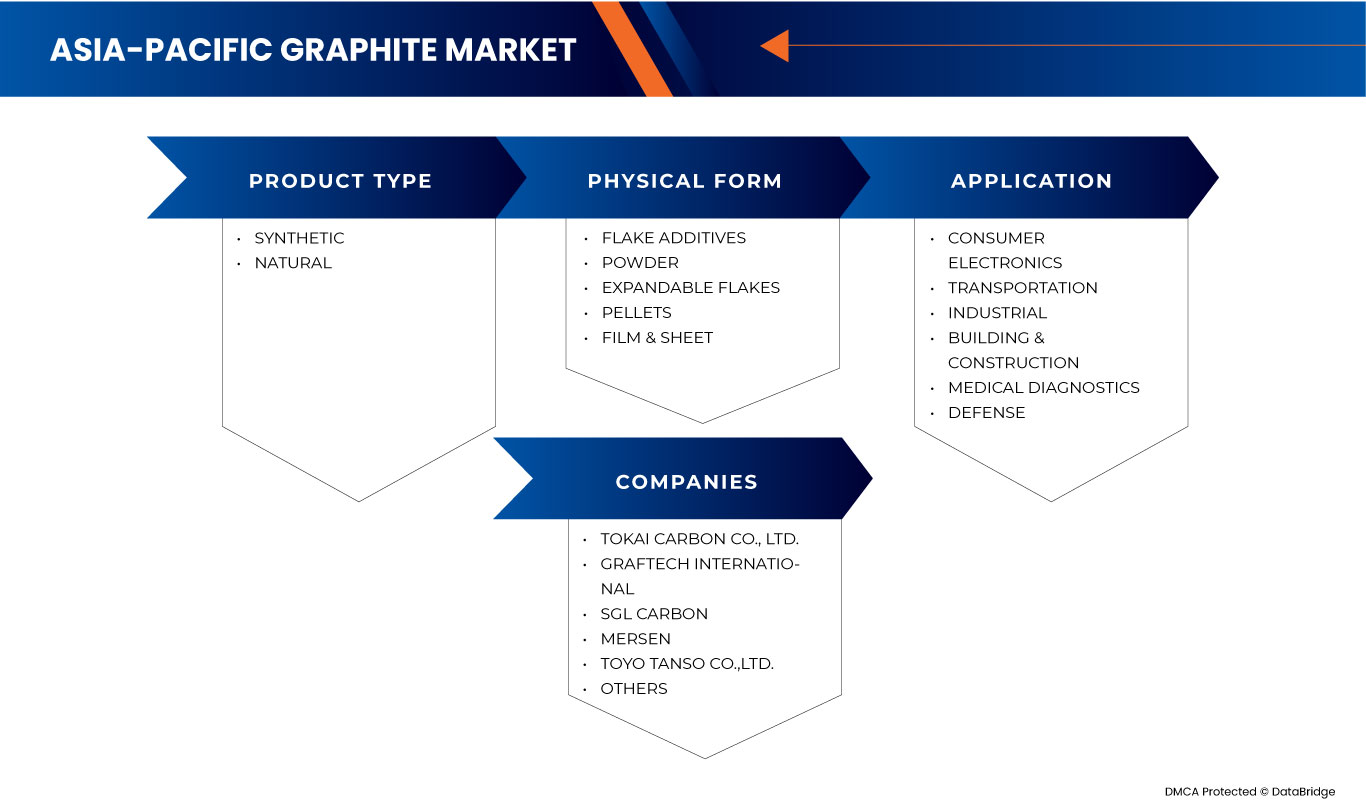
Product Type (Synthetic and Natural), Physical Form (Flake Additives, Powder, Expandable Flakes, Pellets, and Film & Sheet), Application (Consumer Electronics, Transportation, Industrial, Building & Construction, Medical Diagnostics, and Defense) |
|
Countries Covered |
China, Japan, India, South Korea, Australia, Thailand, Singapore, Philippines, Malaysia, Indonesia, and Rest of Asia-Pacific |
|
Market Players Covered |
TOKAI CARBON, GrafTech International, SGL Carbon, Mersen, Toyo Tanso Co., Ltd., HEG Limited, Nippon Carbon Co Ltd., Superior Graphite, Qingdao Tennry Carbon Co., Ltd., and Resonac Holdings Corporation, among others |
Market Definition
Graphite is a naturally occurring form of carbon that is a key industrial material used for various purposes. It is primarily composed of carbon atoms arranged in a hexagonal lattice structure. In the market context, graphite is typically defined as a mineral that is mined and processed for its unique properties, which include high conductivity, high-temperature resistance, and lubrication qualities. Graphite is widely used as an essential component in various industries, such as metallurgy, electronics, automotive, aerospace, and energy, where it serves as a crucial material in applications, such as electrodes, lubricants, refractories, and as a structural material in the form of composites.
Asia-Pacific Graphite Market Dynamics
This section deals with understanding the market drivers, advantages, opportunities, restraints, and challenges. All of these are discussed in detail below:
Drivers
- Indispensable Usage of Graphite in the Steel and Refractories Industry
The primary application of synthetic graphite is in manufacturing graphite electrodes, which are capable of handling extremely high electrical currents. These electrodes are formed by shaping synthetic graphite immediately after its production. The graphite electrodes are critical in Electric Arc Furnace (EAF) steelmaking. They serve as conductive materials that transfer electrical energy to the EAF, where they create high-temperature arcs to melt steel scrap and other raw materials. Graphite electrodes must withstand extreme heat and mechanical stress during this process. Graphite is used to line ladles and other vessels used in the steelmaking process. It provides excellent thermal resistance, allowing for the transportation of molten steel from the furnace to the casting area.
Graphite additives are used to produce refractory materials for high-temperature environments such as the linings for furnaces, kilns, incinerators, and reactors. Refractories are the second-largest market for graphite after electrodes. Graphite is used to increase the effectiveness of the final refractory product by increasing thermal conductivity, decreasing the thermal gradient between the hot and cold faces of the product, thereby reducing expansion, repelling molten slag, increasing the working life of the product, increasing the ability of the product to withstand thermal shocks/corrosion thereby, improving performance at higher temperatures, and reducing wettability to molten metals so that they do not affect the end-product.
Graphite's unique properties make it indispensable in the steel and refractories industry, where it contributes to the efficiency, safety, and overall quality of steel production processes and related applications, which is driving the market growth.
- Versatility and Exceptional Electrical Conductivity of Graphite
Graphite emerges as a crucial component in various electronic device design and functionality aspects. Its remarkable properties have enabled the seamless integration of advanced technologies into people’s daily lives from its role in batteries that power smartphones and laptops to its presence in thermal management solutions and even as a fundamental component in touchscreens.
It is used as an anode material in lithium-ion batteries, which are widely used in smartphones, laptops, and other portable electronic devices. The graphite anode helps store and release electrical energy efficiently. It is also used in thermal management solutions such as graphite heat sinks and Thermal Interface Materials (TIMs) to dissipate heat from electronic components, ensuring they operate at optimal temperatures. Electronic devices, especially those with touchscreens or keyboards, use graphite as a lubricant or as a component in conductive inks to facilitate smooth and reliable touch or keypress interactions.
Opportunity
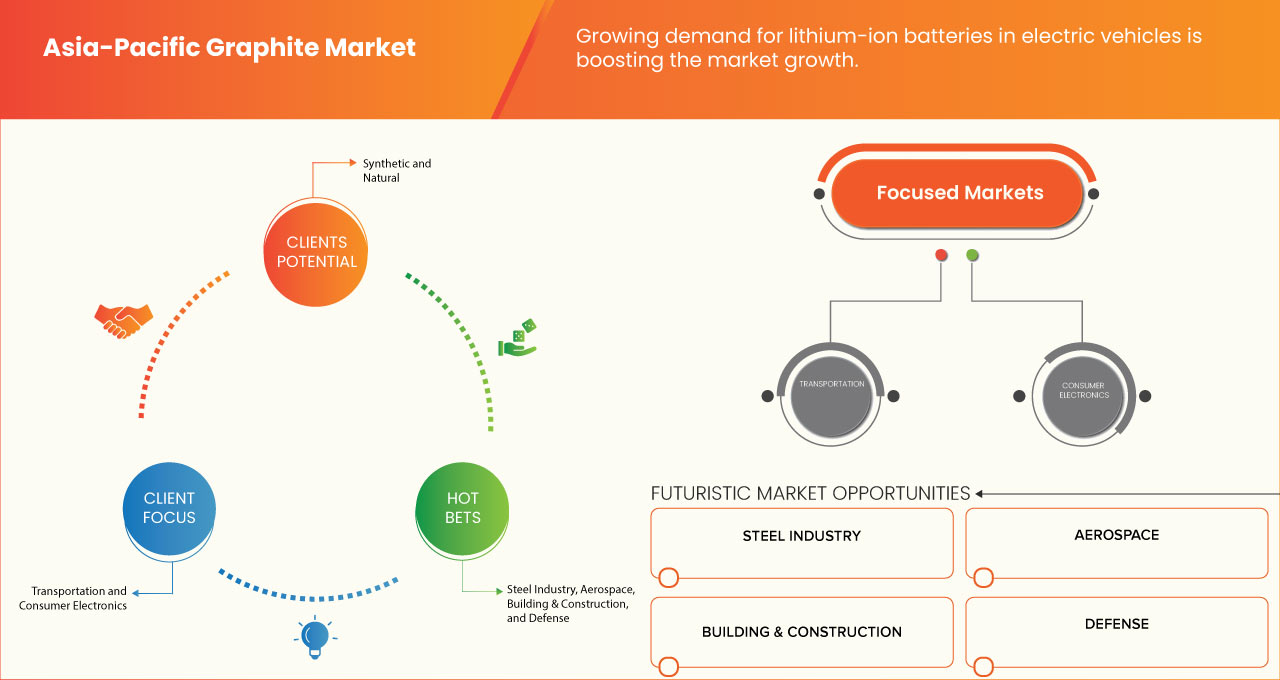
- Growing Demand for Lithium-Ion Batteries in Electric Vehicles
The shift towards cleaner and more sustainable transportation solutions has led to a substantial increase in the adoption of EVs. This trend is driven by environmental concerns, government incentives, and consumer preference for EVs. Lithium-ion battery technology has improved significantly in terms of energy density, charging speed, and overall performance. These advancements have made lithium-ion batteries the preferred choice for EV manufacturers.
Therefore, the growing demand for electric vehicles and their associated lithium-ion batteries is expected to accelerate as these factors continue to evolve, which is expected to create opportunities for market growth.
Restraint/Challenge
- Issues Associated with the Availability and Prices of Graphite
Issues associated with the availability and prices of graphite and its precursors pose significant limitations that are restraining the market growth. Graphite, a critical industrial material with diverse applications, faces several factors affecting its availability and pricing, thereby impacting the overall market dynamics.
One key issue is the geographical concentration of graphite production. A significant portion of the world's natural graphite is sourced from a few countries, primarily China. This concentration creates supply chain vulnerabilities and exposes the Asia-Pacific market to geopolitical and trade-related risks. Disruptions in supply, such as export restrictions or fluctuations in production, can lead to supply shortages and price volatility, affecting industries dependent on graphite, including the automotive, aerospace, and battery manufacturing sectors. Another factor affecting graphite availability is the reliance on precursor materials, primarily flake graphite and synthetic graphite, in various industries. Natural flake graphite is used extensively in battery manufacturing for Electric Vehicles (EVs) and energy storage applications. Meanwhile, synthetic graphite is crucial in the production of electrodes for lithium-ion batteries. The demand for these precursors is surging due to the Asia-Pacific push for clean energy and EV adoption. This heightened demand can strain precursor supply chains, impacting their availability and, in turn, the production of graphite-based products.
Recent Developments
- In July 2023, Mersen, a global leader in electrical power and advanced materials, officially inaugurated its Columbia manufacturing facility in the U.S. This 240,000-square meter site, acquired in 2019, has undergone significant investment totaling nearly USD 70.00 million over the past four years to expand its production capabilities, focusing on extruded and isostatic graphite. The facility is strategically positioned to meet the growing demand, particularly in the semiconductor market. Mersen's 2027 plan includes a target to increase isostatic graphite manufacturing capacity globally to 16,000 tons by the end of 2024. This expansion reinforces Mersen's commitment to sustainable development markets, with a specific focus on the SiC semiconductor market
- In April 2023, GrafTech International Ltd., a prominent producer of top-notch graphite electrode products crucial for electric arc furnace steel production, officially unveiled a new sales office in Dubai, U.A.E. The inauguration of the latest sales office in Dubai underscores their strategic approach to conducting business on a worldwide scale. Equipped with seasoned sales and customer service teams across the globe, the company is focused on providing extensive assistance to GrafTech's global customer base
- In September 2022, Showa Denko K.K. (SDK) and Showa Denko Materials Co., Ltd. (SDMC) merged to create "Resonac," with SDK becoming "Resonac Holdings Corporation" and SDMC transforming into "Resonac Corporation" as of January 1, 2023. This strategic move aims to establish Resonac as a global leader in advanced functional materials within the chemical industry. The newly integrated company will boast substantial net sales, largely driven by semiconductor and electronic materials, particularly in the "back-end process." Resonac seeks to achieve synergy, innovation, and the development of new market values by combining SDK's stable businesses with SDMC's growth potential. Special focus will be placed on the semiconductor and electronic materials sector, ensuring the company maintains net sales exceeding 1 trillion while maintaining an EBITDA margin of over 20%
- In February 2019, according to Axios, the growing demand for graphite in lithium-ion batteries, driven by the expanding electric vehicle market, has raised environmental concerns in China. Graphite mining and production processes generate particulate air pollutants, posing respiratory health risks. In addition, harsh chemicals used in production are often discharged into the environment, potentially disrupting local ecosystems. Since 2010, pollution control inspections have shifted from local authorities to the central government in an effort to address these environmental issues
Asia-Pacific Graphite Market Scope
The Asia-Pacific graphite market is segmented into three notable segments based on product type, physical form, and application. The growth amongst these segments will help you analyze major growth segments in the industries and provide the users with a valuable market overview and market insights to help them make strategic decisions for identifying core market applications.
Product Type
- Synthetic
- Natural
On the basis of product type, the market is segmented into synthetic and natural.
Physical Form
- Flake Additives
- Powder
- Expandable Flakes
- Pellets
- Film & sheet
On the basis of physical form, the market is segmented into flake additives, powder, expandable flakes, pellets, and film & sheet.
Application
- Consumer Electronics
- Transportation
- Industrial
- Building & Construction
- Medical Diagnostics
- Defense
On the basis application, the market is segmented into consumer electronics, transportation, industrial, building & construction, medical diagnostics, and defense.
Asia-Pacific Graphite Market Regional Analysis/Insights
The Asia-Pacific graphite market is analyzed and market size insights and trends are provided by product type, physical form, and application as referenced above.
The countries covered in this market report are China, Japan, India, South Korea, Australia, Thailand, Singapore, Philippines, Malaysia, Indonesia, and Rest of Asia-Pacific.
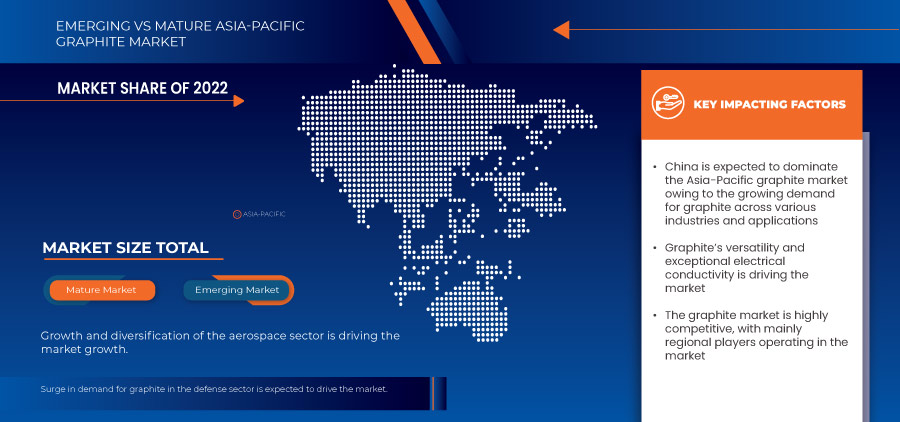
China is expected to dominate the Asia-Pacific graphite market due to its abundant graphite resources, low production costs, and high demand for graphite in industrial applications such as steel production and lithium-ion batteries.
The country section of the report also provides individual market-impacting factors and changes in market regulation that impact the current and future trends of the market. Data points such as downstream and upstream value chain analysis, technical trends, Porter's five forces analysis, and case studies are some of the pointers used to forecast the market scenario for individual countries. Also, the presence and availability of regional brands and their challenges faced due to large or scarce competition from local and domestic brands, the impact of domestic tariffs, and trade routes are considered while providing forecast analysis of the country data.
Competitive Landscape and Asia-Pacific Graphite Market Share Analysis
The Asia-Pacific graphite market competitive landscape provides details of competitors. Details included are company overview, company financials, revenue generated, market potential, investment in research and development, new market initiatives, regional presence, production sites and facilities, production capacities, company strengths and weaknesses, product launch, product width and breadth, and application dominance. The above data points provided are only related to the companies' focus on the market.
Some of the major players operating in the Asia-Pacific graphite market are TOKAI CARBON, GrafTech International, SGL Carbon, Mersen, Toyo Tanso Co., Ltd., HEG Limited, Nippon Carbon Co Ltd., Superior Graphite, Qingdao Tennry Carbon Co., Ltd., and Resonac Holdings Corporation, among others.
SKU-

- Interactive Data Analysis Dashboard
- Company Analysis Dashboard for high growth potential opportunities
- Research Analyst Access for customization & queries
- Competitor Analysis with Interactive dashboard
- Latest News, Updates & Trend analysis
- Harness the Power of Benchmark Analysis for Comprehensive Competitor Tracking
Table of Content
1 INTRODUCTION
1.1 OBJECTIVES OF THE STUDY
1.2 MARKET DEFINITION
1.3 OVERVIEW OF ASIA-PACIFIC GRAPHITE MARKET
1.4 LIMITATIONS
1.5 MARKETS COVERED
2 MARKET SEGMENTATION
2.1 MARKETS COVERED
2.2 GEOGRAPHICAL SCOPE
2.3 YEARS CONSIDERED FOR THE STUDY
2.4 CURRENCY AND PRICING
2.5 DBMR TRIPOD DATA VALIDATION MODEL
2.6 MULTIVARIATE MODELING
2.7 PRIMARY INTERVIEWS WITH KEY OPINION LEADERS
2.8 DBMR MARKET POSITION GRID
2.9 MARKET APPLICATION COVERAGE GRID
2.1 DBMR VENDOR SHARE ANALYSIS
2.11 SECONDARY SOURCES
2.12 ASSUMPTIONS
3 EXECUTIVE SUMMARY
4 PREMIUM INSIGHTS
5 MARKET OVERVIEW
5.1 DRIVERS
5.1.1 INDISPENSABLE USAGE OF GRAPHITE IN THE STEEL AND REFRACTORIES INDUSTRY
5.1.2 GRAPHITE'S VERSATILITY AND EXCEPTIONAL ELECTRICAL CONDUCTIVITY
5.1.3 GROWTH AND DIVERSIFICATION OF THE AEROSPACE SECTOR
5.1.4 SURGE IN DEMAND FOR GRAPHITE IN THE DEFENSE SECTOR
5.2 RESTRAINT
5.2.1 ISSUES ASSOCIATED WITH THE AVAILABILITY AND PRICES OF GRAPHITE
5.3 OPPORTUNITIES
5.3.1 STRATEGIC INITIATIVES TAKEN BY THE KEY MARKET PLAYERS
5.3.2 GROWING DEMAND FOR LITHIUM-ION BATTERIES IN ELECTRIC VEHICLES
5.4 CHALLENGE
5.4.1 ENVIRONMENTAL CONCERNS CAUSED BY GRAPHITE PRECURSORS AND END PRODUCTS
6 ASIA-PACIFIC GRAPHITE MARKET, BY PRODUCT TYPE
6.1 OVERVIEW
6.2 SYNTHETIC
6.3 NATURAL
7 ASIA-PACIFIC GRAPHITE MARKET, BY PHYSICAL FORM
7.1 OVERVIEW
7.2 FLAKE ADDITVES
7.3 POWDER
7.4 EXPANDABLE FLAKE
7.5 PELLETS
7.6 FILM & SHEET
8 ASIA-PACIFIC GRAPHITE MARKET, BY APPLICATION
8.1 OVERVIEW
8.2 CONSUMER ELECTRONICS
8.2.1 CONSUMER ELECTRONICS, B Y APPLICATION
8.2.1.1 LAPTOP/TABLET
8.2.1.2 MOBILE
8.2.1.3 DISPLAY (OLED, LCD, LED)
8.2.1.4 POWER ELECTRONICS
8.2.1.5 LED LIGTHNING
8.2.1.6 SET-TOP BOX ENCLOSURES
8.2.2 CONSUMER ELECTRONICS, BY PHYSICAL FORM
8.2.2.1 FILM & SHEET
8.2.2.2 POWDER
8.2.2.3 FLAKE ADDITIVES
8.2.2.4 EXPANDABLE FLAKE
8.3 TRANSPORTATION
8.3.1 TRANSPORTATION, BY APPLICATION
8.3.1.1 BATTERIES
8.3.1.1.1 EV
8.3.1.1.2 ELECTRIC GROUND TRANSPORTATION
8.3.1.1.3 AERO
8.3.1.1.4 MARINE
8.3.1.1.5 SPORT/SNOWMOBILES
8.3.1.1.6 CHARGERS
8.3.1.2 FUEL CELLS
8.3.1.2.1 AUTO & LIGHT TRUCK
8.3.1.2.2 GROUND TRANSPORTATION
8.3.1.2.3 AERO
8.3.1.2.4 MARINE
8.3.1.2.5 PORTABLE AUXILIARY POWER UNITS
8.3.1.2.6 MATERIAL HANDLING
8.3.1.3 INTERNAL COMBUSTION ENGINES
8.3.1.4 INTERIOR
8.3.1.4.1 CLIMATE CONTROL
8.3.1.4.2 SEATING
8.3.1.5 EXTERIOR
8.3.2 TRANSPORTATION, BY PHYSICAL FORM
8.3.2.1 POWDER
8.3.2.2 FLAKE ADDITIVES
8.3.2.3 EXPANDABLE FLAKE
8.3.2.4 PELLETS
8.3.2.5 FILM & SHEET
8.4 INDUSTRIAL
8.4.1 INDUSTRIAL, B Y APPLICATION
8.4.2 FLUID SEALS
8.4.3 PIPE GASKETS
8.4.4 VALVE PACKING
8.4.5 INDUSTRIAL, BY PHYSICAL FORM
8.4.6 FLAKE ADDITIVES
8.4.7 EXPANDABLE FLAKE
8.4.8 POWDER
8.4.9 FILM & SHEET
8.4.10 PELLETS
8.5 BUILDING & CONSTRUCTION
8.5.1 BUILDING & CONSTRUCTION, BY APPLICATION
8.5.2 INSULATION FOAM
8.5.3 FIRESTOP (INTUMESCENT) COATINGS, PASTES AND PUTTIES
8.5.4 CONCRETE
8.5.5 COATINGS
8.5.6 ROOFING
8.5.7 WALL COVERINGS
8.5.8 ADHESIVES
8.5.9 EXPANSION JOINTS
8.5.10 BUILDING & CONSTRUCTION, BY PHYSICAL FORM
8.5.11 EXPANDABLE FLAKE
8.5.12 FLAKE ADDITIVES
8.5.13 POWDER
8.5.14 FILM & SHEET
8.5.15 PELLETS
8.6 MEDICAL DIAGNOSTICS
8.6.1 MEDICAL DIAGNOSTICS, BY PHYSICAL FORM
8.6.2 FLAKE ADDITIVES
8.6.3 POWDER
8.6.4 FILM & SHEET
8.6.5 EXPANDABLE FLAKE
8.6.6 PELLETS
8.7 DEFENSE
8.7.1 DEFENSE, BY PHYSICAL FORM
8.7.2 FLAKE ADDITIVES
8.7.3 EXPANDABLE FLAKE
8.7.4 POWDER
8.7.5 PELLETS
8.7.6 FILM & SHEET
9 ASIA-PACIFIC GRAPHITE MARKET, BY COUNTRY
9.1 ASIA PACIFIC
9.1.1 CHINA
9.1.2 INDIA
9.1.3 SOUTH KOREA
9.1.4 JAPAN
9.1.5 THAILAND
9.1.6 INDONESIA
9.1.7 SINGAPORE
9.1.8 MALAYSIA
9.1.9 AUSTRALIA
9.1.10 PHILIPPINES
9.1.11 REST OF ASIA-PACIFIC
10 ASIA-PACIFIC GRAPHITE MARKET: COMPANY LANDSCAPE
10.1 COMPANY SHARE ANALYSIS: ASIA-PACIFIC
11 SWOT ANALYSIS
12 COMPANY PROFILES
12.1 TOKAI CARBON CO., LTD.
12.1.1 COMPANY SNAPSHOT
12.1.2 REVENUE ANALYSIS
12.1.3 PRODUCT PORTFOLIO
12.1.4 RECENT DEVELOPMENT
12.2 GRAFTECH INTERNATIONAL
12.2.1 COMPANY SNAPSHOT
12.2.2 REVENUE ANALYSIS
12.2.3 PRODUCT PORTFOLIO
12.2.4 RECENT DEVELOPMENTS
12.3 SGL CARBON
12.3.1 COMPANY SNAPSHOT
12.3.2 REVENUE ANALYSIS
12.3.3 PRODUCT PORTFOLIO
12.3.4 RECENT DEVELOPMENT
12.4 MERSEN
12.4.1 COMPANY SNAPSHOT
12.4.2 REVENUE ANALYSIS
12.4.3 PRODUCT PORTFOLIO
12.4.4 RECENT DEVELOPMENTS
12.5 TOYO TANSCO CO., LTD.
12.5.1 COMPANY SNAPSHOT
12.5.2 REVENUE ANALYSIS
12.5.3 PRODUCT PORTFOLIO
12.5.4 RECENT DEVELOPMENT
12.6 HEG LIMITED
12.6.1 COMPANY SNAPSHOT
12.6.2 REVENUE ANALYSIS
12.6.3 PRODUCT PORTFOLIO
12.6.4 RECENT DEVELOPMENT
12.7 NIPPON CARBON CO LTD.
12.7.1 COMPANY SNAPSHOT
12.7.2 REVENUE ANALYSIS
12.7.2 RECENT DEVELOPMENT
12.8 QINGDAO TENNRY CARBON CO., LTD
12.8.1 COMPANY SNAPSHOT
12.8.2 PRODUCT PORTFOLIO
12.8.3 RECENT DEVELOPMENT
12.9 RESONAC HOLDINGS CORPORATION
12.9.1 COMPANY SNAPSHOT
12.9.2 REVENUE ANALYSIS
12.9.3 PRODUCT PORTFOLIO
12.9.4 RECENT DEVELOPMENTS
12.1 SUPERIOR GRAPHITE
12.10.1 COMPANY SNAPSHOT
12.10.2 PRODUCT PORTFOLIO
12.10.3 RECENT DEVELOPMENT
13 QUESTIONNAIRE
14 RELATED REPORTS
List of Table
TABLE 1 ASIA-PACIFIC GRAPHITE MARKET, BY PRODUCT TYPE, 2021-2030 (USD THOUSAND)
TABLE 2 ASIA-PACIFIC GRAPHITE MARKET, BY PHYSICAL FORM, 2021-2030 (USD THOUSAND)
TABLE 3 ASIA-PACIFIC GRAPHITE MARKET, BY APPLICATION, 2021-2030 (USD THOUSAND)
TABLE 4 ASIA-PACIFIC CONSUMER ELECTRONICS IN GRAPHITE MARKET, BY APPLICATION, 2021-2030 (USD THOUSAND)
TABLE 5 ASIA-PACIFIC CONSUMER ELECTRONICS IN GRAPHITE MARKET, BY PHYSICAL FORM, 2021-2030 (USD THOUSAND)
TABLE 6 ASIA-PACIFIC TRANSPORTATION IN GRAPHITE MARKET, BY APPLICATION, 2021-2030 (USD THOUSAND)
TABLE 7 ASIA-PACIFIC BATTERIES IN GRAPHITE MARKET, BY APPLICATION, 2021-2030 (USD THOUSAND)
TABLE 8 ASIA-PACIFIC FUEL CELLS IN GRAPHITE MARKET, BY APPLICATION, 2021-2030 (USD THOUSAND)
TABLE 9 ASIA-PACIFIC INTERIOR IN GRAPHITE MARKET, BY APPLICATION, 2021-2030 (USD THOUSAND)
TABLE 10 ASIA-PACIFIC TRANSPORTATION IN GRAPHITE MARKET, BY PHYSICAL FORM, 2021-2030 (USD THOUSAND)
TABLE 11 ASIA-PACIFIC INDUSTRIAL IN GRAPHITE MARKET, BY APPLICATION, 2021-2030 (USD THOUSAND)
TABLE 12 ASIA-PACIFIC INDUSTRIAL IN GRAPHITE MARKET, BY PHYSICAL FORM, 2021-2030 (USD THOUSAND)
TABLE 13 ASIA-PACIFIC BUILDING & CONSTRUCTION IN GRAPHITE MARKET, BY APPLICATION, 2021-2030 (USD THOUSAND)
TABLE 14 ASIA-PACIFIC BUILDING & CONSTRUCTION IN GRAPHITE MARKET, BY PHYSICAL FORM, 2021-2030 (USD THOUSAND)
TABLE 15 ASIA-PACIFIC MEDICAL DIAGNOSTICS IN GRAPHITE MARKET, BY PHYSICAL FORM, 2021-2030 (USD THOUSAND)
TABLE 16 ASIA-PACIFIC DEFENSE IN GRAPHITE MARKET, BY PHYSICAL FORM, 2021-2030 (USD THOUSAND)
TABLE 17 ASIA-PACIFIC GRAPHITE MARKET, BY COUNTRY, 2021-2030 (USD THOUSAND)
TABLE 18 CHINA GRAPHITE MARKET, BY PRODUCT TYPE 2021-2030 (USD THOUSAND)
TABLE 19 CHINA GRAPHITE MARKET, BY PHYSICAL FORM, 2021-2030 (USD THOUSAND)
TABLE 20 CHINA GRAPHITE MARKET, BY APPLICATION, 2021-2030 (USD THOUSAND)
TABLE 21 CHINA CONSUMER ELECTRONICS IN GRAPHITE MARKET, BY APPLICATION, 2021-2030 (USD THOUSAND)
TABLE 22 CHINA CONSUMER ELECTRONICS IN GRAPHITE MARKET, BY PHYSICAL FORM, 2021-2030 (USD THOUSAND)
TABLE 23 CHINA TRANSPORTATION IN GRAPHITE MARKET, BY APPLICATION, 2021-2030 (USD THOUSAND)
TABLE 24 CHINA BATTERIES IN GRAPHITE MARKET, BY APPLICATION, 2021-2030 (USD THOUSAND)
TABLE 25 CHINA FUEL CELLS IN GRAPHITE MARKET, BY APPLICATION, 2021-2030 (USD THOUSAND)
TABLE 26 CHINA INTERIOR IN GRAPHITE MARKET, BY APPLICATION, 2021-2030 (USD THOUSAND)
TABLE 27 CHINA TRANSPORTATION IN GRAPHITE MARKET, BY PHYSICAL FORM, 2021-2030 (USD THOUSAND)
TABLE 28 CHINA INDUSTRIAL IN GRAPHITE MARKET, BY APPLICATION, 2021-2030 (USD THOUSAND)
TABLE 29 CHINA INDUSTRIAL IN GRAPHITE MARKET, BY PHYSICAL FORM, 2021-2030 (USD THOUSAND)
TABLE 30 CHINA BUILDING & CONSTRUCTION IN GRAPHITE MARKET, BY APPLICATION, 2021-2030 (USD THOUSAND)
TABLE 31 CHINA BUILDING & CONSTRUCTION IN GRAPHITE MARKET, BY PHYSICAL FORM, 2021-2030 (USD THOUSAND)
TABLE 32 CHINA MEDICAL DIAGNOSTICS IN GRAPHITE MARKET, BY PHYSICAL FORM, 2021-2030 (USD THOUSAND)
TABLE 33 CHINA DEFENSE IN GRAPHITE MARKET, BY PHYSICAL FORM, 2021-2030 (USD THOUSAND)
TABLE 34 INDIA GRAPHITE MARKET, BY PRODUCT TYPE 2021-2030 (USD THOUSAND)
TABLE 35 INDIA GRAPHITE MARKET, BY PHYSICAL FORM, 2021-2030 (USD THOUSAND)
TABLE 36 INDIA GRAPHITE MARKET, BY APPLICATION, 2021-2030 (USD THOUSAND)
TABLE 37 INDIA CONSUMER ELECTRONICS IN GRAPHITE MARKET, BY APPLICATION, 2021-2030 (USD THOUSAND)
TABLE 38 INDIA CONSUMER ELECTRONICS IN GRAPHITE MARKET, BY PHYSICAL FORM, 2021-2030 (USD THOUSAND)
TABLE 39 INDIA TRANSPORTATION IN GRAPHITE MARKET, BY APPLICATION, 2021-2030 (USD THOUSAND)
TABLE 40 INDIA BATTERIES IN GRAPHITE MARKET, BY APPLICATION, 2021-2030 (USD THOUSAND)
TABLE 41 INDIA FUEL CELLS IN GRAPHITE MARKET, BY APPLICATION, 2021-2030 (USD THOUSAND)
TABLE 42 INDIA INTERIOR IN GRAPHITE MARKET, BY APPLICATION, 2021-2030 (USD THOUSAND)
TABLE 43 INDIA TRANSPORTATION IN GRAPHITE MARKET, BY PHYSICAL FORM, 2021-2030 (USD THOUSAND)
TABLE 44 INDIA INDUSTRIAL IN GRAPHITE MARKET, BY APPLICATION, 2021-2030 (USD THOUSAND)
TABLE 45 INDIA INDUSTRIAL IN GRAPHITE MARKET, BY PHYSICAL FORM, 2021-2030 (USD THOUSAND)
TABLE 46 INDIA BUILDING & CONSTRUCTION IN GRAPHITE MARKET, BY APPLICATION, 2021-2030 (USD THOUSAND)
TABLE 47 INDIA BUILDING & CONSTRUCTION IN GRAPHITE MARKET, BY PHYSICAL FORM, 2021-2030 (USD THOUSAND)
TABLE 48 INDIA MEDICAL DIAGNOSTICS IN GRAPHITE MARKET, BY PHYSICAL FORM, 2021-2030 (USD THOUSAND)
TABLE 49 INDIA DEFENSE IN GRAPHITE MARKET, BY PHYSICAL FORM, 2021-2030 (USD THOUSAND)
TABLE 50 SOUTH KOREA GRAPHITE MARKET, BY PRODUCT TYPE 2021-2030 (USD THOUSAND)
TABLE 51 SOUTH KOREA GRAPHITE MARKET, BY PHYSICAL FORM, 2021-2030 (USD THOUSAND)
TABLE 52 SOUTH KOREA GRAPHITE MARKET, BY APPLICATION, 2021-2030 (USD THOUSAND)
TABLE 53 SOUTH KOREA CONSUMER ELECTRONICS IN GRAPHITE MARKET, BY APPLICATION, 2021-2030 (USD THOUSAND)
TABLE 54 SOUTH KOREA CONSUMER ELECTRONICS IN GRAPHITE MARKET, BY PHYSICAL FORM, 2021-2030 (USD THOUSAND)
TABLE 55 SOUTH KOREA TRANSPORTATION IN GRAPHITE MARKET, BY APPLICATION, 2021-2030 (USD THOUSAND)
TABLE 56 SOUTH KOREA BATTERIES IN GRAPHITE MARKET, BY APPLICATION, 2021-2030 (USD THOUSAND)
TABLE 57 SOUTH KOREA FUEL CELLS IN GRAPHITE MARKET, BY APPLICATION, 2021-2030 (USD THOUSAND)
TABLE 58 SOUTH KOREA INTERIOR IN GRAPHITE MARKET, BY APPLICATION, 2021-2030 (USD THOUSAND)
TABLE 59 SOUTH KOREA TRANSPORTATION IN GRAPHITE MARKET, BY PHYSICAL FORM, 2021-2030 (USD THOUSAND)
TABLE 60 SOUTH KOREA INDUSTRIAL IN GRAPHITE MARKET, BY APPLICATION, 2021-2030 (USD THOUSAND)
TABLE 61 SOUTH KOREA INDUSTRIAL IN GRAPHITE MARKET, BY PHYSICAL FORM, 2021-2030 (USD THOUSAND)
TABLE 62 SOUTH KOREA BUILDING & CONSTRUCTION IN GRAPHITE MARKET, BY APPLICATION, 2021-2030 (USD THOUSAND)
TABLE 63 SOUTH KOREA BUILDING & CONSTRUCTION IN GRAPHITE MARKET, BY PHYSICAL FORM, 2021-2030 (USD THOUSAND)
TABLE 64 SOUTH KOREA MEDICAL DIAGNOSTICS IN GRAPHITE MARKET, BY PHYSICAL FORM, 2021-2030 (USD THOUSAND)
TABLE 65 SOUTH KOREA DEFENSE IN GRAPHITE MARKET, BY PHYSICAL FORM, 2021-2030 (USD THOUSAND)
TABLE 66 JAPAN GRAPHITE MARKET, BY PRODUCT TYPE 2021-2030 (USD THOUSAND)
TABLE 67 JAPAN GRAPHITE MARKET, BY PHYSICAL FORM, 2021-2030 (USD THOUSAND)
TABLE 68 JAPAN GRAPHITE MARKET, BY APPLICATION, 2021-2030 (USD THOUSAND)
TABLE 69 JAPAN CONSUMER ELECTRONICS IN GRAPHITE MARKET, BY APPLICATION, 2021-2030 (USD THOUSAND)
TABLE 70 JAPAN CONSUMER ELECTRONICS IN GRAPHITE MARKET, BY PHYSICAL FORM, 2021-2030 (USD THOUSAND)
TABLE 71 JAPAN TRANSPORTATION IN GRAPHITE MARKET, BY APPLICATION, 2021-2030 (USD THOUSAND)
TABLE 72 JAPAN BATTERIES IN GRAPHITE MARKET, BY APPLICATION, 2021-2030 (USD THOUSAND)
TABLE 73 JAPAN FUEL CELLS IN GRAPHITE MARKET, BY APPLICATION, 2021-2030 (USD THOUSAND)
TABLE 74 JAPAN INTERIOR IN GRAPHITE MARKET, BY APPLICATION, 2021-2030 (USD THOUSAND)
TABLE 75 JAPAN TRANSPORTATION IN GRAPHITE MARKET, BY PHYSICAL FORM, 2021-2030 (USD THOUSAND)
TABLE 76 JAPAN INDUSTRIAL IN GRAPHITE MARKET, BY APPLICATION, 2021-2030 (USD THOUSAND)
TABLE 77 JAPAN INDUSTRIAL IN GRAPHITE MARKET, BY PHYSICAL FORM, 2021-2030 (USD THOUSAND)
TABLE 78 JAPAN BUILDING & CONSTRUCTION IN GRAPHITE MARKET, BY APPLICATION, 2021-2030 (USD THOUSAND)
TABLE 79 JAPAN BUILDING & CONSTRUCTION IN GRAPHITE MARKET, BY PHYSICAL FORM, 2021-2030 (USD THOUSAND)
TABLE 80 JAPAN MEDICAL DIAGNOSTICS IN GRAPHITE MARKET, BY PHYSICAL FORM, 2021-2030 (USD THOUSAND)
TABLE 81 JAPAN DEFENSE IN GRAPHITE MARKET, BY PHYSICAL FORM, 2021-2030 (USD THOUSAND)
TABLE 82 THAILAND GRAPHITE MARKET, BY PRODUCT TYPE 2021-2030 (USD THOUSAND)
TABLE 83 THAILAND GRAPHITE MARKET, BY PHYSICAL FORM, 2021-2030 (USD THOUSAND)
TABLE 84 THAILAND GRAPHITE MARKET, BY APPLICATION, 2021-2030 (USD THOUSAND)
TABLE 85 THAILAND CONSUMER ELECTRONICS IN GRAPHITE MARKET, BY APPLICATION, 2021-2030 (USD THOUSAND)
TABLE 86 THAILAND CONSUMER ELECTRONICS IN GRAPHITE MARKET, BY PHYSICAL FORM, 2021-2030 (USD THOUSAND)
TABLE 87 THAILAND TRANSPORTATION IN GRAPHITE MARKET, BY APPLICATION, 2021-2030 (USD THOUSAND)
TABLE 88 THAILAND BATTERIES IN GRAPHITE MARKET, BY APPLICATION, 2021-2030 (USD THOUSAND)
TABLE 89 THAILAND FUEL CELLS IN GRAPHITE MARKET, BY APPLICATION, 2021-2030 (USD THOUSAND)
TABLE 90 THAILAND INTERIOR IN GRAPHITE MARKET, BY APPLICATION, 2021-2030 (USD THOUSAND)
TABLE 91 THAILAND TRANSPORTATION IN GRAPHITE MARKET, BY PHYSICAL FORM, 2021-2030 (USD THOUSAND)
TABLE 92 THAILAND INDUSTRIAL IN GRAPHITE MARKET, BY APPLICATION, 2021-2030 (USD THOUSAND)
TABLE 93 THAILAND INDUSTRIAL IN GRAPHITE MARKET, BY PHYSICAL FORM, 2021-2030 (USD THOUSAND)
TABLE 94 THAILAND BUILDING & CONSTRUCTION IN GRAPHITE MARKET, BY APPLICATION, 2021-2030 (USD THOUSAND)
TABLE 95 THAILAND BUILDING & CONSTRUCTION IN GRAPHITE MARKET, BY PHYSICAL FORM, 2021-2030 (USD THOUSAND)
TABLE 96 THAILAND MEDICAL DIAGNOSTICS IN GRAPHITE MARKET, BY PHYSICAL FORM, 2021-2030 (USD THOUSAND)
TABLE 97 THAILAND DEFENSE IN GRAPHITE MARKET, BY PHYSICAL FORM, 2021-2030 (USD THOUSAND)
TABLE 98 INDONESIA GRAPHITE MARKET, BY PRODUCT TYPE 2021-2030 (USD THOUSAND)
TABLE 99 INDONESIA GRAPHITE MARKET, BY PHYSICAL FORM, 2021-2030 (USD THOUSAND)
TABLE 100 INDONESIA GRAPHITE MARKET, BY APPLICATION, 2021-2030 (USD THOUSAND)
TABLE 101 INDONESIA CONSUMER ELECTRONICS IN GRAPHITE MARKET, BY APPLICATION, 2021-2030 (USD THOUSAND)
TABLE 102 INDONESIA CONSUMER ELECTRONICS IN GRAPHITE MARKET, BY PHYSICAL FORM, 2021-2030 (USD THOUSAND)
TABLE 103 INDONESIA TRANSPORTATION IN GRAPHITE MARKET, BY APPLICATION, 2021-2030 (USD THOUSAND)
TABLE 104 INDONESIA BATTERIES IN GRAPHITE MARKET, BY APPLICATION, 2021-2030 (USD THOUSAND)
TABLE 105 INDONESIA FUEL CELLS IN GRAPHITE MARKET, BY APPLICATION, 2021-2030 (USD THOUSAND)
TABLE 106 INDONESIA INTERIOR IN GRAPHITE MARKET, BY APPLICATION, 2021-2030 (USD THOUSAND)
TABLE 107 INDONESIA TRANSPORTATION IN GRAPHITE MARKET, BY PHYSICAL FORM, 2021-2030 (USD THOUSAND)
TABLE 108 INDONESIA INDUSTRIAL IN GRAPHITE MARKET, BY APPLICATION, 2021-2030 (USD THOUSAND)
TABLE 109 INDONESIA INDUSTRIAL IN GRAPHITE MARKET, BY PHYSICAL FORM, 2021-2030 (USD THOUSAND)
TABLE 110 INDONESIA BUILDING & CONSTRUCTION IN GRAPHITE MARKET, BY APPLICATION, 2021-2030 (USD THOUSAND)
TABLE 111 INDONESIA BUILDING & CONSTRUCTION IN GRAPHITE MARKET, BY PHYSICAL FORM, 2021-2030 (USD THOUSAND)
TABLE 112 INDONESIA MEDICAL DIAGNOSTICS IN GRAPHITE MARKET, BY PHYSICAL FORM, 2021-2030 (USD THOUSAND)
TABLE 113 INDONESIA DEFENSE IN GRAPHITE MARKET, BY PHYSICAL FORM, 2021-2030 (USD THOUSAND)
TABLE 114 SINGAPORE GRAPHITE MARKET, BY PRODUCT TYPE 2021-2030 (USD THOUSAND)
TABLE 115 SINGAPORE GRAPHITE MARKET, BY PHYSICAL FORM, 2021-2030 (USD THOUSAND)
TABLE 116 SINGAPORE GRAPHITE MARKET, BY APPLICATION, 2021-2030 (USD THOUSAND)
TABLE 117 SINGAPORE CONSUMER ELECTRONICS IN GRAPHITE MARKET, BY APPLICATION, 2021-2030 (USD THOUSAND)
TABLE 118 SINGAPORE CONSUMER ELECTRONICS IN GRAPHITE MARKET, BY PHYSICAL FORM, 2021-2030 (USD THOUSAND)
TABLE 119 SINGAPORE TRANSPORTATION IN GRAPHITE MARKET, BY APPLICATION, 2021-2030 (USD THOUSAND)
TABLE 120 SINGAPORE BATTERIES IN GRAPHITE MARKET, BY APPLICATION, 2021-2030 (USD THOUSAND)
TABLE 121 SINGAPORE FUEL CELLS IN GRAPHITE MARKET, BY APPLICATION, 2021-2030 (USD THOUSAND)
TABLE 122 SINGAPORE INTERIOR IN GRAPHITE MARKET, BY APPLICATION, 2021-2030 (USD THOUSAND)
TABLE 123 SINGAPORE TRANSPORTATION IN GRAPHITE MARKET, BY PHYSICAL FORM, 2021-2030 (USD THOUSAND)
TABLE 124 SINGAPORE INDUSTRIAL IN GRAPHITE MARKET, BY APPLICATION, 2021-2030 (USD THOUSAND)
TABLE 125 SINGAPORE INDUSTRIAL IN GRAPHITE MARKET, BY PHYSICAL FORM, 2021-2030 (USD THOUSAND)
TABLE 126 SINGAPORE BUILDING & CONSTRUCTION IN GRAPHITE MARKET, BY APPLICATION, 2021-2030 (USD THOUSAND)
TABLE 127 SINGAPORE BUILDING & CONSTRUCTION IN GRAPHITE MARKET, BY PHYSICAL FORM, 2021-2030 (USD THOUSAND)
TABLE 128 SINGAPORE MEDICAL DIAGNOSTICS IN GRAPHITE MARKET, BY PHYSICAL FORM, 2021-2030 (USD THOUSAND)
TABLE 129 SINGAPORE DEFENSE IN GRAPHITE MARKET, BY PHYSICAL FORM, 2021-2030 (USD THOUSAND)
TABLE 130 MALAYSIA GRAPHITE MARKET, BY PRODUCT TYPE 2021-2030 (USD THOUSAND)
TABLE 131 MALAYSIA GRAPHITE MARKET, BY PHYSICAL FORM, 2021-2030 (USD THOUSAND)
TABLE 132 MALAYSIA GRAPHITE MARKET, BY APPLICATION, 2021-2030 (USD THOUSAND)
TABLE 133 MALAYSIA CONSUMER ELECTRONICS IN GRAPHITE MARKET, BY APPLICATION, 2021-2030 (USD THOUSAND)
TABLE 134 MALAYSIA CONSUMER ELECTRONICS IN GRAPHITE MARKET, BY PHYSICAL FORM, 2021-2030 (USD THOUSAND)
TABLE 135 MALAYSIA TRANSPORTATION IN GRAPHITE MARKET, BY APPLICATION, 2021-2030 (USD THOUSAND)
TABLE 136 MALAYSIA BATTERIES IN GRAPHITE MARKET, BY APPLICATION, 2021-2030 (USD THOUSAND)
TABLE 137 MALAYSIA FUEL CELLS IN GRAPHITE MARKET, BY APPLICATION, 2021-2030 (USD THOUSAND)
TABLE 138 MALAYSIA INTERIOR IN GRAPHITE MARKET, BY APPLICATION, 2021-2030 (USD THOUSAND)
TABLE 139 MALAYSIA TRANSPORTATION IN GRAPHITE MARKET, BY PHYSICAL FORM, 2021-2030 (USD THOUSAND)
TABLE 140 MALAYSIA INDUSTRIAL IN GRAPHITE MARKET, BY APPLICATION, 2021-2030 (USD THOUSAND)
TABLE 141 MALAYSIA INDUSTRIAL IN GRAPHITE MARKET, BY PHYSICAL FORM, 2021-2030 (USD THOUSAND)
TABLE 142 MALAYSIA BUILDING & CONSTRUCTION IN GRAPHITE MARKET, BY APPLICATION, 2021-2030 (USD THOUSAND)
TABLE 143 MALAYSIA BUILDING & CONSTRUCTION IN GRAPHITE MARKET, BY PHYSICAL FORM, 2021-2030 (USD THOUSAND)
TABLE 144 MALAYSIA MEDICAL DIAGNOSTICS IN GRAPHITE MARKET, BY PHYSICAL FORM, 2021-2030 (USD THOUSAND)
TABLE 145 MALAYSIA DEFENSE IN GRAPHITE MARKET, BY PHYSICAL FORM, 2021-2030 (USD THOUSAND)
TABLE 146 AUSTRALIA GRAPHITE MARKET, BY PRODUCT TYPE 2021-2030 (USD THOUSAND)
TABLE 147 AUSTRALIA GRAPHITE MARKET, BY PHYSICAL FORM, 2021-2030 (USD THOUSAND)
TABLE 148 AUSTRALIA GRAPHITE MARKET, BY APPLICATION, 2021-2030 (USD THOUSAND)
TABLE 149 AUSTRALIA CONSUMER ELECTRONICS IN GRAPHITE MARKET, BY APPLICATION, 2021-2030 (USD THOUSAND)
TABLE 150 AUSTRALIA CONSUMER ELECTRONICS IN GRAPHITE MARKET, BY PHYSICAL FORM, 2021-2030 (USD THOUSAND)
TABLE 151 AUSTRALIA TRANSPORTATION IN GRAPHITE MARKET, BY APPLICATION, 2021-2030 (USD THOUSAND)
TABLE 152 AUSTRALIA BATTERIES IN GRAPHITE MARKET, BY APPLICATION, 2021-2030 (USD THOUSAND)
TABLE 153 AUSTRALIA FUEL CELLS IN GRAPHITE MARKET, BY APPLICATION, 2021-2030 (USD THOUSAND)
TABLE 154 AUSTRALIA INTERIOR IN GRAPHITE MARKET, BY APPLICATION, 2021-2030 (USD THOUSAND)
TABLE 155 AUSTRALIA TRANSPORTATION IN GRAPHITE MARKET, BY PHYSICAL FORM, 2021-2030 (USD THOUSAND)
TABLE 156 AUSTRALIA INDUSTRIAL IN GRAPHITE MARKET, BY APPLICATION, 2021-2030 (USD THOUSAND)
TABLE 157 AUSTRALIA INDUSTRIAL IN GRAPHITE MARKET, BY PHYSICAL FORM, 2021-2030 (USD THOUSAND)
TABLE 158 AUSTRALIA BUILDING & CONSTRUCTION IN GRAPHITE MARKET, BY APPLICATION, 2021-2030 (USD THOUSAND)
TABLE 159 AUSTRALIA BUILDING & CONSTRUCTION IN GRAPHITE MARKET, BY PHYSICAL FORM, 2021-2030 (USD THOUSAND)
TABLE 160 AUSTRALIA MEDICAL DIAGNOSTICS IN GRAPHITE MARKET, BY PHYSICAL FORM, 2021-2030 (USD THOUSAND)
TABLE 161 AUSTRALIA DEFENSE IN GRAPHITE MARKET, BY PHYSICAL FORM, 2021-2030 (USD THOUSAND)
TABLE 162 PHILIPPINES GRAPHITE MARKET, BY PRODUCT TYPE 2021-2030 (USD THOUSAND)
TABLE 163 PHILIPPINES GRAPHITE MARKET, BY PHYSICAL FORM, 2021-2030 (USD THOUSAND)
TABLE 164 PHILIPPINES GRAPHITE MARKET, BY APPLICATION, 2021-2030 (USD THOUSAND)
TABLE 165 PHILIPPINES CONSUMER ELECTRONICS IN GRAPHITE MARKET, BY APPLICATION, 2021-2030 (USD THOUSAND)
TABLE 166 PHILIPPINES CONSUMER ELECTRONICS IN GRAPHITE MARKET, BY PHYSICAL FORM, 2021-2030 (USD THOUSAND)
TABLE 167 PHILIPPINES TRANSPORTATION IN GRAPHITE MARKET, BY APPLICATION, 2021-2030 (USD THOUSAND)
TABLE 168 PHILIPPINES BATTERIES IN GRAPHITE MARKET, BY APPLICATION, 2021-2030 (USD THOUSAND)
TABLE 169 PHILIPPINES FUEL CELLS IN GRAPHITE MARKET, BY APPLICATION, 2021-2030 (USD THOUSAND)
TABLE 170 PHILIPPINES INTERIOR IN GRAPHITE MARKET, BY APPLICATION, 2021-2030 (USD THOUSAND)
TABLE 171 PHILIPPINES TRANSPORTATION IN GRAPHITE MARKET, BY PHYSICAL FORM, 2021-2030 (USD THOUSAND)
TABLE 172 PHILIPPINES INDUSTRIAL IN GRAPHITE MARKET, BY APPLICATION, 2021-2030 (USD THOUSAND)
TABLE 173 PHILIPPINES INDUSTRIAL IN GRAPHITE MARKET, BY PHYSICAL FORM, 2021-2030 (USD THOUSAND)
TABLE 174 PHILIPPINES BUILDING & CONSTRUCTION IN GRAPHITE MARKET, BY APPLICATION, 2021-2030 (USD THOUSAND)
TABLE 175 PHILIPPINES BUILDING & CONSTRUCTION IN GRAPHITE MARKET, BY PHYSICAL FORM, 2021-2030 (USD THOUSAND)
TABLE 176 PHILIPPINES MEDICAL DIAGNOSTICS IN GRAPHITE MARKET, BY PHYSICAL FORM, 2021-2030 (USD THOUSAND)
TABLE 177 PHILIPPINES DEFENSE IN GRAPHITE MARKET, BY PHYSICAL FORM, 2021-2030 (USD THOUSAND)
TABLE 178 REST OF ASIA-PACIFIC GRAPHITE MARKET, BY PRODUCT TYPE 2021-2030 (USD THOUSAND)
List of Figure
FIGURE 1 ASIA-PACIFIC GRAPHITE MARKET
FIGURE 2 ASIA-PACIFIC GRAPHITE MARKET: DATA TRIANGULATION
FIGURE 3 ASIA-PACIFIC GRAPHITE MARKET: DROC ANALYSIS
FIGURE 4 ASIA-PACIFIC GRAPHITE MARKET: REGIONAL VS COUNTRY MARKET ANALYSIS
FIGURE 5 ASIA-PACIFIC GRAPHITE MARKET: COMPANY RESEARCH ANALYSIS
FIGURE 6 ASIA-PACIFIC GRAPHITE MARKET: MULTIVARIATE MODELLING
FIGURE 7 ASIA-PACIFIC GRAPHITE MARKET: INTERVIEW DEMOGRAPHICS
FIGURE 8 ASIA-PACIFIC GRAPHITE MARKET: DBMR MARKET POSITION GRID
FIGURE 9 ASIA-PACIFIC GRAPHITE MARKET: MARKET APPLICATION COVERAGE GRID
FIGURE 10 ASIA-PACIFIC GRAPHITE MARKET: VENDOR SHARE ANALYSIS
FIGURE 11 ASIA-PACIFIC GRAPHITE MARKET: SEGMENTATION
FIGURE 12 GRAPHITE’S VERSATILITY AND EXCEPTIONAL ELECTRICAL CONDUCTIVITY IS DRIVING THE GROWTH OF THE ASIA-PACIFIC GRAPHITE MARKET IN THE FORECAST PERIOD OF 2023 TO 2030
FIGURE 13 THE SYNTHETIC SEGMENT IS EXPECTED TO ACCOUNT FOR THE LARGEST SHARE OF THE ASIA-PACIFIC GRAPHITE MARKET IN 2023 AND 2030
FIGURE 14 DRIVERS, RESTRAINTS, OPPORTUNITIES, AND CHALLENGES OF THE ASIA-PACIFIC GRAPHITE MARKET
FIGURE 15 ASIA-PACIFIC GRAPHITE MARKET: BY PRODUCT TYPE, 2022
FIGURE 16 ASIA-PACIFIC GRAPHITE MARKET: BY PHYSICAL FORM, 2022
FIGURE 17 ASIA-PACIFIC GRAPHITE MARKET: BY APPLICATION, 2022
FIGURE 18 ASIA-PACIFIC GRAPHITE MARKET: SNAPSHOT (2022)
FIGURE 19 ASIA-PACIFIC GRAPHITE MARKET: COMPANY SHARE 2022 (%)
Asia Pacific Graphite Market, Supply Chain Analysis and Ecosystem Framework
To support market growth and help clients navigate the impact of geopolitical shifts, DBMR has integrated in-depth supply chain analysis into its Asia Pacific Graphite Market research reports. This addition empowers clients to respond effectively to global changes affecting their industries. The supply chain analysis section includes detailed insights such as Asia Pacific Graphite Market consumption and production by country, price trend analysis, the impact of tariffs and geopolitical developments, and import and export trends by country and HSN code. It also highlights major suppliers with data on production capacity and company profiles, as well as key importers and exporters. In addition to research, DBMR offers specialized supply chain consulting services backed by over a decade of experience, providing solutions like supplier discovery, supplier risk assessment, price trend analysis, impact evaluation of inflation and trade route changes, and comprehensive market trend analysis.
Data collection and base year analysis are done using data collection modules with large sample sizes. The stage includes obtaining market information or related data through various sources and strategies. It includes examining and planning all the data acquired from the past in advance. It likewise envelops the examination of information inconsistencies seen across different information sources. The market data is analysed and estimated using market statistical and coherent models. Also, market share analysis and key trend analysis are the major success factors in the market report. To know more, please request an analyst call or drop down your inquiry.
The key research methodology used by DBMR research team is data triangulation which involves data mining, analysis of the impact of data variables on the market and primary (industry expert) validation. Data models include Vendor Positioning Grid, Market Time Line Analysis, Market Overview and Guide, Company Positioning Grid, Patent Analysis, Pricing Analysis, Company Market Share Analysis, Standards of Measurement, Global versus Regional and Vendor Share Analysis. To know more about the research methodology, drop in an inquiry to speak to our industry experts.
Data Bridge Market Research is a leader in advanced formative research. We take pride in servicing our existing and new customers with data and analysis that match and suits their goal. The report can be customized to include price trend analysis of target brands understanding the market for additional countries (ask for the list of countries), clinical trial results data, literature review, refurbished market and product base analysis. Market analysis of target competitors can be analyzed from technology-based analysis to market portfolio strategies. We can add as many competitors that you require data about in the format and data style you are looking for. Our team of analysts can also provide you data in crude raw excel files pivot tables (Fact book) or can assist you in creating presentations from the data sets available in the report.


