
Asia Pacific Hydrochloric Acid Market
Market Size in USD Million
 USD
714.72 Million
USD
1,122.07 Million
2025
2033
USD
714.72 Million
USD
1,122.07 Million
2025
2033
| 2026 - 2033 | |
| USD 714.72 Million | |
| USD 1,122.07 Million | |
| % | |
|
Asia-Pacific Hydrochloric Acid Market Size
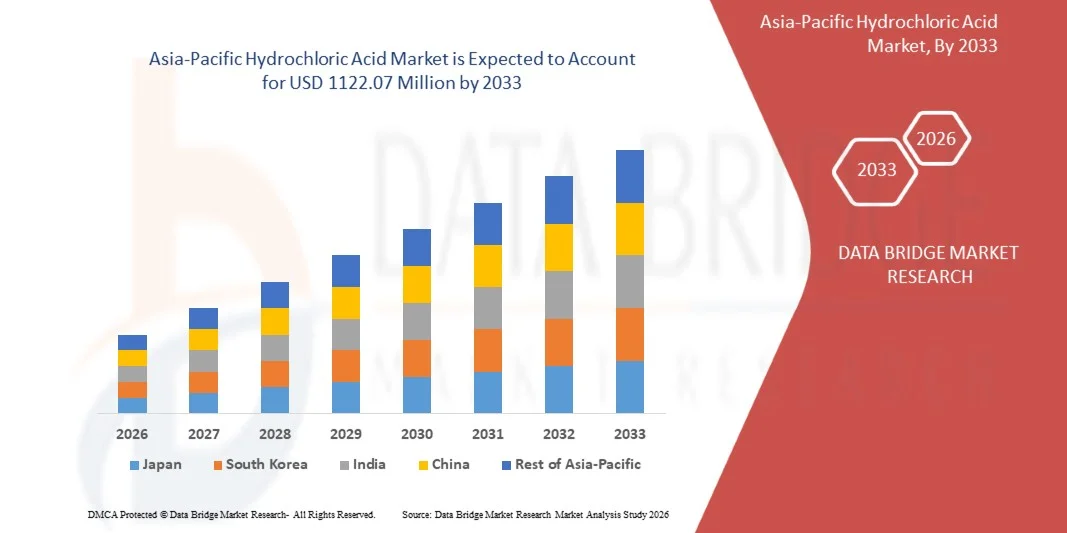
- The Asia-Pacific Hydrochloric Acid Market size was valued at USD 714.72 million in 2025 and is expected to reach USD 1122.07 million by 2033, at a CAGR of 5.8% during the forecast period
- The market growth is largely fueled by the increasing use of hydrochloric acid across key industrial processes such as steel pickling, oil well acidizing, food processing, and chemical synthesis, driven by expanding manufacturing output and rising demand from heavy industries. The growing need for high-purity HCl across pharmaceuticals and electronics manufacturing is further enhancing production volumes and strengthening its consumption outlook
- Furthermore, the rising adoption of by-product hydrochloric acid from chlor-alkali facilities and sustainability-focused recovery systems is improving supply availability for end-use sectors. These converging factors are accelerating industrial utilization of HCl and supporting stable demand growth across established and emerging application areas
Asia-Pacific Hydrochloric Acid Market Analysis
- Hydrochloric acid, a key inorganic chemical used for metal treatment, pH control, chemical processing, and resource recovery, remains a foundational input for industries such as steel, oil and gas, food processing, and pharmaceuticals. Its versatility and essential role in large-scale industrial workflows continue to reinforce its importance in global manufacturing and value-chain operations
- The growing demand for hydrochloric acid is primarily driven by expanding infrastructure development, increasing crude oil exploration activities requiring acidizing, and rising consumption of processed foods and specialty chemicals. These market drivers are strengthening long-term utilization trends and contributing to steady growth in both synthetic and by-product HCl production
- Japan dominated the Asia-Pacific Hydrochloric Acid Market in 2025, due to its strong chemical manufacturing base, advanced industrial infrastructure, and high consumption across electronics, automotive, and specialty chemical production
- India is expected to be the fastest growing country in the Asia-Pacific Hydrochloric Acid Market during the forecast period due to expanding steel manufacturing, rapid infrastructure development, and growing demand across pharmaceuticals, textiles, and food processing. Increasing reliance on HCl for crude oil acidizing and refining processes also supports strong growth
- Synthetic hydrochloric acid segment dominated the market with a market share of 74.5% in 2025, due to its consistent purity, controlled production process, and suitability for industries requiring precise chemical composition. Manufacturers prefer synthetic variants for applications such as pharmaceuticals, food processing, and water treatment, where quality reliability directly impacts operational output. The availability of large-scale, cost-efficient production facilities strengthens its presence across both developed and developing economies. Industries using synthetic HCl benefit from uniform concentration levels which reduce process variability and enhance end-product quality. The segment also advances through better handling technologies and rising investments in chemical manufacturing clusters globally, elevating its market share
Report Scope and Asia-Pacific Hydrochloric Acid Market Segmentation
|
Attributes |
Hydrochloric Acid Key Market Insights |
|
Segments Covered |
|
|
Countries Covered |
Asia-Pacific
|
|
Key Market Players |
|
|
Market Opportunities |
|
|
Value Added Data Infosets |
In addition to the insights on market scenarios such as market value, growth rate, segmentation, geographical coverage, and major players, the market reports curated by the Data Bridge Market Research also include import export analysis, production capacity overview, production consumption analysis, price trend analysis, climate change scenario, supply chain analysis, value chain analysis, raw material/consumables overview, vendor selection criteria, PESTLE Analysis, Porter Analysis, and regulatory framework. |
Asia-Pacific Hydrochloric Acid Market Trends
“Growing Adoption of Recovery-Based Hydrochloric Acid Production Systems”
- A major trend in the Asia-Pacific Hydrochloric Acid Market is the growing transition toward recovery-based production technologies that enable efficient reuse of hydrogen chloride gas from industrial operations. This shift is driven by the need to reduce chemical waste, lower production costs, and comply with environmental regulations promoting sustainable industrial practices
- For instance, Covestro AG and BASF SE have implemented hydrogen chloride recovery systems integrated within polycarbonate and isocyanate manufacturing units. These closed-loop systems capture and convert hydrogen chloride gas into reusable hydrochloric acid, improving resource efficiency and reducing emissions within chemical production facilities
- The adoption of recovery systems is expanding across chlor-alkali and petrochemical industries, as these processes generate large volumes of hydrogen chloride as a by-product. By converting this gas into marketable hydrochloric acid, companies enhance operational sustainability while optimizing their cost structures and supply chain efficiency
- Increasing technological innovation in acid recovery units, such as membrane-based separators and thermal recovery modules, is further enhancing process efficiency. These advancements are enabling higher purity outputs and minimizing energy usage, which supports the long-term economic viability of sustainable acid production systems
- In addition, the growing emphasis on circular chemical manufacturing is encouraging integration of recovered hydrochloric acid into value chains across metallurgy, food processing, and water treatment. This integration aligns with global efforts to reduce carbon footprint and improve industrial resource utilization
- The widespread move toward recovery-based hydrochloric acid production reflects a broader industry commitment to sustainability and operational resilience. As companies continue investing in closed-loop systems and green production frameworks, such technologies are expected to redefine competitive benchmarks in acid manufacturing and resource recovery efficiency
Asia-Pacific Hydrochloric Acid Market Dynamics
Driver
“Rising Demand from Steel Pickling and Oil Well Acidizing Applications”
- Growing demand from steel pickling and oil well acidizing industries serves as a key driver for the Asia-Pacific Hydrochloric Acid Market. In steel production, hydrochloric acid plays a vital role in removing impurities and oxide films from metal surfaces prior to galvanizing or coating, ensuring superior product quality and corrosion resistance
- For instance, ArcelorMittal and Tata Steel have integrated captive hydrochloric acid regeneration plants within their manufacturing facilities to ensure consistent supply for pickling operations. Similarly, oilfield service companies such as Halliburton and Schlumberger depend heavily on hydrochloric acid for acidizing treatments to enhance permeability in carbonate reservoirs
- The expansion of oil and gas exploration projects, combined with growth in downstream refining operations, is driving increased consumption of hydrochloric acid. The compound’s effectiveness in dissolving mineral scales and cleaning wellbore surfaces makes it indispensable in maintaining production efficiency across drilling and stimulation processes
- In steel manufacturing, modernization of processing units and the development of advanced pickling lines are further sustaining long-term demand. The use of hydrochloric acid in continuous pickling operations enables cleaner metal surfaces, higher productivity, and reduced environmental impact compared to older sulfuric acid methods
- The continuous rise in construction, automotive, and industrial infrastructure projects worldwide ensures a steady requirement for high-quality steel, thereby underpinning hydrochloric acid demand. The combined use across energy, metallurgy, and manufacturing sectors positions the compound as an essential industrial chemical driving global economic activity
Restraint/Challenge
“Volatility in Chlorine and Raw Material Supply”
- Volatility in the supply and pricing of chlorine, a key raw material in hydrochloric acid production, poses a significant challenge for manufacturers. As chlorine availability is closely linked to the chlor-alkali industry operations, fluctuations in output or downstream demand for caustic soda can directly influence hydrochloric acid production rates and pricing stability
- For instance, during periods of tight chlorine supply, major producers such as Olin Corporation and Westlake Chemical have reported production constraints and increased procurement costs for derivatives including hydrochloric acid. These supply imbalances can disrupt contract commitments and hinder profitability across dependent industries
- The cyclical nature of chlorine production, coupled with logistics and storage limitations, often leads to mismatched supply-demand dynamics. Since hydrochloric acid is difficult to transport over long distances due to safety concerns, regional production shortfalls can result in localized price surges and limited availability
- In addition, global economic fluctuations and maintenance outages in chlor-alkali facilities can further exacerbate raw material shortages. Variations in energy prices and production costs also impact chlorine manufacturing economics, subsequently influencing hydrochloric acid pricing trends across industrial regions
- Ensuring consistent raw material sourcing and developing efficient recovery-based production models will be essential to counter market volatility. Strategic collaborations, backward integration, and adoption of circular chemical production systems are expected to help stabilize supply chains and sustain reliable hydrochloric acid output in the long term
Asia-Pacific Hydrochloric Acid Market Scope
The market is segmented on the basis of type, form, application, distribution channel, and end-user.
• By Type
On the basis of type, market is segmented into Synthetic Hydrochloric Acid and By-Product Hydrochloric Acid. The synthetic hydrochloric acid segment dominated the market with the largest share of 74.5% in 2025 due to its consistent purity, controlled production process, and suitability for industries requiring precise chemical composition. Manufacturers prefer synthetic variants for applications such as pharmaceuticals, food processing, and water treatment, where quality reliability directly impacts operational output. The availability of large-scale, cost-efficient production facilities strengthens its presence across both developed and developing economies. Industries using synthetic HCl benefit from uniform concentration levels which reduce process variability and enhance end-product quality. The segment also advances through better handling technologies and rising investments in chemical manufacturing clusters globally, elevating its market share.
The by-product hydrochloric acid segment is projected to witness the fastest growth from 2026 to 2033 driven by its increasing availability from integrated steel and chemical plants. This type gains traction as industries look for cost-effective alternatives arising from the growing focus on resource efficiency and circular manufacturing. Its adoption strengthens as steel plants modernize operations and generate higher volumes of by-product HCl suitable for downstream consumption. Many end-use sectors accept by-product variants for applications such as metal processing and oil well stimulation where ultra-high purity is not mandatory. Environmental considerations and reduced production costs further accelerate its growth trajectory across global markets.
• By Form
On the basis of form, market is segmented into Water-Based, Aqueous, and Solution. The water-based form segment dominated the Asia-Pacific Hydrochloric Acid Market in 2025 due to its broad applicability across chemical synthesis, metal treatment, and industrial processing. Water-based HCl is favored for its balanced concentration levels, easier handling characteristics, and compatibility with large industrial systems. End-use industries prefer this form as it supports stable reaction rates and reduces risks associated with highly concentrated acid forms. The segment benefits from the expansion of manufacturing operations in steel and oil & gas sectors where water-based variants are widely used. Its cost-effectiveness and safety advantages ensure continuous demand across both bulk and specialty chemical buyers.
The aqueous and solution HCl segment is expected to experience the fastest growth rate from 2026 to 2033 due to rising adoption in laboratories, controlled industrial applications, and precision-based chemical synthesis. These forms offer customizable concentration levels that meet the stringent operational requirements of pharmaceuticals, food processing, and electronics manufacturing. Growth is further driven by increasing automation in dosing systems that rely on standardized solution formats to avoid variability. The segment benefits from expanding applications in areas where consistent chemical behavior and safety in handling are prioritized. This flexibility in formulation supports its rapid expansion across emerging end-use industries.
• By Application
On the basis of application, market is segmented into Steel Pickling, Oil Well Acidizing, Ore Processing, Food Processing, Pool Sanitation, Calcium Chloride, and Others. The steel pickling application dominated the market in 2025 due to the acid’s indispensable role in removing scale, rust, and impurities during steel processing. Hydrochloric acid provides superior pickling efficiency compared to alternative acids, offering faster reaction rates and cleaner surface preparation for downstream processes. The expansion of global steel production, particularly in Asia-Pacific, further reinforces its dominance. Steel manufacturers prefer HCl for its recyclability through acid regeneration systems, reducing environmental impact and operational costs. The segment maintains a strong position due to continuous modernization of pickling lines and demand from automotive, construction, and heavy industries.
Oil well acidizing is projected to record the fastest growth from 2026 to 2033 driven by increased drilling activities in both conventional and unconventional reserves. Hydrochloric acid is preferred for its ability to dissolve carbonates, enhance reservoir permeability, and improve hydrocarbon flow rates. Expansion of shale exploration and enhanced oil recovery projects amplifies the demand for high-performance acidizing solutions. The industry’s focus on maximizing well productivity and reducing downtime encourages greater adoption of HCl-based formulations. Rising investment in oilfield services and advanced stimulation techniques pushes this segment to the forefront of future growth.
• By Distribution Channel
On the basis of distribution channel, market is segmented into E-Commerce, B2B, Specialty Stores, and Others. The B2B distribution channel dominated the Asia-Pacific Hydrochloric Acid Market in 2025 due to the bulk procurement patterns of industrial consumers across steel, chemical, and oil & gas sectors. Businesses prefer direct supply contracts to ensure uninterrupted availability, stable pricing, and tailored concentration grades. Chemical manufacturers and distributors strengthen this channel with well-established logistics networks and long-term service agreements. Large-scale users benefit from integrated storage, transport, and safety systems that streamline high-volume deliveries. The channel remains dominant as industrial dependency on controlled, timely supply continues to increase globally.
The e-commerce segment is expected to witness the fastest growth from 2026 to 2033 due to increasing digitalization of procurement processes and expansion of online chemical marketplaces. Small and medium industries increasingly rely on online platforms for transparent pricing, product comparison, and swift order fulfillment. E-commerce platforms support easier access to safety datasheets, certifications, and technical specifications, enabling informed decision-making. The shift toward decentralized purchasing and demand for smaller packaging units also supports growth. Rising participation of chemical suppliers in online distribution accelerates the segment’s expansion.
• By End-User
On the basis of end-user, market is segmented into Food and Beverages, Pharmaceuticals, Textile, Oil and Gas, Steel Industry, Chemistry Industry, and Others. The steel industry dominated the market in 2025 due to large-scale consumption of hydrochloric acid for pickling processes, descaling, and production optimization. Steel plants depend on HCl for achieving clean surfaces, reducing impurities, and enabling efficient rolling and finishing operations. The continuous growth of construction, automotive, and infrastructure sectors maintains strong steel output levels. Acid regeneration technologies further encourage adoption by reducing waste and improving cost efficiency. The segment benefits from ongoing capacity expansions in major steel-producing regions, ensuring sustained dominance.
The oil and gas segment is projected to grow at the fastest rate from 2026 to 2033 driven by rising requirements for acid stimulation, well cleaning, and enhanced recovery operations. Hydrochloric acid plays a crucial role in improving reservoir performance, especially in carbonate formations where acidizing is essential. Growth in shale extraction and deep-well drilling boosts demand for tailored acid blends. The sector adopts more advanced chemical solutions to maximize yield and operational efficiency. Increasing global investment in exploration and production projects ensures rapid expansion of this end-user segment.
Asia-Pacific Hydrochloric Acid Market Regional Analysis
- Japan dominated the Asia-Pacific Hydrochloric Acid Market with the largest revenue share in 2025, driven by its strong chemical manufacturing base, advanced industrial infrastructure, and high consumption across electronics, automotive, and specialty chemical production
- Japan’s leadership is reinforced by its extensive use of high-purity hydrochloric acid in semiconductor fabrication, pharmaceutical synthesis, and precision metal processing, sectors in which the country maintains global competitiveness
- The presence of established chemical producers, continuous technological upgrades, and strict quality standards strengthens Japan’s supply capabilities, ensuring consistent demand from domestic industries. Rising investments in electronics and battery materials further enhance Japan’s dominant position during the forecast period
China Asia-Pacific Hydrochloric Acid Market Insight
China represents one of the largest and most rapidly evolving markets for hydrochloric acid, supported by its extensive chemical manufacturing ecosystem, large steel production capacity, and expanding industrial output. Growing activity across ore processing, plastics manufacturing, and wastewater treatment significantly increases HCl consumption. Rising investments in specialty chemicals, electronics manufacturing, and renewable energy materials continue to boost demand for both synthetic and by-product hydrochloric acid. China’s strong export base, availability of raw materials, and large-scale chlor-alkali production reinforce its strategic importance in the regional landscape.
India Asia-Pacific Hydrochloric Acid Market Insight
India is projected to register the fastest CAGR in the Asia-Pacific Hydrochloric Acid Market during 2026–2033, driven by expanding steel manufacturing, rapid infrastructure development, and growing demand across pharmaceuticals, textiles, and food processing. Increasing reliance on HCl for crude oil acidizing and refining processes also supports strong growth. Accelerating industrialization, rising chlor-alkali production, and government-led manufacturing initiatives strengthen domestic demand. Improved logistics networks, expanding distribution channels, and greater participation from global chemical suppliers position India as the region’s fastest-growing market.
Asia-Pacific Hydrochloric Acid Market Share
The hydrochloric acid industry is primarily led by well-established companies, including:
- Olin Corporation (U.S.)
- Occidental Petroleum Corporation (U.S.)
- Shin-Etsu Chemical Co., Ltd. (Japan)
- BASF SE (Germany)
- UNID (South Korea)
- Detrex Corporation – Italmatch Chemicals S.p.A. (U.S./Italy)
- Tronox Holdings plc (U.S.)
- IXOM (Australia)
- Nouryon (Netherlands)
- ERCO Worldwide – Superior Plus (Canada)
- SEQUENS (France)
- Formosa Plastics Corporation (Taiwan)
- Tessenderlo Group (Belgium)
- Westlake Chemical Corporation (U.S.)
- Aditya Birla Chemicals (India)
- AGC Chemicals Americas (U.S./Japan)
- TOAGOSEI CO., LTD (Japan)
Latest Developments in Asia-Pacific Hydrochloric Acid Market
- In November 2025, the U.S. EPA introduced strengthened air-emission regulations for hazardous-waste combustors, placing tighter controls on facilities that recover hydrochloric acid from waste streams. The updated standards increase the need for advanced emission-control technologies, raising operational and compliance costs for HCl recovery units. This development is expected to influence the economics of by-product hydrochloric acid production, potentially slowing new recovery-based capacity additions and prompting producers to reassess long-term investment strategies in waste-to-chemical systems
- In July 2025, Olin Corporation expanded its hydrochloric acid production capacity at its Louisiana manufacturing site to address growing demand from steel processing, chemical synthesis, and water-treatment industries. This expansion enhances Olin’s ability to meet regional and international supply requirements, reduces dependency on imported volumes, and stabilizes availability across end-use segments. By strengthening production reliability, Olin also improves its competitive advantage within the chlor-alkali value chain, supporting market balance amid rising consumption
- In January 2025, Jones-Hamilton Co. completed its acquisition of Nexchlor LLC, significantly expanding its hydrochloric acid production capabilities and geographic footprint. The integration strengthens the company’s position in the global market, enhancing supply security and enabling broader service coverage across more than 20 countries. With Jon Cupps appointed as Division Manager for the HCl business, the company aims to streamline operations and improve strategic alignment, while CEO Tim Poure emphasized how combined expertise will elevate customer relationships and long-term supply performance
- In August 2024, Westlake Corporation held a public hearing to discuss its proposal to install two hazardous waste-fired hydrochloric acid furnaces designed to recover HCl from industrial waste streams. The project highlights increasing industry focus on resource efficiency and sustainable production pathways. Although community attendees expressed concerns regarding environmental and safety impacts, regulatory experts emphasized strict compliance with contaminant-removal requirements under the Resource Conservation and Recovery Act. The project’s progression could enhance regional supply and support circular production models, though regulatory scrutiny and community feedback may influence the final implementation timeline
SKU-

- Interactive Data Analysis Dashboard
- Company Analysis Dashboard for high growth potential opportunities
- Research Analyst Access for customization & queries
- Competitor Analysis with Interactive dashboard
- Latest News, Updates & Trend analysis
- Harness the Power of Benchmark Analysis for Comprehensive Competitor Tracking
Asia Pacific Hydrochloric Acid Market, Supply Chain Analysis and Ecosystem Framework
To support market growth and help clients navigate the impact of geopolitical shifts, DBMR has integrated in-depth supply chain analysis into its Asia Pacific Hydrochloric Acid Market research reports. This addition empowers clients to respond effectively to global changes affecting their industries. The supply chain analysis section includes detailed insights such as Asia Pacific Hydrochloric Acid Market consumption and production by country, price trend analysis, the impact of tariffs and geopolitical developments, and import and export trends by country and HSN code. It also highlights major suppliers with data on production capacity and company profiles, as well as key importers and exporters. In addition to research, DBMR offers specialized supply chain consulting services backed by over a decade of experience, providing solutions like supplier discovery, supplier risk assessment, price trend analysis, impact evaluation of inflation and trade route changes, and comprehensive market trend analysis.
Data collection and base year analysis are done using data collection modules with large sample sizes. The stage includes obtaining market information or related data through various sources and strategies. It includes examining and planning all the data acquired from the past in advance. It likewise envelops the examination of information inconsistencies seen across different information sources. The market data is analysed and estimated using market statistical and coherent models. Also, market share analysis and key trend analysis are the major success factors in the market report. To know more, please request an analyst call or drop down your inquiry.
The key research methodology used by DBMR research team is data triangulation which involves data mining, analysis of the impact of data variables on the market and primary (industry expert) validation. Data models include Vendor Positioning Grid, Market Time Line Analysis, Market Overview and Guide, Company Positioning Grid, Patent Analysis, Pricing Analysis, Company Market Share Analysis, Standards of Measurement, Global versus Regional and Vendor Share Analysis. To know more about the research methodology, drop in an inquiry to speak to our industry experts.
Data Bridge Market Research is a leader in advanced formative research. We take pride in servicing our existing and new customers with data and analysis that match and suits their goal. The report can be customized to include price trend analysis of target brands understanding the market for additional countries (ask for the list of countries), clinical trial results data, literature review, refurbished market and product base analysis. Market analysis of target competitors can be analyzed from technology-based analysis to market portfolio strategies. We can add as many competitors that you require data about in the format and data style you are looking for. Our team of analysts can also provide you data in crude raw excel files pivot tables (Fact book) or can assist you in creating presentations from the data sets available in the report.


