
Asia Pacific Inorganic Scintillators Market
Market Size in USD Billion
 USD
97.20 Billion
USD
202.37 Billion
2025
2033
USD
97.20 Billion
USD
202.37 Billion
2025
2033
| 2026 - 2033 | |
| USD 97.20 Billion | |
| USD 202.37 Billion | |
| % | |
|
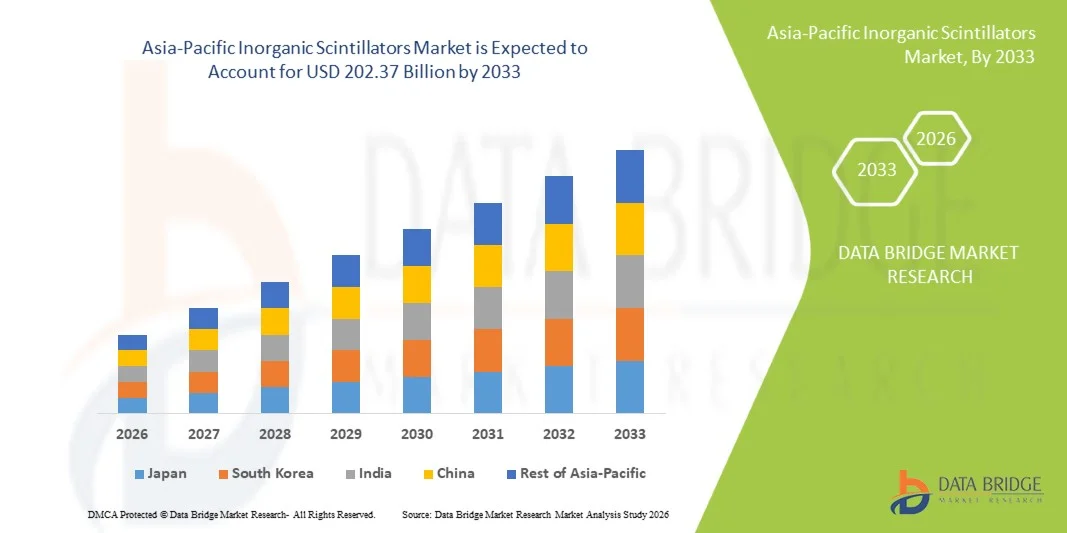
Asia-Pacific Inorganic Scintillators Market Size
- The Asia-Pacific Inorganic Scintillators Market size was valued at USD 97.20 billion in 2025 and is expected to reach USD 202.37 billion by 2033, at a CAGR of 9.60% during the forecast period
- The market growth is largely fueled by increasing demand for advanced radiation detection and imaging technologies, driven by technological progress in nuclear medicine, medical imaging, homeland security, and high-energy physics research, leading to greater adoption of inorganic scintillators across healthcare, defense, and industrial applications
- Furthermore, rising demand for high-performance, durable, and precise detection materials with superior light yield, fast response time, and stability is establishing inorganic scintillators as a preferred solution for radiation measurement and imaging systems. These converging factors are accelerating the uptake of inorganic scintillator solutions, thereby significantly boosting the market’s overall growth
Asia-Pacific Inorganic Scintillators Market Analysis
- Inorganic scintillators, which convert high-energy radiation into visible light signals, are critical components of radiation detection and imaging systems used across medical diagnostics, nuclear medicine, homeland security, high-energy physics, and industrial inspection due to their high light yield, energy resolution, and long-term stability
- The escalating demand for inorganic scintillators is primarily driven by the expanding use of advanced medical imaging modalities, rising investments in nuclear power and radiation monitoring, and increasing security screening requirements, along with continuous material innovations improving detection efficiency and performance
- China dominated the Asia-Pacific Inorganic Scintillators Market with the largest revenue share of approximately 39.4% in 2025, supported by strong government investments in nuclear energy and medical imaging infrastructure, rapid expansion of domestic detector manufacturing capabilities, high adoption in industrial radiography, and the presence of major regional producers supplying both local and global markets
- India is expected to be the fastest-growing country in the Asia-Pacific Inorganic Scintillators Market during the forecast period, driven by rising healthcare expenditure, increasing deployment of diagnostic imaging systems, growth in nuclear research programs, expanding industrial inspection activities, and supportive government initiatives promoting domestic manufacturing
- The alkali halides segment accounted for the largest market revenue share of 41.8% in 2025, driven by widespread use of NaI and CsI scintillators
Report Scope and Asia-Pacific Inorganic Scintillators Market Segmentation
|
Attributes |
Asia-Pacific Inorganic Scintillators Key Market Insights |
|
Segments Covered |
|
|
Countries Covered |
Asia-Pacific
|
|
Key Market Players |
|
|
Market Opportunities |
|
|
Value Added Data Infosets |
In addition to the insights on market scenarios such as market value, growth rate, segmentation, geographical coverage, and major players, the market reports curated by the Data Bridge Market Research also include in-depth expert analysis, patient epidemiology, pipeline analysis, pricing analysis, and regulatory framework. |
Asia-Pacific Inorganic Scintillators Market Trends
“Rising Demand for Advanced Radiation Detection and Medical Imaging Applications”
- A significant and accelerating trend in the Asia-Pacific Inorganic Scintillators Market is the growing demand for high-performance scintillation materials driven by expanding applications in medical imaging, nuclear medicine, radiation monitoring, and high-energy physics research
- The increasing use of inorganic scintillators in PET scanners, CT systems, gamma cameras, and security screening equipment is reshaping material innovation across the region
- For instance, the rising installation of PET-CT systems across hospitals in China, Japan, and South Korea has increased demand for lutetium-based scintillators such as LYSO and LSO, which offer high light output, fast decay times, and excellent energy resolution required for precise diagnostic imaging
- Advancements in crystal growth technologies and material engineering are enabling manufacturers to produce scintillators with improved density, radiation hardness, and optical clarity. These improvements are critical for enhancing image quality and detection accuracy in both medical and industrial applications
- In addition, the growing adoption of inorganic scintillators in homeland security, environmental radiation monitoring, and nuclear power facilities is expanding their usage beyond healthcare, particularly in countries investing heavily in nuclear energy and radiation safety infrastructure
- This trend toward high-efficiency, application-specific scintillator materials is driving continuous R&D efforts among regional manufacturers and research institutions, positioning Asia-Pacific as a key hub for next-generation inorganic scintillator development
- The increasing need for reliable, high-resolution detection systems across multiple end-use sectors is expected to sustain long-term demand for advanced inorganic scintillator materials in the region
Asia-Pacific Inorganic Scintillators Market Dynamics
Driver
“Growing Demand from Medical Imaging, Nuclear Medicine, and Radiation Monitoring”
- The increasing prevalence of chronic diseases, cancer, and neurological disorders, coupled with the expansion of diagnostic imaging infrastructure, is a major driver for the Asia-Pacific Inorganic Scintillators Market
- For instance, government-led healthcare modernization programs in China and India have led to a steady rise in the number of diagnostic imaging centers, significantly boosting demand for scintillators used in PET, SPECT, and CT imaging systems
- The rising number of nuclear medicine procedures, including cancer diagnostics and radiotherapy planning, is further increasing demand for high-performance inorganic scintillators with superior detection efficiency and stability
- Furthermore, growing investments in nuclear power generation and radiation safety programs across countries such as China, Japan, and South Korea are driving adoption of scintillators in radiation monitoring and control systems
- The expansion of scientific research facilities, particle physics laboratories, and industrial non-destructive testing applications is also contributing to sustained market growth
- Together, these factors are accelerating the deployment of inorganic scintillators across healthcare, energy, research, and industrial sectors throughout the Asia-Pacific region
Restraint/Challenge
“High Manufacturing Costs and Material Complexity”
- The high cost associated with the production of inorganic scintillators poses a significant challenge to market expansion, particularly for price-sensitive applications and emerging economies
- For instance, scintillators such as LYSO and BGO require complex crystal growth processes and rare-earth elements, which increase raw material costs and limit large-scale affordability
- The need for precise manufacturing conditions, long production cycles, and specialized technical expertise further adds to overall production expenses, impacting pricing competitiveness
- In addition, supply chain constraints related to rare-earth materials and dependence on limited sources can lead to price volatility and availability issues
- These cost and complexity challenges can restrict adoption in low-budget healthcare facilities and industrial applications where alternative detection technologies may be considered
- Addressing these restraints through material innovation, cost-effective synthesis techniques, and localized manufacturing will be critical for improving accessibility and sustaining long-term market growth in the Asia-Pacific Inorganic Scintillators Market
Asia-Pacific Inorganic Scintillators Market Scope
The market is segmented on the basis of scintillation material, type, application, and end user.
• By Scintillation Material
On the basis of scintillation material, the Asia-Pacific Inorganic Scintillators Market is segmented into Sodium Iodide (NaI), Cesium Iodide (CsI), Lutetium Oxyorthosilicate (LSO) and Lutetium–Yttrium Oxyorthosilicate (LYSO), Bismuth Germanate (BGO), Barium Fluoride, Lead Tungstate (PbWO₄), Cadmium Tungstate (CdWO₄), Cerium Bromide (CeBr₃), Lanthanum Bromide (LaBr₃), Gadolinium Orthosilicate (GSO), Yttrium Aluminum Garnet (YAG:Ce), Gadolinium Oxysulfide (GOS), and others. The Sodium Iodide (NaI) segment dominated the largest market revenue share of 34.6% in 2025, driven by its long-standing use in radiation detection and medical imaging applications. NaI scintillators offer high light output and cost-effectiveness, making them widely preferred in gamma cameras and nuclear medicine diagnostics. Their ease of manufacturing and availability further support widespread adoption. NaI detectors are extensively used in hospitals and research laboratories. Strong demand from homeland security for radiation monitoring boosts usage. Compatibility with existing detection systems enhances market penetration. Established regulatory acceptance supports sustained demand. High sensitivity improves imaging accuracy. Broad application scope strengthens dominance. Continuous improvements in crystal growth enhance performance. Large installed base maintains recurring demand. These factors collectively sustain market leadership.
The Lanthanum Bromide (LaBr₃) segment is anticipated to witness the fastest CAGR of 8.9% from 2026 to 2033, driven by superior energy resolution and faster response time. LaBr₃ scintillators are increasingly adopted in advanced nuclear spectroscopy and high-end medical imaging systems. Growing demand for precise radiation detection supports growth. Technological advancements have reduced intrinsic background noise, improving reliability. Rising adoption in homeland security applications fuels demand. Expansion of nuclear research facilities boosts uptake. Increased use in oil exploration further accelerates growth. Higher performance compared to traditional scintillators drives preference. Growing investments in advanced diagnostic technologies support expansion. Increased funding for nuclear safety enhances adoption. Emerging economies are adopting high-performance scintillators rapidly. These factors collectively drive strong CAGR growth.
• By Type
On the basis of type, the Asia-Pacific Inorganic Scintillators Market is segmented into Alkali Halides, Oxide Compounds, and Rare Earth Metals. The alkali halides segment accounted for the largest market revenue share of 41.8% in 2025, driven by widespread use of NaI and CsI scintillators. These materials offer high scintillation efficiency and relatively low production costs. Alkali halides are extensively used in medical imaging and radiation detection. Their compatibility with photomultiplier tubes supports adoption. High light yield improves detection sensitivity. Established manufacturing processes enhance supply consistency. Strong presence in nuclear medicine supports dominance. Increasing diagnostic imaging procedures boost demand. Research laboratories prefer alkali halides for spectroscopy. Availability in multiple crystal forms enhances versatility. Continuous product improvements sustain demand. Overall, cost efficiency and performance drive dominance.
The rare earth metals segment is expected to witness the fastest CAGR of 9.4% from 2026 to 2033, driven by rising demand for high-performance scintillators. Materials such as LYSO and LaBr₃ offer superior resolution and faster decay times. Increasing adoption in PET imaging systems supports growth. Expanding oncology diagnostics fuels demand. Technological innovation improves crystal purity and efficiency. Rising investments in advanced imaging technologies accelerate adoption. Growing nuclear physics research supports usage. Higher sensitivity enhances clinical outcomes. Increased government funding for medical infrastructure boosts demand. Expansion of particle physics research further drives growth. Strong preference for premium performance materials supports CAGR. These factors collectively fuel rapid expansion.
• By Application
On the basis of application, the Asia-Pacific Inorganic Scintillators Market is segmented into medical imaging, nuclear medicine, radioprotection, oil exploration, process industry, life sciences, and others. The medical imaging segment dominated the market with a revenue share of 38.9% in 2025, driven by the widespread use of scintillators in CT scanners, PET scanners, and gamma cameras. Increasing prevalence of cancer and chronic diseases boosts imaging demand. Scintillators play a critical role in diagnostic accuracy. Rising adoption of advanced imaging modalities supports dominance. Technological improvements enhance image resolution. Expanding healthcare infrastructure drives installation of imaging systems. High patient volumes increase equipment utilization. Strong reimbursement frameworks in developed regions support growth. Integration with digital imaging systems enhances efficiency. Continuous product innovation improves clinical outcomes. Growing aging population fuels diagnostic demand. These factors sustain leadership.
The nuclear medicine segment is projected to grow at the fastest CAGR of 8.6% from 2026 to 2033, driven by rising use of radiopharmaceuticals. Increasing demand for targeted diagnostics and therapies supports growth. Scintillators are essential for radiation detection and imaging. Expansion of nuclear medicine departments boosts equipment demand. Technological advancements improve detection sensitivity. Growing awareness of early disease detection accelerates adoption. Increased cancer screening programs support growth. Rising investment in nuclear healthcare infrastructure fuels expansion. Favorable regulatory approvals drive market uptake. Growing use in theranostics enhances demand. Emerging markets show strong adoption potential. These trends collectively drive high CAGR growth.
• By End User
On the basis of end user, the Asia-Pacific Inorganic Scintillators Market is segmented into healthcare, homeland security and defense, nuclear power plants, industrial applications, and others. The healthcare segment held the largest market revenue share of 36.2% in 2025, driven by extensive use of scintillators in diagnostic imaging and nuclear medicine. Hospitals and diagnostic centers rely heavily on scintillation detectors. Rising healthcare expenditure supports equipment upgrades. Increasing imaging procedure volumes boost demand. Technological advancements enhance clinical efficiency. Strong regulatory support for medical imaging drives adoption. Expansion of oncology treatment centers fuels demand. Aging population increases diagnostic needs. High focus on early disease detection strengthens usage. Integration with advanced imaging platforms supports dominance. Continuous innovation improves performance reliability. These factors sustain healthcare leadership.
The homeland security and defense segment is expected to witness the fastest CAGR of 9.1% from 2026 to 2033, driven by rising concerns over nuclear threats. Governments are investing heavily in radiation detection systems. Scintillators are critical for border security and surveillance. Increasing deployment at ports and airports boosts demand. Technological advancements improve detection accuracy. Rising defense budgets support procurement. Expansion of nuclear monitoring programs fuels adoption. Growing geopolitical tensions increase security investments. Portable detection systems enhance operational efficiency. Increased training programs drive equipment usage. Emerging economies are strengthening security infrastructure. These factors collectively drive rapid market growth.
Asia-Pacific Inorganic Scintillators Market Regional Analysis
- The Asia-Pacific Inorganic Scintillators Market is poised to grow at the fastest CAGR during the forecast period of 2026 to 2033, driven by rising investments in healthcare infrastructure, expanding nuclear power programs, increasing demand for medical imaging systems, and growing applications in industrial inspection and security screening across the region. Countries such as China, India, and Japan are witnessing strong adoption of inorganic scintillators due to advancements in radiation detection technologies and expanding end-use industries
- The increasing use of inorganic scintillators in diagnostic imaging applications, such as PET, CT, and SPECT systems, is significantly boosting demand, as healthcare providers seek high-resolution, reliable, and fast-response detector materials to improve diagnostic accuracy and patient outcomes
- In addition, Asia-Pacific’s emergence as a global manufacturing hub for radiation detection equipment and detector components is supporting market growth, supported by government initiatives promoting domestic production, technological self-reliance, and export-oriented manufacturing of advanced scintillator materials
China Asia-Pacific Inorganic Scintillators Market Insight
China Asia-Pacific Inorganic Scintillators Market dominated the Asia-Pacific Inorganic Scintillators Market in the Asia-Pacific region with the largest revenue share of approximately 39.4% in 2025, supported by strong government investments in nuclear energy, medical imaging infrastructure, and radiation safety systems. The rapid expansion of domestic detector and crystal manufacturing capabilities has enabled widespread adoption of inorganic scintillators across nuclear medicine, industrial radiography, homeland security, and scientific research applications. National initiatives focused on strengthening nuclear power capacity, expanding cancer diagnostics, and improving industrial inspection standards have accelerated demand for high-performance scintillator materials. Moreover, the presence of major regional producers supplying both domestic and international markets has strengthened China’s leadership position, as local manufacturers offer cost-competitive and technologically advanced scintillator solutions.
India Asia-Pacific Inorganic Scintillators Market Insight
India Asia-Pacific Inorganic Scintillators Market is expected to be the fastest-growing country in the Asia-Pacific Inorganic Scintillators Market during the forecast period, driven by rising healthcare expenditure, increasing deployment of diagnostic imaging systems, and the expansion of nuclear research and power generation programs. The growing adoption of PET and CT scanners across public and private hospitals is creating sustained demand for inorganic scintillator materials with improved efficiency and durability. In addition, expanding industrial inspection activities in sectors such as oil & gas, aerospace, and manufacturing are supporting market growth. Supportive government initiatives promoting domestic manufacturing under programs such as Make in India, along with investments in scientific research institutions and radiation detection infrastructure, are further improving access to advanced scintillator technologies, positioning India as a high-growth market in the region.
Asia-Pacific Inorganic Scintillators Market Share
The Inorganic Scintillators industry is primarily led by well-established companies, including:
- Saint-Gobain (France)
- Hamamatsu Photonics (Japan)
- Hitachi Metals (Japan)
- CRYTUR (Czech Republic)
- AMCRYS-H (Ukraine)
- Scionix (Netherlands)
- Kinheng Crystal Materials (China)
- Shanghai SICCAS High Technology Corporation (China)
- Epic Crystal (China)
- Alpha Spectra (U.S.)
- Rexon Components & TLD Systems (U.S.)
- Detec (Germany)
- Scintacor (U.K.)
- Proteus Inc. (U.S.)
- Toshiba Materials (Japan)
- Oxide Corporation (Japan)
- Eljen Technology (U.S.)
- Teledyne Judson Technologies (U.S.)
- Zecotek Photonics (Canada)
Latest Developments in Asia-Pacific Inorganic Scintillators Market
- In March 2023, Thales Group entered into a strategic partnership with a major medical technology firm to develop next-generation medical imaging systems using advanced inorganic scintillators, combining expertise in radiation detection and diagnostic imaging to enhance healthcare diagnostic performance
- In September 2023, Tibidabo Scientific Industries completed the acquisition of LLA Instruments, expanding its portfolio with advanced material detection and identification technologies that include inorganic scintillator-based detectors for scientific and industrial applications
- In March 2025, Saint-Gobain launched a new line of high-performance inorganic scintillators specifically designed for medical imaging applications, offering improved light yield and faster response time to support advanced PET and SPECT diagnostic systems
- In February 2025, Hamamatsu Photonics introduced a new series of inorganic scintillators targeting industrial radiation detection with enhanced energy resolution and efficiency, demonstrating ongoing innovation in scintillation materials for both healthcare and safety markets
- In January 2025, Mirion Technologies launched a new range of scintillation detectors emphasizing nuclear security and homeland defense uses, reflecting broader adoption of inorganic scintillator technology across safety and security sectors
SKU-

- Interactive Data Analysis Dashboard
- Company Analysis Dashboard for high growth potential opportunities
- Research Analyst Access for customization & queries
- Competitor Analysis with Interactive dashboard
- Latest News, Updates & Trend analysis
- Harness the Power of Benchmark Analysis for Comprehensive Competitor Tracking
Data collection and base year analysis are done using data collection modules with large sample sizes. The stage includes obtaining market information or related data through various sources and strategies. It includes examining and planning all the data acquired from the past in advance. It likewise envelops the examination of information inconsistencies seen across different information sources. The market data is analysed and estimated using market statistical and coherent models. Also, market share analysis and key trend analysis are the major success factors in the market report. To know more, please request an analyst call or drop down your inquiry.
The key research methodology used by DBMR research team is data triangulation which involves data mining, analysis of the impact of data variables on the market and primary (industry expert) validation. Data models include Vendor Positioning Grid, Market Time Line Analysis, Market Overview and Guide, Company Positioning Grid, Patent Analysis, Pricing Analysis, Company Market Share Analysis, Standards of Measurement, Global versus Regional and Vendor Share Analysis. To know more about the research methodology, drop in an inquiry to speak to our industry experts.
Data Bridge Market Research is a leader in advanced formative research. We take pride in servicing our existing and new customers with data and analysis that match and suits their goal. The report can be customized to include price trend analysis of target brands understanding the market for additional countries (ask for the list of countries), clinical trial results data, literature review, refurbished market and product base analysis. Market analysis of target competitors can be analyzed from technology-based analysis to market portfolio strategies. We can add as many competitors that you require data about in the format and data style you are looking for. Our team of analysts can also provide you data in crude raw excel files pivot tables (Fact book) or can assist you in creating presentations from the data sets available in the report.


