
Asia Pacific Lab Automation Market
Market Size in USD Million
 USD
980.50 Million
USD
1,724.12 Million
2025
2033
USD
980.50 Million
USD
1,724.12 Million
2025
2033
| 2026 - 2033 | |
| USD 980.50 Million | |
| USD 1,724.12 Million | |
| % | |
|
Lab Automation Market Size
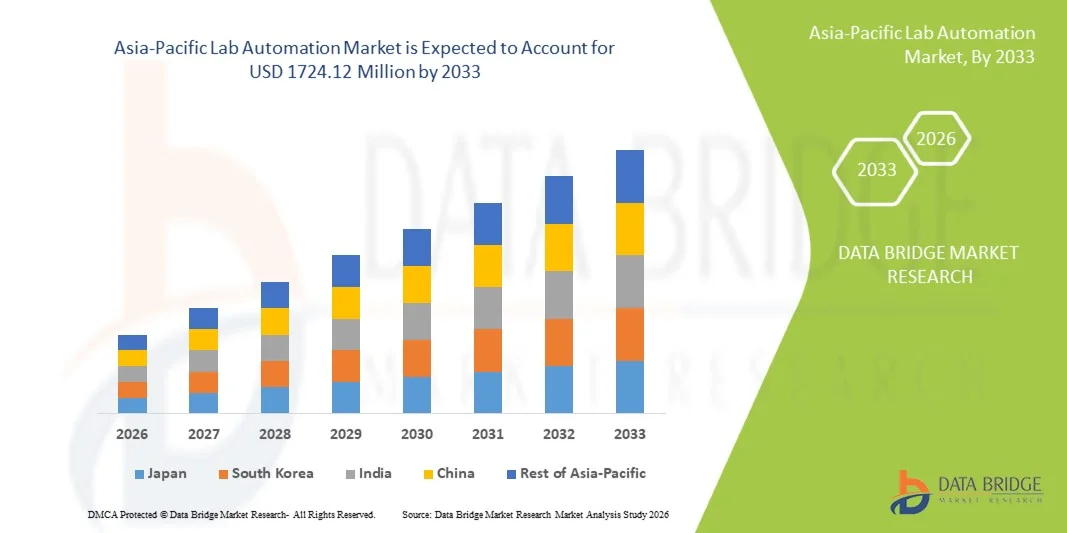
- The Asia-Pacific lab automation market size was valued at USD 980.50 Million in 2025and is expected to reach USD 1724.12 Million by 2033, at a CAGR of 7.31% during the forecast period
- The market growth is largely fueled by the increasing adoption of advanced robotics, artificial intelligence, and automated liquid handling systems in research laboratories and clinical diagnostic settings, leading to enhanced operational efficiency, reduced human error, and improved reproducibility across pharmaceutical, biotechnology, and academic research institutions
- Furthermore, rising demand for high-throughput screening, growing investments in drug discovery and genomics research, and the need for standardized and time-efficient laboratory workflows are establishing lab automation systems as essential components of modern laboratory infrastructure. These converging factors are accelerating the uptake of Lab Automation solutions, thereby significantly boosting the industry’s growth
Lab Automation Market Analysis
- Lab automation systems, including robotic liquid handling platforms, automated sample preparation systems, microplate readers, and integrated laboratory software, are increasingly becoming essential components of modern research and diagnostic laboratories due to their ability to enhance throughput, improve accuracy, and streamline complex workflows across pharmaceutical, biotechnology, and clinical settings
- The escalating demand for lab automation is primarily fueled by rising R&D investments in drug discovery, increasing demand for high-throughput screening, growing focus on precision medicine, and the need to minimize human error while improving laboratory efficiency and data integrity
- China dominated the lab automation market with the largest revenue share of 40.2% in 2025, driven by strong expansion of pharmaceutical manufacturing, large-scale government investments in biotechnology and life sciences research, rapid digital transformation of laboratories, and increasing adoption of AI-enabled automation systems across academic and industrial settings
- India is expected to be the fastest-growing region in the lab automation market during the forecast period, supported by rising investments in pharmaceutical and biotechnology sectors, growing number of research laboratories, increasing outsourcing of drug discovery and clinical testing activities, and rapid modernization of laboratory infrastructure across academic, clinical, and industrial research facilities
- The Modular Automation segment held the largest market revenue share of 57.6% in 2025, driven by its flexibility and cost-effectiveness
Report Scope and Lab Automation Market Segmentation
|
Attributes |
Lab Automation Key Market Insights |
|
Segments Covered |
· By Product Type: Equipment, Software & Informatics, and Analyzer · By Automation Type: Modular Automation and Total Lab Automation · By Application: Drug Discovery, Clinical Diagnostics, Genomics Solutions, Proteomics Solutions, Bio Analysis, Protein Engineering, Lyophilization, System Biology, Analytical Chemistry, and Others · By End Users: Biotechnology & Pharmaceuticals, Hospitals & Laboratories, Research and Academic Institutions, and Others |
|
Countries Covered |
Asia-Pacific · China · Japan · India · South Korea · Singapore · Malaysia · Australia · Thailand · Indonesia · Philippines · Rest of Asia-Pacific |
|
Key Market Players |
• Thermo Fisher Scientific Inc. (U.S.) |
|
Market Opportunities |
· Integration of AI, Robotics, and Data Analytics in Laboratory Workflows · Expansion of Automation in Emerging and Mid-Sized Laboratories |
|
Value Added Data Infosets |
In addition to the insights on market scenarios such as market value, growth rate, segmentation, geographical coverage, and major players, the market reports curated by the Data Bridge Market Research also include in-depth expert analysis, patient epidemiology, pipeline analysis, pricing analysis, and regulatory framework. |
Lab Automation Market Trends
“Integration of AI-Driven Robotics and Intelligent Workflow Management”
- A significant and accelerating trend in the Asia-Pacific Lab Automation market is the integration of artificial intelligence (AI), machine learning, and advanced robotics into laboratory workflows. These technologies are transforming traditional laboratory operations by enhancing accuracy, reducing manual errors, and significantly improving throughput across research, diagnostics, and pharmaceutical applications
- Modern automated platforms now incorporate robotic liquid handling systems, automated storage and retrieval units, and AI-powered data analytics tools that optimize experimental design and sample processing
- For instance, companies such as Thermo Fisher Scientific and Agilent Technologies are developing integrated lab automation systems that streamline genomics, proteomics, and drug discovery workflows
- AI-enabled lab software can analyze experimental data in real time, detect anomalies, and recommend protocol adjustments, thereby improving reproducibility and research efficiency. Automated liquid handlers and robotic arms are increasingly used in high-throughput screening and clinical diagnostics to minimize human intervention and enhance precision
- The integration of Laboratory Information Management Systems (LIMS) with automation platforms enables centralized data tracking, regulatory compliance management, and seamless coordination between instruments and researchers. Organizations such as Danaher Corporation are expanding their automation portfolios to provide end-to-end digital laboratory ecosystems
- This shift toward fully connected, intelligent laboratories is reshaping industry standards by promoting faster turnaround times, improved safety, and scalable research infrastructure. The demand for modular, customizable automation systems is growing across pharmaceutical, biotechnology, academic, and clinical laboratories worldwide
Lab Automation Market Dynamics
Driver
“Rising Demand for High-Throughput Research and Precision Diagnostics”
- The increasing need for high-throughput experimentation in drug discovery, genomics research, and clinical diagnostics is a primary driver of the Lab Automation market. Pharmaceutical and biotechnology companies are investing heavily in automated platforms to accelerate research timelines and reduce operational costs
- For instance, in 2024, Roche enhanced its automated diagnostic laboratory solutions to support faster molecular testing and large-scale sample processing, strengthening precision diagnostics capabilities. Likewise, Siemens Healthineers expanded its Atellica automation solutions to optimize clinical laboratory workflows and improve turnaround times
- Labor shortages in laboratory environments and the need to minimize human error are also encouraging adoption of robotic systems and automated sample handling technologies. Automation enhances reproducibility, ensures regulatory compliance, and supports standardized laboratory procedures
- In addition, increased funding for life sciences research and biotechnology innovation across major economies is contributing to widespread implementation of advanced lab automation infrastructure
Restraint/Challenge
“High Capital Investment and System Integration Complexity”
- The substantial upfront investment required for installing automated laboratory systems remains a significant challenge, particularly for small and medium-sized laboratories. Advanced robotic platforms, integrated software systems, and maintenance services involve high capital expenditure
- For instance, fully integrated robotic automation systems offered by companies such as Tecan Group and Hamilton Company require significant infrastructure upgrades and skilled technical staff, making adoption challenging for cost-sensitive laboratories
- The complexity of integrating automation systems with existing laboratory infrastructure and legacy software can create operational disruptions and require specialized expertise. Ensuring interoperability between instruments, data management platforms, and workflow software remains a key concern
- Moreover, resistance to technological change and the need for workforce training can slow adoption rates. Skilled personnel are required to operate, maintain, and troubleshoot automated systems effectively
- Addressing these challenges through scalable automation solutions, cloud-based data platforms, cost-effective modular systems, and comprehensive training programs will be essential for sustained growth in the global Lab Automation market
Lab Automation Market Scope
The market is segmented on the basis of product type, automation type, application, and end users.
- By Product Type
On the basis of product type, the Lab Automation market is segmented into Equipment, Software & Informatics, and Analyzer. The Equipment segment dominated the largest market revenue share of 49.4% in 2025, driven by high demand for robotic systems, automated liquid handling platforms, microplate readers, and storage systems across pharmaceutical and biotechnology laboratories. Laboratories increasingly invest in automated workstations to enhance throughput and minimize human error. Growing drug discovery activities and rising R&D expenditure further support equipment adoption. Automation equipment improves workflow efficiency and ensures reproducibility of experimental results. Expansion of high-throughput screening programs strengthens segment demand. Increasing need for contamination-free environments accelerates robotic integration. Large pharmaceutical firms prioritize capital investment in advanced laboratory infrastructure. Continuous technological upgrades in robotics and motion control systems enhance operational precision. Equipment-based automation reduces labor costs and improves productivity. Strong procurement budgets in developed markets further sustain growth. Overall, the equipment segment maintains dominance due to essential infrastructure requirements and high capital deployment in laboratory settings.
The Software & Informatics segment is anticipated to witness the fastest CAGR of 11.8% from 2026 to 2033, fueled by rising adoption of laboratory information management systems (LIMS) and data analytics platforms. Increasing data generation from genomics and proteomics research drives demand for advanced informatics tools. Laboratories require seamless integration between instruments and digital reporting systems. Cloud-based laboratory software enhances scalability and remote accessibility. Growing emphasis on regulatory compliance and data traceability strengthens adoption. Artificial intelligence and machine learning integration improves predictive analysis capabilities. Pharmaceutical companies focus on digital transformation strategies to accelerate innovation cycles. Demand for cybersecurity solutions in laboratory environments also supports growth. Subscription-based software models reduce upfront investment barriers. Expansion of precision medicine initiatives further accelerates informatics adoption. Overall, software & informatics represent the fastest-growing segment due to digitalization trends and the need for efficient data management.
- By Automation Type
On the basis of automation type, the Lab Automation market is segmented into Modular Automation and Total Lab Automation. The Modular Automation segment held the largest market revenue share of 57.6% in 2025, driven by its flexibility and cost-effectiveness. Laboratories prefer modular systems that can be customized and expanded based on specific workflow requirements. Small and mid-sized labs particularly benefit from incremental automation investments. Modular platforms enable integration of individual instruments without complete infrastructure overhaul. Growing demand for adaptable research environments supports segment leadership. Pharmaceutical companies adopt modular systems for targeted drug screening tasks. Reduced installation complexity enhances adoption rates. Continuous product innovations improve compatibility between modules. Budget constraints in emerging markets further favor modular solutions. Overall, modular automation dominates due to scalability, affordability, and operational flexibility.
The Total Lab Automation segment is expected to witness the fastest CAGR of 12.5% from 2026 to 2033, driven by increasing need for end-to-end workflow integration. Large research institutions and pharmaceutical companies invest in fully automated laboratories to maximize throughput. Total lab automation minimizes manual intervention and reduces turnaround time. Rising focus on high-volume clinical diagnostics accelerates adoption. Integration of robotics, conveyors, and centralized software platforms enhances efficiency. Growing labor shortages in laboratory environments support automation expansion. Advanced system integration improves quality control and reproducibility. Expansion of personalized medicine initiatives further strengthens demand. Overall, total lab automation is the fastest-growing automation type due to rising complexity of laboratory processes and demand for seamless integration.
- By Application
On the basis of application, the Lab Automation market is segmented into Drug Discovery, Clinical Diagnostics, Genomics Solutions, Proteomics Solutions, Bio Analysis, Protein Engineering, Lyophilization, System Biology, Analytical Chemistry, and Others. The Drug Discovery segment dominated with a revenue share of 29.8% in 2025, driven by rising pharmaceutical R&D investments and increasing demand for high-throughput screening technologies. Automation significantly accelerates compound screening and validation processes. Pharmaceutical firms leverage robotic systems to enhance accuracy and reduce development timelines. Growing pipeline of biologics and specialty drugs strengthens automation demand. Integration of AI-based predictive models further enhances drug discovery efficiency. Strong venture capital funding in biotech startups supports adoption. Increasing regulatory pressure for data integrity also drives automation. Overall, drug discovery maintains leadership due to high R&D intensity and technological advancements.
The Clinical Diagnostics segment is projected to register the fastest CAGR of 13.1% from 2026 to 2033, fueled by rising demand for rapid and accurate diagnostic testing. Growing prevalence of infectious and chronic diseases supports automation adoption in diagnostic laboratories. Hospitals require high-throughput analyzers for large sample volumes. Automation reduces turnaround time and enhances diagnostic precision. Expansion of molecular diagnostics further accelerates segment growth. Increasing public health initiatives and screening programs drive demand. Integration of automated sample processing improves workflow efficiency. Overall, clinical diagnostics is the fastest-growing application due to rising testing volumes and healthcare infrastructure expansion.
- By End Users
On the basis of end users, the Lab Automation market is segmented into Biotechnology & Pharmaceuticals, Hospitals & Laboratories, Research and Academic Institutions, and Others. The Biotechnology & Pharmaceuticals segment dominated with a revenue share of 46.2% in 2025, driven by extensive use of automation in drug development and biologics research. Companies invest heavily in automated platforms to accelerate innovation. Increasing competition in pharmaceutical pipelines strengthens automation demand. Integration of robotics enhances productivity and ensures data accuracy. Strong R&D budgets further sustain growth. Overall, biotech and pharmaceutical companies lead due to intensive research activities and high automation adoption.
The Hospitals & Laboratories segment is expected to witness the fastest CAGR of 11.4% from 2026 to 2033, driven by increasing diagnostic testing volumes and need for workflow optimization. Rising demand for automated clinical analyzers supports adoption. Hospitals prioritize automation to reduce errors and improve patient outcomes. Expansion of centralized laboratory networks further accelerates growth. Integration of digital reporting systems enhances operational efficiency. Overall, hospitals and laboratories are the fastest-growing end-user segment due to increasing diagnostic demand and healthcare modernization.
Lab Automation Market Regional Analysis
- Asia-Pacific lab automation market is expected to be the fastest-growing region in the Lab Automation market during the forecast period, driven by expanding pharmaceutical manufacturing capacity, increasing government support for life sciences research, rising investments in biotechnology startups, and rapid modernization of laboratory infrastructure across countries such as China, India, and South Korea
- Improving healthcare infrastructure, growing CRO presence, and increasing clinical trial activity are accelerating the adoption of automated liquid handling, sample management, and diagnostic platforms
- In addition, cost-effective manufacturing capabilities in the region are encouraging both domestic production and foreign investment in laboratory automation technologies
China Lab Automation Market Insight
China dominated the lab automation market with the largest revenue share of 40.2% in 2025, driven by strong expansion of pharmaceutical manufacturing, large-scale government investments in biotechnology and life sciences research, rapid digital transformation of laboratories, and increasing adoption of AI-enabled automation systems across academic and industrial settings. The country’s growing focus on strengthening domestic innovation capabilities, expanding biopharmaceutical production facilities, and modernizing clinical and research laboratories is further accelerating market growth.
India Lab Automation Market Insight
India is expected to be the fastest-growing region in the lab automation market during the forecast period, supported by rising investments in pharmaceutical and biotechnology sectors, growing number of research laboratories, increasing outsourcing of drug discovery and clinical testing activities, and rapid modernization of laboratory infrastructure across academic, clinical, and industrial research facilities. The expanding presence of contract research organizations (CROs) and government initiatives promoting life sciences innovation are further fueling market expansion in the country.
Lab Automation Market Share
The Lab Automation industry is primarily led by well-established companies, including:
• Thermo Fisher Scientific Inc. (U.S.)
• Agilent Technologies, Inc. (U.S.)
• Danaher Corporation (U.S.)
• PerkinElmer Inc. (U.S.)
• Roche Diagnostics (Switzerland)
• Siemens Healthineers AG (Germany)
• Abbott Laboratories (U.S.)
• Bio-Rad Laboratories, Inc. (U.S.)
• Tecan Group Ltd. (Switzerland)
• Hamilton Company (U.S.)
• Beckman Coulter, Inc. (U.S.)
• Bruker Corporation (U.S.)
• Eppendorf SE (Germany)
• Shimadzu Corporation (Japan)
• Hudson Robotics, Inc. (U.S.)
• Aurora Biomed Inc. (Canada)
• Becton, Dickinson and Company (U.S.)
• QIAGEN N.V. (Netherlands)
• Waters Corporation (U.S.)
• Analytik Jena GmbH (Germany)
Latest Developments in Asia-Pacific Lab Automation Market
- In September 2023, Bio-Rad Laboratories launched the PTC Tempo 48/48 and PTC Tempo 384 thermal cyclers, advanced systems designed to enhance PCR applications such as sequencing, cloning, and genotyping, helping laboratories increase throughput and flexibility in automated molecular workflows
- In October 2023, Thermo Fisher Scientific introduced a next-generation automated laboratory system that integrates high-throughput sample processing with AI-driven data analysis to streamline genomic research workflows, reducing errors and accelerating results in genomics applications
- In July 2024, Thermo Fisher Scientific launched a major upgrade to its lab automation portfolio, unveiling a comprehensive end-to-end platform for high-throughput liquid and plate handling designed to support diverse workflows in drug discovery and clinical laboratories
- In July 2024, INPECO SA launched FlexLab X, a next-generation total lab automation (TLA) system showcased at the Annual Scientific Meeting of the Association for Diagnostics & Laboratory Medicine (ADLM 2024). FlexLab X can integrate analyzers from different vendors, offer space-saving layouts, and simplify workflows with an intuitive user interface
- In December 2024, Beckman Coulter announced a multi-year contract to deploy unified automated immunoassay and sample-preparation systems across multiple sites for a leading biopharma company, reflecting strong industry demand for standardized, scalable automation solutions
- In January 2025, ABB Robotics and Agilent Technologies forged a strategic partnership to deliver automated laboratory solutions that combine advanced robotics with analytical instrumentation, enhancing precision, flexibility, and automation capabilities across diverse laboratory settings
- In May 2025, Trilobio raised $8 million in seed investment to expand its robotic lab capabilities and no-code automation software, enabling a growing portfolio of purpose-built lab devices and protocols in integrated, fully automated platforms aimed at small and mid-size labs
- In August 2025, the global lab automation market was highlighted for continued growth driven by AI integration and advanced tech solutions, with companies increasingly adopting automation platforms that streamline workflows, optimize resource use, and reduce manual processes, underscoring automation’s rising role in laboratory operations
SKU-

- Interactive Data Analysis Dashboard
- Company Analysis Dashboard for high growth potential opportunities
- Research Analyst Access for customization & queries
- Competitor Analysis with Interactive dashboard
- Latest News, Updates & Trend analysis
- Harness the Power of Benchmark Analysis for Comprehensive Competitor Tracking
Data collection and base year analysis are done using data collection modules with large sample sizes. The stage includes obtaining market information or related data through various sources and strategies. It includes examining and planning all the data acquired from the past in advance. It likewise envelops the examination of information inconsistencies seen across different information sources. The market data is analysed and estimated using market statistical and coherent models. Also, market share analysis and key trend analysis are the major success factors in the market report. To know more, please request an analyst call or drop down your inquiry.
The key research methodology used by DBMR research team is data triangulation which involves data mining, analysis of the impact of data variables on the market and primary (industry expert) validation. Data models include Vendor Positioning Grid, Market Time Line Analysis, Market Overview and Guide, Company Positioning Grid, Patent Analysis, Pricing Analysis, Company Market Share Analysis, Standards of Measurement, Global versus Regional and Vendor Share Analysis. To know more about the research methodology, drop in an inquiry to speak to our industry experts.
Data Bridge Market Research is a leader in advanced formative research. We take pride in servicing our existing and new customers with data and analysis that match and suits their goal. The report can be customized to include price trend analysis of target brands understanding the market for additional countries (ask for the list of countries), clinical trial results data, literature review, refurbished market and product base analysis. Market analysis of target competitors can be analyzed from technology-based analysis to market portfolio strategies. We can add as many competitors that you require data about in the format and data style you are looking for. Our team of analysts can also provide you data in crude raw excel files pivot tables (Fact book) or can assist you in creating presentations from the data sets available in the report.


