
Asia Pacific Lymphedema Treatment Market
Market Size in USD Million
 USD
153.62 Million
USD
402.64 Million
2025
2033
USD
153.62 Million
USD
402.64 Million
2025
2033
| 2026 - 2033 | |
| USD 153.62 Million | |
| USD 402.64 Million | |
| % | |
|
Asia-Pacific Lymphedema Treatment Market Overview
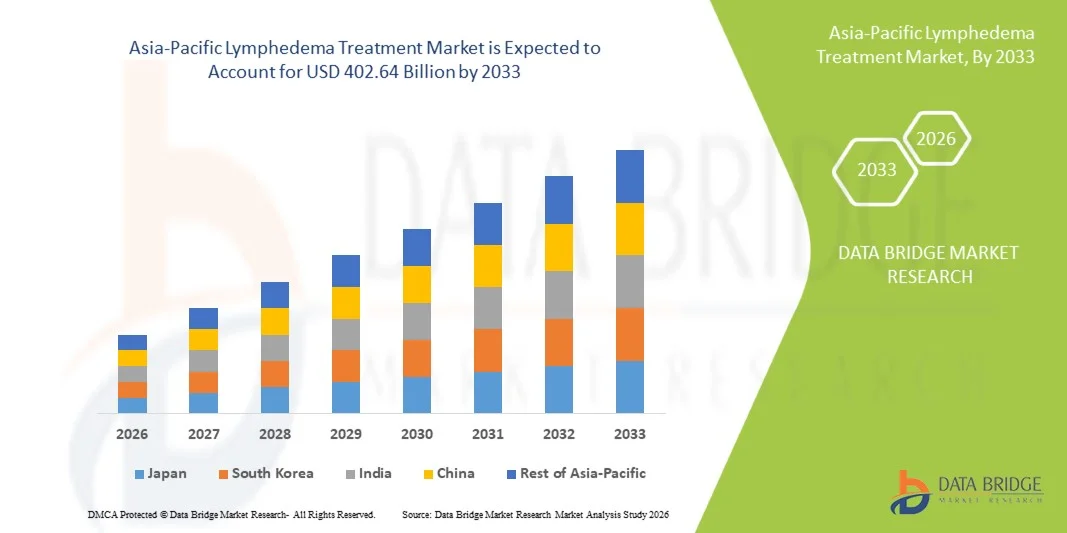
The Asia-Pacific lymphedema treatment market was valued at USD 153.62 million in 2025 and is projected to reach USD 402.64 million by 2033, growing at a CAGR of 12.80% from 2026 to 2033. The market is witnessing steady growth driven by the increasing prevalence of cancer-related lymphedema, rising awareness regarding chronic lymphatic disorders, and improving access to advanced compression and physiotherapy solutions across emerging economies.
The growing number of breast cancer surgeries, expanding elderly population, and increasing incidence of obesity and vascular disorders are contributing significantly to regional demand for lymphedema treatment products and therapies. In addition, improving healthcare infrastructure, greater adoption of compression garments and pneumatic compression devices, and supportive government initiatives for rehabilitation care are encouraging hospitals, specialty clinics, and homecare providers to integrate advanced lymphedema management solutions.
Key Market Trends & Insights
- China dominated the Asia-Pacific lymphedema treatment market with the largest revenue share of 34.27% in 2025, supported by rising cancer incidence, expanding rehabilitation infrastructure, and increasing awareness regarding lymphatic disorder management.
- The Compression Therapy segment led the market with a 42.18% share in 2025, driven by its widespread clinical adoption, non-invasive nature, and effectiveness in long-term lymphedema symptom management.
- India is expected to be the fastest-growing country market at a CAGR of 7.4% from 2026 to 2033, fueled by improving healthcare access, increasing oncology procedures, and growing adoption of advanced treatment solutions.
- The Surgery segment is the fastest-growing treatment type, projected to register a CAGR of 7.0%, reflecting rising demand for advanced microsurgical procedures and improved post-operative outcomes.
- The Secondary Lymphedema segment dominates the type category with a 69.36% revenue share in 2025, led by the increasing number of cancer surgeries, radiation therapies, and lymph node removal procedures.
- Lower Extremity accounts for 46.51% of the market in 2025, preferred due to the high prevalence of chronic venous disorders, obesity-related complications, and post-cancer treatment-associated swelling conditions.
- The Geriatric segment is the fastest-growing age group category, with a CAGR of 7.1% from 2026 to 2033, driven by the rapidly aging population and increasing prevalence of chronic diseases associated with lymphatic complications.
Market Size & Forecast
- Global Market Value (2025): USD 153.62 Million
- Expected Market Value (2033): USD 402.64 Million
- Forecast CAGR (2026–2033): 12.80%
- Leading Country in 2025: China
- Fastest Growing Country: India
Report Scope and Asia-Pacific Lymphedema Treatment Market Segmentation
|
Attributes |
Asia-Pacific Lymphedema Treatment Key Market Insights |
|
Segments Covered |
|
|
Countries Covered |
Asia-Pacific · China · Japan · India · South Korea · Singapore · Malaysia · Australia · Thailand · Indonesia · Philippines · Rest of Asia-Pacific |
|
Key Market Players |
· Essity Aktiebolag (Sweden) · Sigvaris Group (Switzerland) · medi GmbH & Co. KG (Germany) · Lohmann & Rauscher GmbH & Co. KG (Germany) · Paul Hartmann AG (Germany) · Julius Zorn GmbH (Germany) · ArjoHuntleigh (Getinge AB) (Sweden) · Thuasne SAS (France) · BSN Medical GmbH (Essity) (Germany) · 3M (U.S.) · Cardinal Health Inc. (U.S.) · Smith & Nephew (U.K.) · ConvaTec Group plc (U.K.) · DJO Global Inc. (U.S.) · Bio Compression Systems Inc. (U.S.) · Mego Afek Ltd. (Israel) · Devon Medical Products (U.S.) · AIROS Medical Inc. (U.S.) · Tactile Systems Technology Inc. (U.S.) · Dynamic Techno Medicals Pvt Ltd (India) |
|
Market Opportunities |
· Growing adoption of home-based pneumatic compression devices · Rising demand for post-cancer rehabilitation services · Increasing research into regenerative medicine and lymphatic microsurgery |
|
Value Added Data Infosets |
In addition to the insights on market scenarios such as market value, growth rate, segmentation, geographical coverage, and major players, the market reports curated by the Data Bridge Market Research also include in-depth expert analysis, patient epidemiology, pipeline analysis, pricing analysis, and regulatory framework. |
Asia-Pacific Lymphedema Treatment Market Trends
Trend: Rising Adoption of Compression Therapy and Home-Based Care Solutions
Healthcare providers and patients across the Asia-Pacific region are increasingly adopting compression garments, pneumatic compression devices, and home-based physiotherapy solutions for long-term lymphedema management. Growing awareness regarding post-cancer rehabilitation and chronic swelling disorders is encouraging the use of non-invasive therapies that improve patient mobility and quality of life. In addition, advancements in lightweight compression materials, portable treatment devices, and digital monitoring technologies are enabling more convenient and personalized treatment experiences, particularly among aging and post-surgical patient populations.
Asia-Pacific Lymphedema Treatment Market Dynamics
Key Market Driver: Increasing Prevalence of Cancer-Related Secondary Lymphedema
The growing incidence of breast cancer, gynecological cancer, and other oncology conditions across Asia-Pacific has significantly increased the number of patients developing secondary lymphedema following surgery, radiation therapy, and lymph node removal procedures. Hospitals, rehabilitation centers, and specialty clinics are increasingly integrating advanced lymphedema management programs to address long-term post-treatment complications. Rising healthcare expenditure, expanding cancer screening initiatives, and improving awareness regarding early diagnosis and rehabilitation are further supporting market growth across major countries including China, India, and Japan.
Key Restraint/Challenge: Limited Awareness and Access to Specialized Treatment
A major challenge in the Asia-Pacific lymphedema treatment market is the limited awareness regarding early diagnosis and management of lymphatic disorders, particularly in developing and rural regions. Many patients remain untreated or undiagnosed due to insufficient availability of trained lymphatic therapists, limited reimbursement coverage, and restricted access to specialized rehabilitation centers. In addition, the long-term nature of treatment involving compression therapy, physiotherapy, and follow-up care increases the financial burden on patients, limiting treatment adherence in cost-sensitive markets.
For instance, several rural healthcare facilities across India and Southeast Asian countries continue to face shortages of certified lymphedema specialists and advanced rehabilitation equipment, resulting in delayed diagnosis and limited access to comprehensive treatment services for post-cancer patients.
Key Market Opportunity: Expansion of Advanced Rehabilitation and Minimally Invasive Treatment Technologies
The growing integration of advanced rehabilitation programs, minimally invasive surgical procedures, and technologically enhanced compression therapy solutions presents a significant market opportunity. Healthcare providers are increasingly investing in laser therapy systems, microsurgical techniques, and portable pneumatic compression devices to improve patient outcomes and treatment efficiency. The expansion of telehealth-supported rehabilitation services and rising healthcare investments across emerging Asia-Pacific economies are further creating growth opportunities for manufacturers and specialty care providers operating in the regional lymphedema treatment market.
Asia-Pacific Lymphedema Treatment Market Scope
The Asia-Pacific Lymphedema Treatment market is segmented on the basis of treatment type, type, affected area, age group, route of administration, end user, and distribution channel.
- By Treatment Type
On the basis of treatment type, the Asia Pacific lymphedema treatment market is segmented into compression therapy, surgery, drug therapy, laser therapy, and others. The Compression Therapy segment dominated the market with a 42.18% share in 2025, owing to its widespread adoption as the first-line treatment for lymphedema management across hospitals, rehabilitation centers, and homecare settings. Compression garments, bandages, and pneumatic compression devices are extensively utilized to reduce swelling, improve lymphatic drainage, and prevent disease progression. The non-invasive nature, cost-effectiveness, and long-term therapeutic benefits of compression therapy continue to support strong adoption across both developed and emerging Asia-Pacific countries.
The Surgery segment is projected to register the fastest growth at a CAGR of 7.0% from 2026 to 2033, driven by rising demand for advanced microsurgical procedures such as lymphovenous bypass and vascularized lymph node transfer. Increasing awareness regarding minimally invasive interventions, improving surgical infrastructure, and growing availability of specialized lymphedema surgeons are accelerating segment growth. Expanding healthcare investments across China, India, Japan, and South Korea are further supporting the adoption of surgical treatment solutions for severe and chronic lymphedema cases.
- By Type
On the basis of type, the Asia Pacific lymphedema treatment market is segmented into secondary lymphedema and primary lymphedema. The Secondary Lymphedema segment led the market with a 69.36% share in 2025, supported by the growing incidence of cancer-related lymphedema following breast cancer surgeries, radiation therapy, and lymph node removal procedures. Increasing oncology treatment volumes and rising survival rates among cancer patients are contributing significantly to long-term lymphedema management demand. Hospitals and specialty rehabilitation centers across the region are increasingly integrating dedicated post-cancer rehabilitation programs, further strengthening segment dominance.
The Primary Lymphedema segment is expected to experience the fastest growth at a CAGR of 6.8% from 2026 to 2033, driven by improving awareness regarding congenital lymphatic disorders and advancements in diagnostic capabilities. Increasing availability of early-stage treatment and rehabilitation programs is supporting patient identification and disease management. In addition, expanding healthcare accessibility in emerging Asia-Pacific economies is encouraging earlier diagnosis and treatment intervention among pediatric and adult patient populations.
- By Affected Area
On the basis of affected area, the Asia Pacific lymphedema treatment market is segmented into lower extremity, upper extremity, and genitalia. The Lower Extremity segment dominated the market with a 46.51% share in 2025, owing to the high prevalence of swelling conditions associated with obesity, chronic venous insufficiency, cancer treatment complications, and reduced mobility among geriatric populations. Lower limb lymphedema cases require continuous long-term management through compression therapy and physiotherapy, contributing to sustained treatment demand. Increasing sedentary lifestyles and rising chronic disease prevalence across Asia-Pacific countries are further supporting segment growth.
The Upper Extremity segment is projected to witness the fastest growth at a CAGR of 6.9% from 2026 to 2033, driven by the increasing incidence of breast cancer-related lymphedema among women across the region. Growing awareness regarding post-operative rehabilitation and improved access to oncology rehabilitation services are encouraging early treatment adoption. Technological advancements in compression sleeves and physiotherapy solutions are also supporting segment expansion in both hospital and homecare settings.
- By Age Group
On the basis of age group, the Asia Pacific lymphedema treatment market is segmented into adult, geriatric, and pediatric. The Adult segment led the market with a 48.74% share in 2025, supported by the high incidence of cancer surgeries, obesity-related complications, and chronic vascular disorders among the working-age population. Adults represent the largest patient pool requiring long-term rehabilitation and compression therapy solutions across the region. Increasing awareness regarding early diagnosis and expanding healthcare access are further contributing to segment dominance.
The Geriatric segment is anticipated to register the fastest growth at a CAGR of 7.1% from 2026 to 2033, driven by the rapidly aging population in countries such as Japan, China, and South Korea. Elderly individuals are more susceptible to chronic circulatory disorders, reduced lymphatic function, and post-surgical complications requiring prolonged lymphedema management. Rising demand for home-based rehabilitation and supportive elderly care services is further accelerating segment growth.
- By Route of Administration
On the basis of route of administration, the Asia Pacific lymphedema treatment market is segmented into oral, injectable, and topical. The Oral segment dominated the market with a 44.26% share in 2025, owing to the widespread use of oral medications for inflammation management, pain relief, and supportive therapy in lymphedema treatment protocols. Oral administration offers greater patient convenience, easier compliance, and broad accessibility across outpatient and homecare settings. Increasing availability of supportive pharmacological therapies is also contributing to sustained segment demand.
The Injectable segment is projected to experience the fastest growth at a CAGR of 6.7% from 2026 to 2033, driven by increasing use of advanced biologics, targeted therapies, and supportive injectable treatments in severe lymphedema management. Improvements in hospital-based treatment infrastructure and rising adoption of specialized rehabilitation procedures are supporting market expansion. Growing investments in lymphatic disorder research are further expected to accelerate injectable therapy development.
- By End User
On the basis of end user, the Asia Pacific lymphedema treatment market is segmented into hospital, speciality clinics, ambulatory surgical centers, and others. The Hospital segment led the market with a 51.33% share in 2025, supported by increasing patient admissions for cancer treatment, rehabilitation therapies, and surgical interventions associated with lymphedema care. Hospitals provide multidisciplinary treatment approaches involving physiotherapy, compression therapy, and post-operative rehabilitation, making them the primary treatment centers across the region. Expanding healthcare infrastructure investments are further strengthening hospital segment dominance.
The Speciality Clinics segment is expected to witness the fastest growth at a CAGR of 7.2% from 2026 to 2033, driven by rising demand for personalized rehabilitation services and specialized lymphatic disorder treatment programs. Increasing availability of certified lymphedema therapists and advanced outpatient treatment solutions is supporting segment growth. Patients are increasingly preferring speciality clinics for long-term monitoring and customized therapy management, particularly in urban healthcare markets.
- By Distribution Channel
On the basis of distribution channel, the Asia Pacific lymphedema treatment market is segmented into pharmacy stores, direct tender, and others. The Pharmacy Stores segment dominated the market with a 47.68% share in 2025, owing to the widespread availability of compression garments, medications, and supportive care products through retail and hospital pharmacy networks. Increasing consumer preference for convenient product accessibility and expanding pharmacy distribution infrastructure across urban and semi-urban markets are supporting segment growth. Rising awareness regarding long-term lymphedema management is also contributing to sustained demand through pharmacy channels.
The Direct Tender segment is projected to register the fastest growth at a CAGR of 6.9% from 2026 to 2033, driven by increasing procurement activities by hospitals, rehabilitation centers, and government healthcare institutions. Bulk purchasing agreements for compression devices, physiotherapy equipment, and supportive treatment products are expanding across public healthcare systems in Asia-Pacific countries. Growing government investments in cancer rehabilitation and chronic disease management programs are further accelerating segment expansion.
Asia-Pacific Lymphedema Treatment Market Regional Analysis
China dominated the Asia-Pacific lymphedema treatment market with the largest revenue share of 34.27% in 2025, supported by rising cancer incidence, expanding rehabilitation infrastructure, and increasing awareness regarding lymphatic disorder management. The country also benefits from rising awareness regarding post-cancer lymphedema management, growing healthcare expenditure, and improving access to specialized treatment services across hospitals and rehabilitation centers. Increasing investments in oncology care, supportive government healthcare initiatives, and growing demand for minimally invasive treatment technologies continue to strengthen China’s leadership position in the Asia-Pacific lymphedema treatment market.
The China Lymphedema Treatment Market Insight
The China lymphedema treatment market is witnessing strong growth due to rising cancer incidence, increasing post-surgical complications, and expanding adoption of advanced rehabilitation therapies. The country’s large patient base, improving oncology care infrastructure, and growing availability of compression therapy devices are driving demand across hospitals and specialty clinics. In addition, rising awareness regarding secondary lymphedema management, increasing healthcare expenditure, and government focus on cancer care support programs are accelerating market adoption. The growing integration of physiotherapy services and home-based treatment solutions continues to strengthen China’s dominant position in the Asia-Pacific lymphedema treatment market, accounting for the largest regional share.
India Lymphedema Treatment Market Insight
The India lymphedema treatment market is experiencing rapid growth, driven by increasing cancer prevalence, improving healthcare access, and rising awareness regarding post-surgical lymphatic complications. Expanding hospital infrastructure, growing penetration of specialty clinics, and increasing availability of affordable compression therapy products are supporting market expansion. Furthermore, government initiatives aimed at strengthening oncology care, rising medical tourism, and growing demand for homecare-based treatment solutions are contributing to increased adoption. The emergence of trained physiotherapists and expanding rehabilitation services is further accelerating market development across urban and semi-urban regions.
Japan Lymphedema Treatment Market Insight
The Japan lymphedema treatment market is witnessing consistent growth due to its rapidly aging population, high cancer survival rates, and strong focus on post-treatment rehabilitation. Advanced healthcare infrastructure, widespread adoption of compression garments, and increasing use of pneumatic compression devices are supporting market demand. In addition, strong integration of rehabilitation services within hospital systems, high awareness of chronic disease management, and continuous technological advancements in medical devices are driving market expansion. The growing emphasis on home-based care and long-term patient monitoring is further strengthening Japan’s position in the regional market.
South Korea Lymphedema Treatment Market Insight
The South Korea lymphedema treatment market is expanding steadily, driven by increasing cancer treatment rates, strong healthcare infrastructure, and rising adoption of advanced rehabilitation technologies. High penetration of specialized oncology centers and growing availability of compression therapy and physiotherapy services are supporting market growth. In addition, the country’s focus on early diagnosis, advanced medical device adoption, and integration of digital health solutions is enhancing treatment efficiency. Increasing awareness regarding post-operative complications and growing demand for minimally invasive and home-based care solutions are further contributing to market expansion.
Asia-Pacific Lymphedema Treatment Market Share
The Asia-Pacific Lymphedema Treatment industry is primarily led by well-established companies, including:
- Essity Aktiebolag (Sweden)
- Sigvaris Group (Switzerland)
- medi GmbH & Co. KG (Germany)
- Lohmann & Rauscher GmbH & Co. KG (Germany)
- Paul Hartmann AG (Germany)
- Julius Zorn GmbH (Germany)
- ArjoHuntleigh (Getinge AB) (Sweden)
- Thuasne SAS (France)
- BSN Medical GmbH (Essity) (Germany)
- 3M (U.S.)
- Cardinal Health Inc. (U.S.)
- Smith & Nephew (U.K.)
- ConvaTec Group plc (U.K.)
- DJO Global Inc. (U.S.)
- Bio Compression Systems Inc. (U.S.)
- Mego Afek Ltd. (Israel)
- Devon Medical Products (U.S.)
- AIROS Medical Inc. (U.S.)
- Tactile Systems Technology Inc. (U.S.)
- Dynamic Techno Medicals Pvt Ltd (India)
Latest Developments in Asia-Pacific Lymphedema Treatment Market
- In March 2024, Tactile Medical announced expanded clinical adoption of its Flexitouch Plus system across international markets, including increased utilization in Asia-Pacific healthcare facilities. The system is designed for treating primary and secondary lymphedema through advanced pneumatic compression therapy. Growing physician adoption highlights increasing demand for home-based and hospital-to-home treatment models
- In October 2023, researchers published findings on advanced microsurgical techniques such as lymphovenous bypass (LVB) and vascularized lymph node transfer (VLNT), improving surgical outcomes for lymphedema patients. These procedures are increasingly adopted in Asia-Pacific countries with advanced healthcare infrastructure such as Japan and South Korea
- In June 2023, the U.S. Food and Drug Administration (FDA) cleared updated indications for pneumatic compression devices such as Tactile Medical’s Flexitouch system, expanding their clinical use for lymphedema management. This development strengthened global clinical adoption of advanced compression therapy solutions widely used in Asia-Pacific hospitals and homecare settings
- In May 2022, Essity expanded its compression garment portfolio, strengthening its global supply chain for medical compression therapy products used in lymphedema care. The company’s products are widely distributed across Asia-Pacific hospitals and pharmacies. The expansion improved availability of high-quality compression garments for long-term treatment
- In February 2021, Japan’s Ministry of Health, Labour and Welfare strengthened reimbursement support for post-cancer rehabilitation services, including lymphedema management therapies. This policy change improved patient access to compression therapy and physiotherapy-based treatments. It encouraged hospitals to expand structured rehabilitation programs for cancer survivors. The initiative supports Japan’s aging population and rising cancer survival rates
SKU-

- Interactive Data Analysis Dashboard
- Company Analysis Dashboard for high growth potential opportunities
- Research Analyst Access for customization & queries
- Competitor Analysis with Interactive dashboard
- Latest News, Updates & Trend analysis
- Harness the Power of Benchmark Analysis for Comprehensive Competitor Tracking
Data collection and base year analysis are done using data collection modules with large sample sizes. The stage includes obtaining market information or related data through various sources and strategies. It includes examining and planning all the data acquired from the past in advance. It likewise envelops the examination of information inconsistencies seen across different information sources. The market data is analysed and estimated using market statistical and coherent models. Also, market share analysis and key trend analysis are the major success factors in the market report. To know more, please request an analyst call or drop down your inquiry.
The key research methodology used by DBMR research team is data triangulation which involves data mining, analysis of the impact of data variables on the market and primary (industry expert) validation. Data models include Vendor Positioning Grid, Market Time Line Analysis, Market Overview and Guide, Company Positioning Grid, Patent Analysis, Pricing Analysis, Company Market Share Analysis, Standards of Measurement, Global versus Regional and Vendor Share Analysis. To know more about the research methodology, drop in an inquiry to speak to our industry experts.
Data Bridge Market Research is a leader in advanced formative research. We take pride in servicing our existing and new customers with data and analysis that match and suits their goal. The report can be customized to include price trend analysis of target brands understanding the market for additional countries (ask for the list of countries), clinical trial results data, literature review, refurbished market and product base analysis. Market analysis of target competitors can be analyzed from technology-based analysis to market portfolio strategies. We can add as many competitors that you require data about in the format and data style you are looking for. Our team of analysts can also provide you data in crude raw excel files pivot tables (Fact book) or can assist you in creating presentations from the data sets available in the report.


