
Asia Pacific Lyophilized Injectable Drugs Market
Market Size in USD Billion
 USD
1.00 Billion
USD
1.81 Billion
2024
2032
USD
1.00 Billion
USD
1.81 Billion
2024
2032
| 2025 - 2032 | |
| USD 1.00 Billion | |
| USD 1.81 Billion | |
| % | |
|
Asia-Pacific Lyophilized Injectable Drugs Market Size
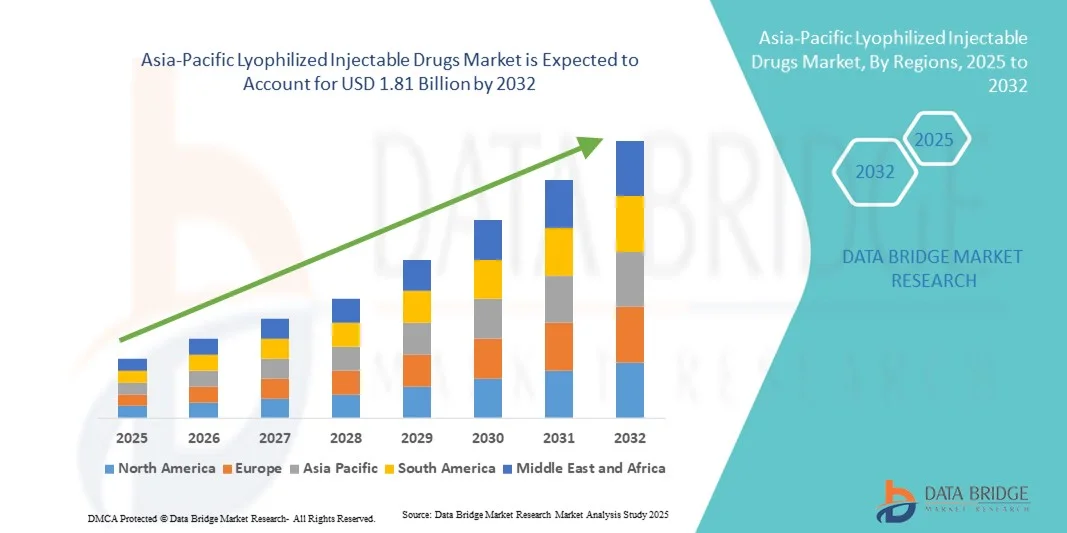
- The Asia-Pacific lyophilized injectable drugs market size was valued at USD 1.00 billion in 2024 and is expected to reach USD 1.81 billion by 2032, at a CAGR of 7.7% during the forecast period
- The market growth is primarily driven by the rising prevalence of chronic diseases, increasing demand for stable and long-acting formulations, and the expansion of biologics and biosimilars production across the region
- In addition, advancements in freeze-drying technologies, rising investments by pharmaceutical companies, and growing healthcare infrastructure in emerging economies such as China, India, and Japan are fueling adoption. These factors collectively accelerate the uptake of lyophilized injectable drugs, significantly propelling market expansion throughout the Asia-Pacific region
Asia-Pacific Lyophilized Injectable Drugs Market Analysis
- Lyophilized injectable drugs, which undergo freeze-drying to enhance stability and extend shelf life, are increasingly vital in pharmaceutical formulations across therapeutic areas such as oncology, infectious diseases, and autoimmune disorders due to their improved storage, transport, and reconstitution characteristics
- The growing demand for lyophilized injectable drugs in Asia-Pacific is primarily driven by the rising prevalence of chronic and infectious diseases, expanding biopharmaceutical manufacturing, and increasing adoption of contract lyophilization services by pharmaceutical and biotechnology companies
- China dominated the Asia-Pacific lyophilized injectable drugs market with a revenue share of 38.5% in 2024, supported by strong government initiatives in pharmaceutical R&D, expanding biologics production, and the presence of major domestic drug manufacturers investing in advanced freeze-drying technologies
- India is expected to be the fastest-growing market in the region during the forecast period, driven by increasing healthcare expenditure, a rapidly expanding pharmaceutical manufacturing base, supportive regulatory reforms, and rising demand for cost-effective, stable injectable formulations across hospitals and clinics
- The vials segment dominated the Asia-Pacific lyophilized injectable drugs market with a market share of 46.7% in 2024, attributed to its cost-effectiveness, ease of storage, and compatibility with diverse therapeutic formulations, making it the preferred packaging format among regional drug manufacturers
Report Scope and Asia-Pacific Lyophilized Injectable Drugs Market Segmentation
|
Attributes |
Asia-Pacific Lyophilized Injectable Drugs Key Market Insights |
|
Segments Covered |
|
|
Countries Covered |
Asia-Pacific
|
|
Key Market Players |
|
|
Market Opportunities |
|
|
Value Added Data Infosets |
In addition to the insights on market scenarios such as market value, growth rate, segmentation, geographical coverage, and major players, the market reports curated by the Data Bridge Market Research also include in-depth expert analysis, patient epidemiology, pipeline analysis, pricing analysis, and regulatory framework |
Asia-Pacific Lyophilized Injectable Drugs Market Trends
Rising Adoption of Advanced Lyophilization Technologies and Contract Manufacturing
- A significant and accelerating trend in the Asia-Pacific lyophilized injectable drugs market is the growing adoption of advanced lyophilization technologies and the expansion of contract manufacturing organizations (CMOs) offering specialized freeze-drying services to pharmaceutical and biotechnology companies
- For instance, in March 2024, Recipharm expanded its sterile fill-finish and lyophilization capacity in India to meet the growing regional demand for biologics and injectable formulations, strengthening its footprint in Asia-Pacific
- The integration of process analytical technology (PAT) and automation in lyophilization enhances cycle efficiency, ensures product consistency, and minimizes human intervention, leading to better control over product quality and reduced manufacturing costs. For instance, companies such as Tofflon and IMA Life are developing automated lyophilization systems that improve process scalability and operational reliability
- Furthermore, the rising trend of outsourcing lyophilization services to CMOs with advanced facilities is enabling small and mid-sized pharmaceutical firms to bring products to market faster without large capital investment in infrastructure
- The increasing collaboration between regional CMOs and multinational pharmaceutical players supports technology transfer, regulatory compliance, and large-scale production of biologics and injectables, strengthening Asia-Pacific’s role as a global manufacturing hub
- This trend toward modernization, outsourcing, and technological integration is transforming the regional market landscape, driving greater efficiency, capacity expansion, and innovation in lyophilized injectable drug production
Asia-Pacific Lyophilized Injectable Drugs Market Dynamics
Driver
Growing Demand for Biologics and Expansion of Pharmaceutical Manufacturing Capacity
- The rapid growth of biologics and biosimilars production, coupled with the expansion of pharmaceutical manufacturing facilities across the region, is a major driver fueling the demand for lyophilized injectable drugs in Asia-Pacific
- For instance, in February 2024, WuXi Biologics announced the addition of new lyophilization lines in China to support large-scale biologics production, addressing the increasing need for stable formulations. Such investments are expected to propel the market growth during the forecast period
- As chronic diseases and cancer cases rise, lyophilized drugs offer advantages such as extended shelf life, enhanced stability, and ease of transportation, making them essential for healthcare systems in emerging economies
- Furthermore, the region’s growing pharmaceutical export base and supportive government initiatives for domestic drug manufacturing are contributing significantly to the increasing demand for lyophilization capabilities
- The development of new production plants, greater adoption of freeze-drying in biologics formulation, and rising collaborations between domestic and global pharmaceutical firms are accelerating industry expansion across key countries including China, India, and Japan
- The strong pipeline of biopharmaceuticals and the rising preference for high-quality, long-lasting injectable formulations are key factors propelling the growth of lyophilized injectable drugs in the Asia-Pacific market
Restraint/Challenge
High Equipment Costs and Regulatory Compliance Complexity
- The high capital investment required for lyophilization equipment and facilities remains a significant challenge for small and mid-sized pharmaceutical companies across the Asia-Pacific region
- For instance, the installation and validation of advanced freeze-drying systems with automation and monitoring technologies substantially increase overall production costs, limiting access for emerging manufacturers
- In addition, complex regulatory requirements for aseptic processing, sterility assurance, and validation of lyophilization cycles create operational hurdles, especially for companies expanding into international markets. For instance, inconsistent regulatory standards across countries such as India, China, and Japan can delay product approvals and increase compliance burdens
- The lack of standardized training programs and skilled personnel for operating and maintaining sophisticated lyophilization systems further constrains efficiency and output consistency
- Moreover, frequent audits, documentation demands, and the need for continuous equipment upgrades to meet evolving global quality norms add to operational complexity and cost
- Overcoming these challenges through regulatory harmonization, workforce training, and investment in cost-efficient lyophilization solutions will be crucial for achieving sustained market growth in the Asia-Pacific region
Asia-Pacific Lyophilized Injectable Drugs Market Scope
The market is segmented on the basis of packaging, drug class, form, indication, route of administration, end user, and distribution channel.
- By Packaging
On the basis of packaging, the Asia-Pacific lyophilized injectable drugs market is segmented into vials, dual-chamber syringes, dual-chamber cartridges, and others. The vials segment dominated the market with the largest revenue share of 46.7% in 2024, driven by its widespread use in hospitals, laboratories, and pharmaceutical manufacturing due to strong barrier protection and ease of sterilization. Vials remain the preferred packaging option for bulk drug formulations and biologics because they maintain stability and allow extended shelf life under variable storage conditions. Their compatibility with multiple drug classes, cost-effectiveness, and reusability further strengthen their market position. Moreover, glass vials are considered the gold standard in aseptic packaging due to their chemical inertness and moisture resistance, ensuring product integrity. The increasing demand for injectable antibiotics and vaccines across the region also contributes to their continued dominance.
The dual-chamber syringes segment is projected to witness the fastest growth rate during the forecast period, supported by the rising trend toward ready-to-use and easy-to-reconstitute formulations. These syringes enhance patient convenience by separating the diluent and drug until the time of administration, minimizing contamination risks. The shift toward self-administration and point-of-care treatment is increasing the appeal of dual-chamber systems among healthcare providers. Furthermore, growing adoption in hospitals and homecare settings, coupled with advancements in syringe design for biologics, is fueling segment expansion. Manufacturers are also focusing on ergonomic and safety-enhanced syringe designs to meet patient and regulatory demands across the Asia-Pacific region.
- By Drug Class
On the basis of drug class, the market is categorized into anti-infectives, antineoplastic, diuretics, proton pump inhibitors, anesthetic, anticoagulant, NSAIDs, corticosteroids, and others. The antineoplastic segment dominated the Asia-Pacific market in 2024, driven by the increasing cancer prevalence and the growing number of oncology drug approvals. Lyophilization provides long-term stability and potency to heat- and moisture-sensitive antineoplastic formulations, ensuring effective delivery in clinical settings. The surge in biologic-based cancer therapies such as monoclonal antibodies and targeted drugs also promotes segment growth. Furthermore, the expansion of oncology treatment centers and government investments in cancer care infrastructure strengthen demand. Countries such as China and Japan are heavily investing in lyophilized oncology products to improve drug access and shelf life. This dominance is reinforced by ongoing R&D in personalized and combination cancer therapies requiring lyophilized stability solutions.
The anti-infectives segment is anticipated to register the fastest growth during the forecast period, fueled by the high burden of bacterial and viral infections across developing economies. Lyophilized anti-infective drugs are preferred in regions with limited cold-chain infrastructure, as they offer prolonged shelf life and better transportation stability. The COVID-19 pandemic further accelerated the production of lyophilized antivirals and antibiotics, creating lasting demand. For instance, local manufacturers in India and Southeast Asia are expanding lyophilization lines for large-scale antibiotic production. Increasing government efforts to strengthen infectious disease control programs will continue to support segment growth. In addition, the growing need for rapid-response injectable therapies in hospital settings drives adoption.
- By Form
On the basis of form, the market is divided into powder and liquid. The powder segment dominated the market in 2024, attributed to its superior stability, long shelf life, and suitability for complex biologics and peptide formulations. Lyophilized powder forms are highly preferred for vaccines, oncology drugs, and antibiotics that require preservation at varying temperatures. The reduced dependency on cold-chain logistics lowers transportation costs, making them ideal for emerging markets. Manufacturers also benefit from easier reconstitution and dose flexibility in powder-based formulations. Moreover, the ability to maintain drug potency over extended periods enhances their demand across healthcare institutions. The segment’s dominance is expected to persist with growing biologics production and adoption of personalized injectables.
The liquid segment is expected to grow at the fastest rate during the forecast period, driven by increasing preference for ready-to-use (RTU) and pre-filled formulations. Hospitals and clinics increasingly favor liquid lyophilized injectables for their ease of administration and reduced preparation time. The segment’s growth is also linked to technological advancements in maintaining liquid stability through optimized formulation techniques. Furthermore, the expanding use of liquid formulations in emergency care and infusion therapies supports market expansion. The rise of self-administration trends in home healthcare settings further strengthens demand for these user-friendly solutions.
- By Indication
On the basis of indication, the market is segmented into oncology, autoimmune diseases, hormonal disorders, respiratory diseases, gastrointestinal disorders, dermatological disorders, ophthalmic diseases, and others. The oncology segment dominated the Asia-Pacific market with the largest revenue share in 2024, owing to the increasing prevalence of cancer and the extensive use of lyophilized formulations in chemotherapy and targeted therapies. Lyophilization ensures the chemical stability of sensitive oncology drugs and prevents degradation during long storage or transport. The expansion of regional cancer treatment centers and oncology drug manufacturing capacity, particularly in China and Japan, further boosts demand. Growing investments by multinational companies in cancer biologics production across Asia-Pacific are strengthening this segment. Moreover, the availability of government funding for cancer drug development supports continuous growth. The segment benefits from the increasing pipeline of injectable oncology drugs requiring advanced stabilization.
The autoimmune diseases segment is anticipated to grow at the fastest CAGR during the forecast period, supported by the rising prevalence of conditions such as rheumatoid arthritis, lupus, and psoriasis. Lyophilized biologics and monoclonal antibodies are increasingly used for long-term autoimmune therapy due to their stability and reduced degradation. Expanding diagnostic capabilities and awareness of autoimmune disorders are driving higher treatment rates in the region. Furthermore, pharmaceutical firms are focusing on producing freeze-dried biologics suitable for home injection systems. Government healthcare reforms improving patient access to chronic disease therapies also aid this growth. The adoption of convenient packaging formats for autoimmune injectables supports wider clinical and patient use.
- By Route of Administration
On the basis of route of administration, the market is classified into intravenous/infusion, intramuscular, and others. The intravenous/infusion segment dominated the market in 2024, driven by its high use in hospitals for critical and emergency care. IV administration ensures rapid therapeutic response and precise dosage delivery for complex drugs such as biologics and chemotherapy agents. The segment’s strength lies in its integration with hospital-based infusion systems and suitability for large-volume reconstituted drugs. Increasing adoption of lyophilized injectables for oncology, anti-infective, and intensive care treatments enhances demand. Moreover, the preference for sterile IV formulations due to safety and efficacy standards supports its dominance. The presence of advanced hospital infrastructure in countries such as Japan and South Korea further consolidates its leadership.
The intramuscular segment is projected to grow at the fastest pace during the forecast period, fueled by the increasing demand for self-administered and long-acting formulations. IM delivery allows gradual drug absorption, making it suitable for chronic and preventive treatments. Rising interest in home-based healthcare solutions and simplified administration procedures drives adoption across urban Asia-Pacific. Lyophilized IM formulations are particularly beneficial for vaccines and hormonal therapies requiring stability and controlled release. Furthermore, innovations in pre-filled and dual-chamber devices are making intramuscular injections safer and more convenient. Growing healthcare accessibility in rural regions is expected to further stimulate this segment’s growth.
- By End User
On the basis of end user, the market is segmented by end user into hospitals, clinics, home healthcare, and others. The hospital segment dominated the market in 2024, accounting for the majority share due to high patient volumes and advanced infrastructure for drug reconstitution and administration. Hospitals remain the primary sites for oncology, infectious disease, and critical care treatments that rely heavily on lyophilized injectables. The availability of skilled healthcare professionals and aseptic environments enhances product handling efficiency. Increasing government investments in public hospitals across China, India, and Southeast Asia support demand. Moreover, hospital-based procurement systems enable bulk purchasing of lyophilized drugs through tenders, further strengthening this segment. The rising prevalence of chronic and acute diseases continues to make hospitals the dominant end-user category.
The home healthcare segment is expected to record the fastest growth during the forecast period, driven by rising preference for home-based treatments and self-administration trends. Advances in reconstitution technology and user-friendly packaging are enabling patients to prepare and inject drugs safely at home. This shift reduces hospital visits and lowers healthcare costs for chronic disease management. Furthermore, the expansion of telemedicine and home nursing services across urban centers supports this trend. Manufacturers are increasingly developing pre-filled and RTU lyophilized injectables for convenient home use. Growing awareness and accessibility of biologic therapies will further drive segment expansion across the region.
- By Distribution Channel
On the basis of distribution channel, the market is divided into direct tender, retail sales, and others. The direct tender segment dominated the market in 2024, supported by large-scale procurement by government hospitals and public health agencies. Bulk purchasing through tenders ensures cost efficiency and consistent supply of essential lyophilized drugs for oncology, infection control, and immunization programs. This channel benefits from structured distribution networks and preferential pricing agreements with major pharmaceutical suppliers. The dominance of direct tender distribution is particularly evident in China and India, where public sector hospitals account for the majority of injectable drug usage. In addition, regulatory bodies encourage centralized tendering to maintain quality and pricing transparency. Increasing production capacity among local manufacturers further reinforces this segment’s leadership.
The retail sales segment is expected to witness the fastest growth during the forecast period, driven by the rapid expansion of retail pharmacy chains and online medicine platforms across the Asia-Pacific region. Growing patient preference for convenience and easy access to lyophilized formulations is reshaping the distribution landscape. Retail channels increasingly offer both branded and generic lyophilized drugs for chronic conditions and self-care use. Moreover, e-commerce penetration and digital prescription services in urban areas are making retail purchases more streamlined. The shift toward private healthcare consumption and direct-to-patient delivery models also supports growth. Pharmaceutical companies are partnering with retail networks to expand product reach and availability in developing markets.
Asia-Pacific Lyophilized Injectable Drugs Market Regional Analysis
- China dominated the Asia-Pacific lyophilized injectable drugs market with a revenue share of 38.5% in 2024, supported by strong government initiatives in pharmaceutical R&D, expanding biologics production, and the presence of major domestic drug manufacturers investing in advanced freeze-drying technologies
- China’s large patient population, coupled with the surge in chronic disease prevalence, continues to fuel the need for effective and long-lasting injectable therapies
- Furthermore, the presence of leading domestic and multinational pharmaceutical companies, alongside growing contract manufacturing organizations (CMOs), reinforces China’s pivotal role in regional supply and export capacity
The China Lyophilized Injectable Drugs Market Insight
China dominated the Asia-Pacific lyophilized injectable drugs market with the largest revenue share in 2024, attributed to its strong pharmaceutical manufacturing capacity, vast patient population, and government-driven healthcare reforms. The country’s increasing investments in biologics, vaccines, and oncology injectables have solidified its position as the regional leader. Furthermore, the expansion of contract manufacturing organizations (CMOs) and the adoption of cutting-edge freeze-drying technologies are enabling Chinese manufacturers to enhance drug stability and extend shelf life. China’s focus on self-reliance in drug production and export potential continues to reinforce its market dominance.
India Lyophilized Injectable Drugs Market Insight
India is projected to be the fastest-growing market in the Asia-Pacific lyophilized injectable drugs industry, driven by its rapidly expanding pharmaceutical manufacturing base and strong export-oriented production. The country’s increasing investments in sterile injectable facilities and the government’s “Make in India” initiative are accelerating market expansion. Rising demand for affordable biologics, coupled with growing domestic consumption of injectable formulations for chronic diseases, further fuels growth. Moreover, the presence of leading pharmaceutical firms, advancements in lyophilization equipment, and favorable regulatory frameworks are strengthening India’s position in the regional landscape.
Japan Lyophilized Injectable Drugs Market Insight
The Japan lyophilized injectable drugs market is witnessing steady growth, supported by a mature healthcare system, growing elderly population, and high adoption of biologics for chronic and degenerative diseases. Japanese pharmaceutical companies are increasingly focusing on lyophilized formulations to ensure long-term drug stability and efficacy. Innovation in freeze-drying technologies and government support for biopharmaceutical R&D are propelling market development. In addition, Japan’s stringent quality standards and preference for precision-driven manufacturing make it a key hub for premium injectable drug production within Asia-Pacific.
South Korea Lyophilized Injectable Drugs Market Insight
The South Korea lyophilized injectable drugs market is expanding rapidly, fueled by rising investments in biotechnology, biosimilars, and vaccine production. The country’s advanced R&D infrastructure, government incentives for pharmaceutical innovation, and growing partnerships with multinational biopharma firms are accelerating lyophilization adoption. South Korean companies are leveraging automation and digitalization in lyophilization processes to enhance quality and efficiency. Furthermore, the increasing prevalence of cancer and autoimmune disorders is boosting demand for high-stability injectable drugs, positioning South Korea as a key emerging player in the Asia-Pacific market.
Asia-Pacific Lyophilized Injectable Drugs Market Share
The Asia-Pacific Lyophilized Injectable Drugs industry is primarily led by well-established companies, including:
- Pfizer Inc. (U.S.)
- Merck & Co., Inc., (U.S.)
- F. Hoffmann-La Roche Ltd (Switzerland)
- GSK plc. (U.K.)
- AstraZeneca (U.K.)
- Johnson & Johnson Services, Inc. (U.S.)
- Takeda Pharmaceutical Company Limited (Japan)
- Baxter (U.S.)
- Sanofi (France)
- Novartis AG (Switzerland)
- Boehringer Ingelheim International GmbH (Germany)
- Fresenius Kabi AG (Germany)
- Dr. Reddy’s Laboratories Ltd. (India)
- Sun Pharmaceutical Industries Ltd. (India)
- Piramal Enterprises Limited (India)
- Biocon Ltd. (India)
- WuXi Biologics Co., Ltd. (China)
- CSL Limited (Australia)
- Lonza (Switzerland)
- Samsung Biologics (Republic of Korea)
What are the Recent Developments in Asia-Pacific Lyophilized Injectable Drugs Market?
- In November 2024, the WHO published evaluation documents (EUL/assessment materials) for KM Biologics’ LC16m8 smallpox/mpox vaccine. The WHO assessment noted programmatic characteristics and operational handling for the lyophilized presentation an instance of recent APAC-manufactured lyophilized vaccine products undergoing global emergency-use/quality review
- In November 2022, WuXi STA brought an additional parenteral formulation/filling line into operation at its Wuxi site (a second high-flexibility line with a built-in lyophilizer and automatic vial handling), further increasing its ability to manufacture lyophilized injectable products at commercial scale and reducing lead times for clients seeking lyophilized powder vials in the Asia-Pacific region
- In September 2023, Henlius (Fosun Pharma group) reported that its manufacturing footprint now included a dedicated lyophilized preparation line (alongside liquid fill lines), calling out lyophilized production capability in its interim / facility reporting an instance of APAC biopharma firms investing in onshore lyophilization capacity to support biologics and biosimilars.
- In May 2023, a Chinese developer/manufacturer announced NMPA approval of a lyophilized powder injection formulation (a domestically developed monoclonal antibody submitted as lyophilized vials), marking another case of China approving locally produced lyophilized biologic injectables and expanding domestic supply of lyophilized therapeutic products
- In January 2022, WuXi STA commissioned its first parenteral formulation manufacturing line at its Wuxi, China site a fully automated sterile filling line built with an integrated lyophilizer capable of producing lyophilized powders (vials, syringes, cartridges) and rapidly switching between filling modes to support large-volume lyophilized injectable production. This expanded local CMC and fill/finish capacity for biologics and helped global customers accelerate lyophilized drug-product supply from China
SKU-

- Interactive Data Analysis Dashboard
- Company Analysis Dashboard for high growth potential opportunities
- Research Analyst Access for customization & queries
- Competitor Analysis with Interactive dashboard
- Latest News, Updates & Trend analysis
- Harness the Power of Benchmark Analysis for Comprehensive Competitor Tracking
Data collection and base year analysis are done using data collection modules with large sample sizes. The stage includes obtaining market information or related data through various sources and strategies. It includes examining and planning all the data acquired from the past in advance. It likewise envelops the examination of information inconsistencies seen across different information sources. The market data is analysed and estimated using market statistical and coherent models. Also, market share analysis and key trend analysis are the major success factors in the market report. To know more, please request an analyst call or drop down your inquiry.
The key research methodology used by DBMR research team is data triangulation which involves data mining, analysis of the impact of data variables on the market and primary (industry expert) validation. Data models include Vendor Positioning Grid, Market Time Line Analysis, Market Overview and Guide, Company Positioning Grid, Patent Analysis, Pricing Analysis, Company Market Share Analysis, Standards of Measurement, Global versus Regional and Vendor Share Analysis. To know more about the research methodology, drop in an inquiry to speak to our industry experts.
Data Bridge Market Research is a leader in advanced formative research. We take pride in servicing our existing and new customers with data and analysis that match and suits their goal. The report can be customized to include price trend analysis of target brands understanding the market for additional countries (ask for the list of countries), clinical trial results data, literature review, refurbished market and product base analysis. Market analysis of target competitors can be analyzed from technology-based analysis to market portfolio strategies. We can add as many competitors that you require data about in the format and data style you are looking for. Our team of analysts can also provide you data in crude raw excel files pivot tables (Fact book) or can assist you in creating presentations from the data sets available in the report.


