
Asia Pacific Mass Spectrometry Market
Market Size in USD Billion
 USD
1.39 Billion
USD
2.87 Billion
2024
2032
USD
1.39 Billion
USD
2.87 Billion
2024
2032
| 2025 - 2032 | |
| USD 1.39 Billion | |
| USD 2.87 Billion | |
| % | |
|
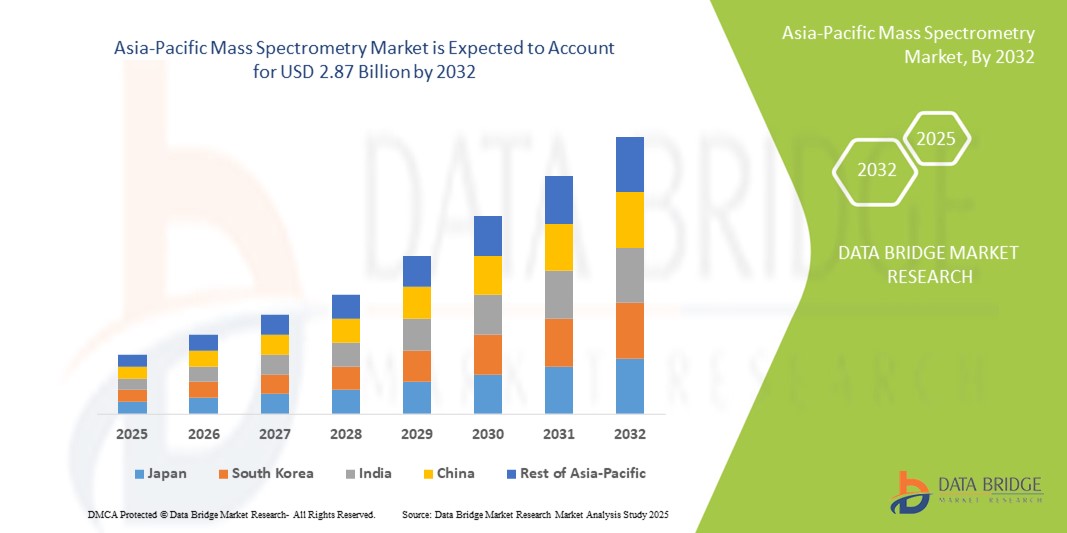
Asia-Pacific Mass Spectrometry Market Size
- The Asia-Pacific mass spectrometry market size was valued at USD 1.39 billion in 2024 and is expected to reach USD 2.87 billion by 2032, at a CAGR of 9.50% during the forecast period
- The market growth is largely fueled by rising investments in pharmaceutical research, growing environmental testing initiatives, and expanding food safety regulations across key economies such as China, Japan, India, and South Korea
- Furthermore, increasing adoption of advanced diagnostic tools, academic research funding, and demand for precise analytical technologies in clinical and life sciences sectors are driving the adoption of mass spectrometry solutions. These converging factors are accelerating the regional market expansion, thereby significantly boosting the industry’s growth
Asia-Pacific Mass Spectrometry Market Analysis
- Mass spectrometers, which enable precise molecular analysis and identification, are becoming increasingly vital in sectors such as pharmaceuticals, biotechnology, food safety, and environmental monitoring across Asia-Pacific, driven by their accuracy, sensitivity, and expanding application scope
- The rising demand for mass spectrometry solutions is primarily fueled by growing government and private sector investments in life sciences research, tightening regulatory standards for food and environmental safety, and the expansion of clinical diagnostic infrastructure
- China dominated the Asia-Pacific mass spectrometry market with the largest revenue share of 37.3% in 2024, characterized by aggressive R&D funding, rapid growth in pharmaceutical manufacturing, and increasing adoption in academic and research institutions, with the country witnessing significant expansion in advanced analytical laboratories
- India is expected to be the fastest growing country in the Asia-Pacific mass spectrometry market during the forecast period due to expanding healthcare infrastructure and increased focus on food quality testing.
- Hybrid Mass Spectrometry segment dominated the Asia-Pacific mass spectrometry market with a market share of 56.7% in 2024, driven by its superior analytical precision, ability to detect complex molecules, and broad application across pharmaceutical and clinical research
Report Scope and Asia-Pacific Mass Spectrometry Market Segmentation
|
Attributes |
Asia-Pacific Mass Spectrometry Key Market Insights |
|
Segments Covered |
|
|
Countries Covered |
Asia-Pacific
|
|
Key Market Players |
|
|
Market Opportunities |
|
|
Value Added Data Infosets |
In addition to the insights on market scenarios such as market value, growth rate, segmentation, geographical coverage, and major players, the market reports curated by the Data Bridge Market Research also include in-depth expert analysis, pricing analysis, brand share analysis, consumer survey, demography analysis, supply chain analysis, value chain analysis, raw material/consumables overview, vendor selection criteria, PESTLE Analysis, Porter Analysis, and regulatory framework. |
Asia-Pacific Mass Spectrometry Market Trends
“Increased Integration with Automation and AI-Powered Analytical Platforms”
- A significant and accelerating trend in the Asia-Pacific mass spectrometry market is the growing integration of AI and automation in analytical workflows, enabling faster, more accurate, and data-rich insights across applications such as clinical diagnostics, pharmaceutical R&D, and environmental testing
- For instance, Agilent Technologies and Shimadzu have introduced mass spectrometry systems with automated sample preparation and AI-enhanced software that reduces human error, boosts throughput, and optimizes system performance through predictive maintenance algorithms
- AI integration enhances data analysis by identifying complex patterns, automating peak detection, and providing predictive insights for early disease diagnosis and compound identification. In clinical labs, for instance, AI-supported LC-MS systems now assist in high-throughput COVID-19 and metabolic disorder testing, streamlining both speed and accuracy
- The seamless combination of mass spectrometers with lab automation tools such as robotic arms, digital sample trackers, and cloud-based analysis platforms allows centralized control over laboratory operations. This improves data reproducibility and reduces turnaround time, particularly in high-volume labs and research centers
- This trend toward more intelligent, automated, and connected analytical systems is redefining laboratory capabilities and productivity standards across Asia-Pacific. As a result, companies such as SCIEX and Thermo Fisher are investing heavily in smart system innovation for Asian markets
- The growing demand for efficient, AI-enhanced, and integrated mass spectrometry platforms is transforming laboratory operations across pharmaceutical, academic, and environmental sectors, where speed, accuracy, and scalability are becoming essential requirements
Asia-Pacific Mass Spectrometry Market Dynamics
Driver
“Rising Pharmaceutical R&D and Regulatory Compliance in Healthcare and Food Safety”
- The robust growth in pharmaceutical R&D, coupled with increasingly stringent regulatory standards for healthcare and food safety across Asia-Pacific countries, is a key driver propelling the adoption of advanced mass spectrometry technologies
- For instance, in February 2024, Shimadzu Corporation launched a new triple quadrupole LC-MS system in Japan designed specifically for trace-level drug analysis and food contaminant detection, reflecting a broader regional push toward higher analytical sensitivity and compliance readiness
- As pharmaceutical manufacturers and research organizations seek to meet rigorous quality standards and accelerate drug discovery pipelines, mass spectrometry offers unmatched precision in compound identification, impurity profiling, and pharmacokinetics analysis
- Furthermore, rising public health awareness and demand for safe food and water have prompted regional governments to enforce stricter residue and contaminant testing protocols, thereby increasing mass spectrometry installations in regulatory and environmental labs
- The demand is also fueled by academic research growth, particularly in genomics, proteomics, and metabolomics, where mass spectrometry is central to accurate molecular profiling and biomarker discovery. Supportive government funding and collaborations are amplifying this trend across India, China, and Asian countries
Restraint/Challenge
“High Equipment Cost and Technical Skill Gaps”
- The relatively high capital investment required for advanced mass spectrometry systems, combined with the need for technically skilled personnel to operate and interpret complex data outputs, poses a significant barrier to wider market penetration, particularly in emerging Asia-Pacific economies
- For instance, high-end LC-MS/MS or Orbitrap systems can cost hundreds of thousands of dollars, making them less accessible to smaller institutions or diagnostic labs operating under budget constraints
- In addition, the lack of adequately trained specialists in handling mass spectrometry instrumentation, performing data analysis, and maintaining equipment hinders adoption, particularly in rural or decentralized healthcare and testing environments
- While manufacturers are introducing user-friendly software and training programs to address this challenge, the gap in technical capacity still limits growth in developing regions
- Overcoming these barriers will require targeted government support, academic-industry partnerships, and investment in local talent development to build a skilled workforce capable of operating and maintaining sophisticated mass spectrometry systems across the region
Asia-Pacific Mass Spectrometry Market Scope
The market is segmented on the basis of technology, modality, application, end user, and distribution channel.
- By Technology
On the basis of technology, the Asia-Pacific mass spectrometry market is segmented into hybrid mass spectrometry, single mass spectrometry, and others. The hybrid mass spectrometry segment dominated the market with the largest revenue share of 56.7% in 2024, driven by its superior analytical accuracy, sensitivity, and versatility across applications such as pharmaceutical R&D, environmental testing, and proteomics. These systems, which combine technologies such as LC-MS/MS and GC-MS, are widely preferred in high-throughput labs for their enhanced performance and multi-dimensional analysis capabilities.
The single mass spectrometry segment is expected to witness the fastest growth rate of 19.6% from 2025 to 2032, fueled by rising demand in mid-scale labs and diagnostic centers seeking cost-effective, easy-to-operate instruments. Its compact design, affordability, and suitability for basic molecular analysis are making it increasingly attractive for emerging market applications.
- By Modality
On the basis of modality, the Asia-Pacific mass spectrometry market is segmented into benchtop and standalone. The benchtop segment held the largest market revenue share of 71.4% in 2024, attributed to its higher adoption in clinical diagnostics and research labs due to ease of use, compact design, and compatibility with automated laboratory workflows. These systems are ideal for centralized testing environments in pharmaceutical and academic sectors.
The standalone segment is expected to witness the fastest CAGR from 2025 to 2032, especially in mobile labs and decentralized testing units that require portable and flexible instrumentation for field-based or on-site analysis.
- By Application
On the basis of application, the Asia-Pacific mass spectrometry market is segmented into life science research, drug discovery, environmental testing, food testing, applied industries, clinical diagnostics, and others. The life science research segment dominated the market with the highest revenue share of 29.7% in 2024, driven by growing investments in genomics, proteomics, and metabolomics across Asia-Pacific. Mass spectrometry is widely used in biomarker discovery, protein analysis, and molecular imaging in both public and private research institutions.
The clinical diagnostics segment is expected to witness the fastest CAGR from 2025 to 2032, propelled by increasing adoption of LC-MS systems for disease biomarker detection, therapeutic drug monitoring, and infectious disease diagnosis in advanced healthcare settings.
- By End User
On the basis of end user, the Asia-Pacific mass spectrometry market is segmented into pharmaceutical industry, research and academic institutes, food & beverage industry, petrochemical industry, and others. The pharmaceutical industry segment held the largest share of 34.1% in 2024, as mass spectrometry plays a crucial role in drug formulation, pharmacokinetics, impurity profiling, and regulatory compliance. Growing pharmaceutical manufacturing activity in countries such as China and India is a key growth factor.
The research and academic institutes segment is expected to witness the fastest CAGR from 2025 to 2032, supported by government-funded R&D programs and increased demand for cutting-edge analytical tools in university and institutional laboratories.
- By Distribution Channel
On the basis of distribution channel, the Asia-Pacific mass spectrometry market is segmented into direct tenders, retail sales, and others. The direct tenders segment dominated the market with a share of 61.3% in 2024, as bulk procurement by large laboratories, hospitals, and government bodies is commonly done through direct vendor agreements to ensure service quality and technical support.
The retail sales segment is expected to witness the fastest CAGR from 2025 to 2032 due to the rise of e-commerce platforms and increasing availability of modular or benchtop mass spectrometers that suit budget-constrained buyers
Asia-Pacific Mass Spectrometry Market Regional Analysis
- China dominated the Asia-Pacific mass spectrometry market with the largest revenue share of 37.3% in 2024, characterized by aggressive R&D funding, rapid growth in pharmaceutical manufacturing, and increasing adoption in academic and research institutions, with the country witnessing significant expansion in advanced analytical laboratories
- The country’s rapid advancements in healthcare, coupled with strong government initiatives in scientific research and innovation, have led to widespread adoption of advanced analytical instruments such as mass spectrometers across academic, clinical, and industrial sectors
- This high adoption rate is further supported by the presence of local manufacturing hubs, strategic collaborations with global market leaders, and increasing demand for precision diagnostics and food safety testing, making China a central growth engine in the regional mass spectrometry landscape
China Mass Spectrometry Market Insight
The China mass spectrometry market captured the largest revenue share of 37.3% in 2024 within Asia-Pacific, driven by rising pharmaceutical production, strong government support for R&D, and increased focus on food and environmental safety. The country is rapidly expanding its analytical testing infrastructure across clinical diagnostics, academic research, and regulatory sectors. With a growing emphasis on innovation and local manufacturing capabilities, China is becoming a key market for advanced mass spectrometry systems, including hybrid and high-resolution platforms.
India Mass Spectrometry Market Insight
The India mass spectrometry market is poised to grow at the fastest CAGR in the region during the forecast period, propelled by expanding pharmaceutical and biotechnology sectors, government-led research initiatives, and increasing demand for food safety testing. The rise of public-private partnerships in life science research and the growth of academic institutions are fostering widespread adoption. Moreover, affordable and modular MS systems are gaining traction among mid-sized labs and diagnostic centers across urban and semi-urban areas.
Japan Mass Spectrometry Market Insight
The Japan mass spectrometry market is experiencing steady growth, fueled by the country’s focus on precision diagnostics, biomedical innovation, and high standards in food and environmental testing. As a technologically advanced nation with an established healthcare system, Japan sees significant demand for high-end hybrid MS instruments in clinical and pharmaceutical applications. In addition, the integration of automation and AI with mass spectrometry platforms is gaining momentum in Japanese research facilities, contributing to market expansion.
South Korea Mass Spectrometry Market Insight
The South Korea mass spectrometry market is expanding due to robust investments in life sciences, pharmaceutical innovation, and increasing regulatory emphasis on quality and safety. Strong academic-industry collaborations and the presence of tech-savvy laboratories are encouraging the uptake of next-generation MS systems. South Korea's commitment to healthcare advancement and environmental monitoring is also playing a vital role in the market's positive trajectory
Asia-Pacific Mass Spectrometry Market Share
The Asia-Pacific Mass Spectrometry industry is primarily led by well-established companies, including:
- Shimadzu Corporation (Japan)
- Thermo Fisher Scientific Inc. (U.S.)
- Agilent Technologies, Inc. (U.S.)
- Bruker Corporation (U.S.)
- Waters Corporation (U.S.)
- SCIEX (Canada)
- PerkinElmer (U.S.)
- JEOL Ltd. (Japan)
- LECO Corporation (U.S.)
- Danaher Corporation (U.S.)
- Hitachi High-Tech Corporation (Japan)
- MKS Instruments, Inc. (U.S.)
- HORIBA, Ltd. (Japan)
- Analytik Jena GmbH (Germany)
- Kore Technology Ltd. (U.K.)
- FLIR Systems, Inc. (U.S.)
- Advion, Inc. (U.S.)
- Bio-Rad Laboratories, Inc. (U.S.)
- Trajan Scientific and Medical (Australia)
- IonBench (France)
What are the Recent Developments in Asia-Pacific Mass Spectrometry Market?
- In April 2023, Shimadzu Corporation launched its LCMS-8060NX Triple Quadrupole LC-MS system in Japan, designed to deliver ultra-fast, high-sensitivity detection for applications in food safety, environmental analysis, and clinical research. This launch reflects Shimadzu’s ongoing commitment to advancing high-performance analytical solutions tailored to regional needs. The system’s enhanced ion source and AI-supported features enable improved data accuracy and operational efficiency, supporting laboratories across Asia-Pacific in meeting stringent regulatory standards and research demands
- In March 2023, Agilent Technologies Inc. inaugurated a state-of-the-art Customer Experience Center in Singapore focused on life sciences and chemical analysis. The facility showcases Agilent’s latest mass spectrometry innovations and offers training, support, and collaborative opportunities for researchers and scientists. This initiative reinforces Agilent's strategic presence in Southeast Asia and its dedication to empowering local institutions with advanced tools for pharmaceutical, food safety, and environmental testing
- In March 2023, SCIEX, a global leader in mass spectrometry, expanded its presence in China by establishing a new application laboratory in Shanghai. The lab provides end-to-end support, including demonstrations, method development, and technical training for SCIEX mass spectrometry users in the region. This development highlights the company’s effort to strengthen localized services and enhance adoption of high-resolution mass spectrometry across pharmaceutical, academic, and regulatory sectors in China
- In February 2023, Thermo Fisher Scientific Inc. collaborated with the National University of Singapore (NUS) to implement advanced Orbitrap mass spectrometers for metabolomics and precision medicine research. This partnership is part of a broader initiative to accelerate biomedical innovation and clinical diagnostics in Asia. The integration of cutting-edge MS systems in academic settings exemplifies Thermo Fisher’s investment in expanding its research ecosystem within the region
- In January 2023, Waters Corporation introduced the Xevo TQ Absolute mass spectrometer in the Asia-Pacific market through regional showcases and workshops across India and South Korea. With its enhanced sensitivity and reduced size, the instrument is tailored for pharmaceutical labs and contract research organizations focused on bioanalysis and regulated testing. Waters’ regional marketing efforts demonstrate its focus on improving accessibility and operational scalability of high-end analytical tools for growing markets
SKU-

- Interactive Data Analysis Dashboard
- Company Analysis Dashboard for high growth potential opportunities
- Research Analyst Access for customization & queries
- Competitor Analysis with Interactive dashboard
- Latest News, Updates & Trend analysis
- Harness the Power of Benchmark Analysis for Comprehensive Competitor Tracking
Table of Content
1 INTRODUCTION
1.1 OBJECTIVES OF THE STUDY
1.2 MARKET DEFINITION
1.3 OVERVIEW OF ASIA-PACIFIC MASS SPECTROMETRY MARKET
1.4 MARKETS COVERED
2 MARKET SEGMENTATION
2.1 MARKETS COVERED
2.2 GEOGRAPHICAL SCOPE
2.3 YEARS CONSIDERED FOR THE STUDY
2.4 CURRENCY AND PRICING
2.5 DBMR TRIPOD DATA VALIDATION MODEL
2.6 MULTIVARIATE MODELLING
2.7 PRIMARY INTERVIEWS WITH KEY OPINION LEADERS
2.8 DBMR MARKET POSITION GRID
2.9 VENDOR SHARE ANALYSIS
2.1 MARKET END USER COVERAGE GRID
2.11 SECONDARY SOURCES
2.12 ASSUMPTIONS
3 EXECUTIVE SUMMARY
4 PREMIUM INSIGHTS
4.1 PESTEL ANALYSIS
4.2 PORTERS FIVE FORCES ANALYSIS
5 ASIA-PACIFIC MASS SPECTROMETRY MARKET: REGULATIONS
5.1 REGULATORY AUTHORITIES IN NORTH AMERICA
5.2 REGULATORY AUTHORITIES IN SOUTH AMERICA
5.3 REGULATORY AUTHORITIES IN EUROPE
5.4 REGULATORY AUTHORITIES IN MIDDLE EAST AND AFRICA.
5.5 REGULATORY AUTHORITIES IN ASIA PACIFIC.
6 MARKET OVERVIEW
6.1 DRIVERS
6.1.1 TECHNOLOGICAL ADVANCEMENTS IN MASS SPECTROMETRY
6.1.2 GROWING APPLICATIONS OF MASS SPECTROMETRY (MS) IN PHARMACEUTICALS AND BIOTECHNOLOGY
6.1.3 DEMAND OF MASS SPECTROMETRY IN ENVIRONMENTAL TESTING AND FOOD SAFETY
6.1.4 ADVANCEMENTS IN PROTEOMICS AND GENOMICS RESEARCH
6.2 RESTRAINTS
6.2.1 HIGH COST OF MASS SPECTROMETRY
6.2.2 COMPETITION FROM ALTERNATIVE TECHNOLOGIES
6.3 OPPORTUNITIES
6.3.1 ADVANCEMENTS IN AUTOMATION AND ARTIFICIAL INTELLIGENCE (AI) IN MASS SPECTROMETRY
6.3.2 GROWING ADOPTION IN CLINICAL LABS
6.3.3 RISING ADOPTION OF COMPACT AND PORTABLE MASS SPECTROMETERS
6.4 CHALLENGES
6.4.1 SKILLED WORKFORCE SHORTAGE
6.4.2 EFFECTIVELY MANAGING AND STORING LARGE VOLUMES OF DATA
7 ASIA-PACIFIC MASS SPECTROMETRY MARKET, BY TECHNOLOGY
7.1 OVERVIEW
7.2 HYBRID MASS SPECTROMETRY
7.2.1 ORBITRAP-MS
7.2.2 FT-MS
7.2.3 OTHERS
7.3 SINGLE MASS SPECTROMETRY
7.3.1 TIME OF FLIGHT
7.3.2 QUADRUPOLE
7.3.3 OTHERS
7.4 OTHERS
8 ASIA-PACIFIC MASS SPECTROMETRY MARKET, BY MODALITY
8.1 OVERVIEW
8.2 BENCHTOP
8.3 STANDALONE
9 ASIA-PACIFIC MASS SPECTROMETRY MARKET, BY APPLICATION
9.1 OVERVIEW
9.2 LIFE SCIENCE RESEARCH
9.3 DRUG DISCOVERY
9.4 ENVIRONMENTAL TESTING
9.5 FOOD TESTING
9.6 APPLIED INDUSTRIES
9.7 CLINICAL DIAGNOSTICS
9.8 OTHERS
10 ASIA-PACIFIC MASS SPECTROMETRY MARKET, BY DISTRIBUTION CHANNEL
10.1 OVERVIEW
10.2 DIRECT TENDERS
10.3 RETAIL SALES
10.4 OTHERS
11 ASIA-PACIFIC MASS SPECTROMETRY MARKET, BY END USER
11.1 OVERVIEW
11.2 PHARMACEUTICAL INDUSTRY
11.3 RESEARCH AND ACADEMIC INSTITUTES
11.4 FOOD & BEVERAGE INDUSTRY
11.5 PETROCHEMICAL INDUSTRY
11.6 OTHERS
12 ASIA-PACIFIC MASS SPECTROMETRY MARKET, BY REGION
12.1 ASIA-PACIFIC
12.1.1 CHINA
12.1.2 JAPAN
12.1.3 INDIA
12.1.4 AUSTRALIA
12.1.5 SOUTH KOREA
12.1.6 THAILAND
12.1.7 INDONESIA
12.1.8 MALAYSIA
12.1.9 SINGAPORE
12.1.10 VIETNAM
12.1.11 PHILIPPINES
12.1.12 REST OF ASIA-PACIFIC
13 ASIA-PACIFIC MASS SPECTROMETRY MARKET, COMPANY LANDSCAPE
13.1 COMPANY SHARE ANALYSIS: ASIA-PACIFIC
14 SWOT ANALYSIS
15 COMPANY PROFILES
15.1 THERMO FISHER SCIENTIFIC INC.
15.1.1 COMPANY SNAPSHOT
15.1.2 REVENUE ANALYSIS
15.1.3 COMPANY SHARE ANALYSIS
15.1.4 PRODUCT PORTFOLIO
15.1.5 RECENT DEVELOPMENT
15.2 SHIMADZU CORPORATION
15.2.1 COMPANY SNAPSHOT
15.2.2 REVENUE ANALYSIS
15.2.3 COMPANY SHARE ANALYSIS
15.2.4 PRODUCT PORTFOLIO
15.2.5 RECENT DEVELOPMENTS
15.3 AGILENT TECHNOLOGIES, INC.
15.3.1 COMPANY SNAPSHOT
15.3.2 REVENUE ANALYSIS
15.3.3 COMPANY SHARE ANALYSIS
15.3.4 PRODUCT PORTFOLIO
15.3.5 RECENT UPDATES
15.4 BRUKER
15.4.1 COMPANY SNAPSHOT
15.4.2 REVENUE ANALYSIS
15.4.3 COMPANY SHARE ANALYSIS
15.4.4 PRODUCT PORTFOLIO
15.4.5 RECENT DEVELOPMENT
15.5 WATERS CORPORATION
15.5.1 COMPANY SNAPSHOT
15.5.2 REVENUE ANALYSIS
15.5.3 COMPANY SHARE ANALYSIS
15.5.4 PRODUCT PORTFOLIO
15.5.5 RECENT DEVELOPMENTS
15.6 AMETEK.INC.
15.6.1 COMPANY SNAPSHOT
15.6.2 REVENUE ANALYSIS
15.6.3 PRODUCT PORTFOLIO
15.6.4 RECENT DEVELOPMENT
15.7 DANAHER CORPORATION
15.7.1 COMPANY SNAPSHOT
15.7.2 REVENUE ANALYSIS
15.7.3 PRODUCT PORTFOLIO
15.7.4 RECENT DEVELOPMENTS
15.8 HIDEN ANALYTICAL
15.8.1 COMPANY SNAPSHOT
15.8.2 PRODUCT PORTFOLIO
15.8.3 RECENT DEVELOPMENTS
15.9 HITACHI, LTD.B(SUBSIDIARIE COMPANY HITACHI HIGH-TECH INDIA PRIVATE LIMITED)
15.9.1 COMPANY SNAPSHOT
15.9.2 REVENUE ANALYSIS
15.9.3 PRODUCT PORTFOLIO
15.9.4 RECENT DEVELOPMENT
15.1 JEOL LTD.
15.10.1 COMPANY SNAPSHOT
15.10.2 REVENUE ANALYSIS
15.10.3 PRODUCT PORTFOLIO
15.10.4 RECENT DEVELOPMENT
15.11 KORE TECHNOLOGY
15.11.1 COMPANY SNAPSHOT
15.11.2 PRODUCT PORTFOLIO
15.11.3 RECENT DEVELOPMENT
15.12 LECO CORPORATION
15.12.1 COMPANY SNAPSHOT
15.12.2 PRODUCT PORTFOLIO
15.12.3 RECENT UPDATES
15.13 PERKINELMER INC
15.13.1 COMPANY SNAPSHOT
15.13.2 REVENUE ANALYSIS
15.13.3 PRODUCT PORTFOLIO
15.13.4 RECENT DEVELOPMENT
15.14 RIGAKU HOLDINGS CORPORATION
15.14.1 COMPANY SNAPSHOT
15.14.2 PRODUCT PORTFOLIO
15.14.3 RECENT DEVELOPMENT
16 QUESTIONNAIRE
17 RELATED REPORTS
List of Table
TABLE 1 ASIA-PACIFIC MASS SPECTROMETRY MARKET, BY TECHNOLOGY, 2022-2031 (USD THOUSAND)
TABLE 2 ASIA-PACIFIC HYBRID MASS SPECTROMETRY IN MASS SPECTROMETRY MARKET, BY REGION, 2022-2031 (USD THOUSAND)
TABLE 3 ASIA-PACIFIC HYBRID MASS SPECTROMETRY IN MASS SPECTROMETRY MARKET, BY TYPE, 2022-2031 (USD THOUSAND)
TABLE 4 ASIA-PACIFIC SINGLE MASS SPECTROMETRY IN MASS SPECTROMETRY MARKET, BY REGION, 2022-2031 (USD THOUSAND)
TABLE 5 ASIA-PACIFIC SINGLE MASS SPECTROMETRY IN MASS SPECTROMETRY MARKET, BY TYPE, 2022-2031 (USD THOUSAND)
TABLE 6 ASIA-PACIFIC OTHERS IN MASS SPECTROMETRY MARKET, BY REGION, 2022-2031 (USD THOUSAND)
TABLE 7 ASIA-PACIFIC MASS SPECTROMETRY MARKET, BY MODALITY, 2022-2031 (USD THOUSAND)
TABLE 8 ASIA-PACIFIC BENCHTOP IN MASS SPECTROMETRY MARKET, BY REGION, 2022-2031 (USD THOUSAND)
TABLE 9 ASIA-PACIFIC STANDALONE IN MASS SPECTROMETRY MARKET, BY REGION, 2022-2031 (USD THOUSAND)
TABLE 10 ASIA-PACIFIC MASS SPECTROMETRY MARKET, BY APPLICATION, 2022-2031 (USD THOUSAND)
TABLE 11 ASIA-PACIFIC LIFE SCIENCE RESEARCH IN MASS SPECTROMETRY MARKET, BY REGION, 2022-2031 (USD THOUSAND)
TABLE 12 ASIA-PACIFIC DRUG DISCOVERY IN MASS SPECTROMETRY MARKET, BY REGION, 2022-2031 (USD THOUSAND)
TABLE 13 ASIA-PACIFIC ENVIRONMENTAL TESTING IN MASS SPECTROMETRY MARKET, BY REGION, 2022-2031 (USD THOUSAND)
TABLE 14 ASIA-PACIFIC FOOD TESTING IN MASS SPECTROMETRY MARKET, BY REGION, 2022-2031 (USD THOUSAND)
TABLE 15 ASIA-PACIFIC APPLIED INDUSTRIES IN MASS SPECTROMETRY MARKET, BY REGION, 2022-2031 (USD THOUSAND)
TABLE 16 ASIA-PACIFIC CLINICAL DIAGNOSTICS IN MASS SPECTROMETRY MARKET, BY REGION, 2022-2031 (USD THOUSAND)
TABLE 17 ASIA-PACIFIC OTHERS IN MASS SPECTROMETRY MARKET, BY REGION, 2022-2031 (USD THOUSAND)
TABLE 18 ASIA-PACIFIC MASS SPECTROMETRY MARKET, BY DISTRIBUTION CHANNEL, 2022-2031 (USD THOUSAND)
TABLE 19 ASIA-PACIFIC DIRECT TENDERS IN MASS SPECTROMETRY MARKET, BY REGION, 2022-2031 (USD THOUSAND)
TABLE 20 ASIA-PACIFIC RETAIL SALES IN MASS SPECTROMETRY MARKET, BY REGION, 2022-2031 (USD THOUSAND)
TABLE 21 ASIA-PACIFIC OTHERS IN MASS SPECTROMETRY MARKET, BY REGION, 2022-2031 (USD THOUSAND)
TABLE 22 ASIA-PACIFIC MASS SPECTROMETRY MARKET, BY END USER, 2022-2031 (USD THOUSAND)
TABLE 23 ASIA-PACIFIC PHARMACEUTICAL INDUSTRY IN MASS SPECTROMETRY MARKET, BY REGION, 2022-2031 (USD THOUSAND)
TABLE 24 ASIA-PACIFIC RESEARCH AND ACADEMIC INSTITUTES IN MASS SPECTROMETRY MARKET, BY REGION, 2022-2031 (USD THOUSAND)
TABLE 25 ASIA-PACIFIC FOOD & BEVERAGE INDUSTRY IN MASS SPECTROMETRY MARKET, BY REGION, 2022-2031 (USD THOUSAND)
TABLE 26 ASIA-PACIFIC PETROCHEMICAL INDUSTRY IN MASS SPECTROMETRY MARKET, BY REGION, 2022-2031 (USD THOUSAND)
TABLE 27 ASIA-PACIFIC OTHERS IN MASS SPECTROMETRY MARKET, BY REGION, 2022-2031 (USD THOUSAND)
TABLE 28 ASIA-PACIFIC MASS SPECTROMETRY MARKET, BY COUNTRY, 2022-2031 (USD THOUSAND)
TABLE 29 ASIA-PACIFIC MASS SPECTROMETRY MARKET, BY TECHNOLOGY, 2022-2031 (USD THOUSAND)
TABLE 30 ASIA-PACIFIC HYBRID MASS SPECTROMETRY IN MASS SPECTROMETRY MARKET, BY TYPE, 2022-2031 (USD THOUSAND)
TABLE 31 ASIA-PACIFIC SINGLE MASS SPECTROMETRY IN MASS SPECTROMETRY MARKET, BY TYPE, 2022-2031 (USD THOUSAND)
TABLE 32 ASIA-PACIFIC MASS SPECTROMETRY MARKET, BY MODALITY, 2022-2031 (USD THOUSAND)
TABLE 33 ASIA-PACIFIC MASS SPECTROMETRY MARKET, BY APPLICATION, 2022-2031 (USD THOUSAND)
TABLE 34 ASIA-PACIFIC MASS SPECTROMETRY MARKET, BY END USER, 2022-2031 (USD THOUSAND)
TABLE 35 ASIA-PACIFIC MASS SPECTROMETRY MARKET, BY DISTRIBUTION CHANNEL, 2022-2031 (USD THOUSAND)
TABLE 36 CHINA MASS SPECTROMETRY MARKET, BY TECHNOLOGY, 2022-2031 (USD THOUSAND)
TABLE 37 CHINA HYBRID MASS SPECTROMETRY IN MASS SPECTROMETRY MARKET, BY TYPE, 2022-2031 (USD THOUSAND)
TABLE 38 CHINA SINGLE MASS SPECTROMETRY IN MASS SPECTROMETRY MARKET, BY TYPE, 2022-2031 (USD THOUSAND)
TABLE 39 CHINA MASS SPECTROMETRY MARKET, BY MODALITY, 2022-2031 (USD THOUSAND)
TABLE 40 CHINA MASS SPECTROMETRY MARKET, BY APPLICATION, 2022-2031 (USD THOUSAND)
TABLE 41 CHINA MASS SPECTROMETRY MARKET, BY END USER, 2022-2031 (USD THOUSAND)
TABLE 42 CHINA MASS SPECTROMETRY MARKET, BY DISTRIBUTION CHANNEL, 2022-2031 (USD THOUSAND)
TABLE 43 JAPAN MASS SPECTROMETRY MARKET, BY TECHNOLOGY, 2022-2031 (USD THOUSAND)
TABLE 44 JAPAN HYBRID MASS SPECTROMETRY IN MASS SPECTROMETRY MARKET, BY TYPE, 2022-2031 (USD THOUSAND)
TABLE 45 JAPAN SINGLE MASS SPECTROMETRY IN MASS SPECTROMETRY MARKET, BY TYPE, 2022-2031 (USD THOUSAND)
TABLE 46 JAPAN MASS SPECTROMETRY MARKET, BY MODALITY, 2022-2031 (USD THOUSAND)
TABLE 47 JAPAN MASS SPECTROMETRY MARKET, BY APPLICATION, 2022-2031 (USD THOUSAND)
TABLE 48 JAPAN MASS SPECTROMETRY MARKET, BY END USER, 2022-2031 (USD THOUSAND)
TABLE 49 JAPAN MASS SPECTROMETRY MARKET, BY DISTRIBUTION CHANNEL, 2022-2031 (USD THOUSAND)
TABLE 50 INDIA MASS SPECTROMETRY MARKET, BY TECHNOLOGY, 2022-2031 (USD THOUSAND)
TABLE 51 INDIA HYBRID MASS SPECTROMETRY IN MASS SPECTROMETRY MARKET, BY TYPE, 2022-2031 (USD THOUSAND)
TABLE 52 INDIA SINGLE MASS SPECTROMETRY IN MASS SPECTROMETRY MARKET, BY TYPE, 2022-2031 (USD THOUSAND)
TABLE 53 INDIA MASS SPECTROMETRY MARKET, BY MODALITY, 2022-2031 (USD THOUSAND)
TABLE 54 INDIA MASS SPECTROMETRY MARKET, BY APPLICATION, 2022-2031 (USD THOUSAND)
TABLE 55 INDIA MASS SPECTROMETRY MARKET, BY END USER, 2022-2031 (USD THOUSAND)
TABLE 56 INDIA MASS SPECTROMETRY MARKET, BY DISTRIBUTION CHANNEL, 2022-2031 (USD THOUSAND)
TABLE 57 AUSTRALIA MASS SPECTROMETRY MARKET, BY TECHNOLOGY, 2022-2031 (USD THOUSAND)
TABLE 58 AUSTRALIA HYBRID MASS SPECTROMETRY IN MASS SPECTROMETRY MARKET, BY TYPE, 2022-2031 (USD THOUSAND)
TABLE 59 AUSTRALIA SINGLE MASS SPECTROMETRY IN MASS SPECTROMETRY MARKET, BY TYPE, 2022-2031 (USD THOUSAND)
TABLE 60 AUSTRALIA MASS SPECTROMETRY MARKET, BY MODALITY, 2022-2031 (USD THOUSAND)
TABLE 61 AUSTRALIA MASS SPECTROMETRY MARKET, BY APPLICATION, 2022-2031 (USD THOUSAND)
TABLE 62 AUSTRALIA MASS SPECTROMETRY MARKET, BY END USER, 2022-2031 (USD THOUSAND)
TABLE 63 AUSTRALIA MASS SPECTROMETRY MARKET, BY DISTRIBUTION CHANNEL, 2022-2031 (USD THOUSAND)
TABLE 64 SOUTH KOREA MASS SPECTROMETRY MARKET, BY TECHNOLOGY, 2022-2031 (USD THOUSAND)
TABLE 65 SOUTH KOREA HYBRID MASS SPECTROMETRY IN MASS SPECTROMETRY MARKET, BY TYPE, 2022-2031 (USD THOUSAND)
TABLE 66 SOUTH KOREA SINGLE MASS SPECTROMETRY IN MASS SPECTROMETRY MARKET, BY TYPE, 2022-2031 (USD THOUSAND)
TABLE 67 SOUTH KOREA MASS SPECTROMETRY MARKET, BY MODALITY, 2022-2031 (USD THOUSAND)
TABLE 68 SOUTH KOREA MASS SPECTROMETRY MARKET, BY APPLICATION, 2022-2031 (USD THOUSAND)
TABLE 69 SOUTH KOREA MASS SPECTROMETRY MARKET, BY END USER, 2022-2031 (USD THOUSAND)
TABLE 70 SOUTH KOREA MASS SPECTROMETRY MARKET, BY DISTRIBUTION CHANNEL, 2022-2031 (USD THOUSAND)
TABLE 71 THAILAND MASS SPECTROMETRY MARKET, BY TECHNOLOGY, 2022-2031 (USD THOUSAND)
TABLE 72 THAILAND HYBRID MASS SPECTROMETRY IN MASS SPECTROMETRY MARKET, BY TYPE, 2022-2031 (USD THOUSAND)
TABLE 73 THAILAND SINGLE MASS SPECTROMETRY IN MASS SPECTROMETRY MARKET, BY TYPE, 2022-2031 (USD THOUSAND)
TABLE 74 THAILAND MASS SPECTROMETRY MARKET, BY MODALITY, 2022-2031 (USD THOUSAND)
TABLE 75 THAILAND MASS SPECTROMETRY MARKET, BY APPLICATION, 2022-2031 (USD THOUSAND)
TABLE 76 THAILAND MASS SPECTROMETRY MARKET, BY END USER, 2022-2031 (USD THOUSAND)
TABLE 77 THAILAND MASS SPECTROMETRY MARKET, BY DISTRIBUTION CHANNEL, 2022-2031 (USD THOUSAND)
TABLE 78 INDONESIA MASS SPECTROMETRY MARKET, BY TECHNOLOGY, 2022-2031 (USD THOUSAND)
TABLE 79 INDONESIA HYBRID MASS SPECTROMETRY IN MASS SPECTROMETRY MARKET, BY TYPE, 2022-2031 (USD THOUSAND)
TABLE 80 INDONESIA SINGLE MASS SPECTROMETRY IN MASS SPECTROMETRY MARKET, BY TYPE, 2022-2031 (USD THOUSAND)
TABLE 81 INDONESIA MASS SPECTROMETRY MARKET, BY MODALITY, 2022-2031 (USD THOUSAND)
TABLE 82 INDONESIA MASS SPECTROMETRY MARKET, BY APPLICATION, 2022-2031 (USD THOUSAND)
TABLE 83 INDONESIA MASS SPECTROMETRY MARKET, BY END USER, 2022-2031 (USD THOUSAND)
TABLE 84 INDONESIA MASS SPECTROMETRY MARKET, BY DISTRIBUTION CHANNEL, 2022-2031 (USD THOUSAND)
TABLE 85 MALAYSIA MASS SPECTROMETRY MARKET, BY TECHNOLOGY, 2022-2031 (USD THOUSAND)
TABLE 86 MALAYSIA HYBRID MASS SPECTROMETRY IN MASS SPECTROMETRY MARKET, BY TYPE, 2022-2031 (USD THOUSAND)
TABLE 87 MALAYSIA SINGLE MASS SPECTROMETRY IN MASS SPECTROMETRY MARKET, BY TYPE, 2022-2031 (USD THOUSAND)
TABLE 88 MALAYSIA MASS SPECTROMETRY MARKET, BY MODALITY, 2022-2031 (USD THOUSAND)
TABLE 89 MALAYSIA MASS SPECTROMETRY MARKET, BY APPLICATION, 2022-2031 (USD THOUSAND)
TABLE 90 MALAYSIA MASS SPECTROMETRY MARKET, BY END USER, 2022-2031 (USD THOUSAND)
TABLE 91 MALAYSIA MASS SPECTROMETRY MARKET, BY DISTRIBUTION CHANNEL, 2022-2031 (USD THOUSAND)
TABLE 92 SINGAPORE MASS SPECTROMETRY MARKET, BY TECHNOLOGY, 2022-2031 (USD THOUSAND)
TABLE 93 SINGAPORE HYBRID MASS SPECTROMETRY IN MASS SPECTROMETRY MARKET, BY TYPE, 2022-2031 (USD THOUSAND)
TABLE 94 SINGAPORE SINGLE MASS SPECTROMETRY IN MASS SPECTROMETRY MARKET, BY TYPE, 2022-2031 (USD THOUSAND)
TABLE 95 SINGAPORE MASS SPECTROMETRY MARKET, BY MODALITY, 2022-2031 (USD THOUSAND)
TABLE 96 SINGAPORE MASS SPECTROMETRY MARKET, BY APPLICATION, 2022-2031 (USD THOUSAND)
TABLE 97 SINGAPORE MASS SPECTROMETRY MARKET, BY END USER, 2022-2031 (USD THOUSAND)
TABLE 98 SINGAPORE MASS SPECTROMETRY MARKET, BY DISTRIBUTION CHANNEL, 2022-2031 (USD THOUSAND)
TABLE 99 VIETNAM MASS SPECTROMETRY MARKET, BY TECHNOLOGY, 2022-2031 (USD THOUSAND)
TABLE 100 VIETNAM HYBRID MASS SPECTROMETRY IN MASS SPECTROMETRY MARKET, BY TYPE, 2022-2031 (USD THOUSAND)
TABLE 101 VIETNAM SINGLE MASS SPECTROMETRY IN MASS SPECTROMETRY MARKET, BY TYPE, 2022-2031 (USD THOUSAND)
TABLE 102 VIETNAM MASS SPECTROMETRY MARKET, BY MODALITY, 2022-2031 (USD THOUSAND)
TABLE 103 VIETNAM MASS SPECTROMETRY MARKET, BY APPLICATION, 2022-2031 (USD THOUSAND)
TABLE 104 VIETNAM MASS SPECTROMETRY MARKET, BY END USER, 2022-2031 (USD THOUSAND)
TABLE 105 VIETNAM MASS SPECTROMETRY MARKET, BY DISTRIBUTION CHANNEL, 2022-2031 (USD THOUSAND)
TABLE 106 PHILIPPINES MASS SPECTROMETRY MARKET, BY TECHNOLOGY, 2022-2031 (USD THOUSAND)
TABLE 107 PHILIPPINES HYBRID MASS SPECTROMETRY IN MASS SPECTROMETRY MARKET, BY TYPE, 2022-2031 (USD THOUSAND)
TABLE 108 PHILIPPINES SINGLE MASS SPECTROMETRY IN MASS SPECTROMETRY MARKET, BY TYPE, 2022-2031 (USD THOUSAND)
TABLE 109 PHILIPPINES MASS SPECTROMETRY MARKET, BY MODALITY, 2022-2031 (USD THOUSAND)
TABLE 110 PHILIPPINES MASS SPECTROMETRY MARKET, BY APPLICATION, 2022-2031 (USD THOUSAND)
TABLE 111 PHILIPPINES MASS SPECTROMETRY MARKET, BY END USER, 2022-2031 (USD THOUSAND)
TABLE 112 PHILIPPINES MASS SPECTROMETRY MARKET, BY DISTRIBUTION CHANNEL, 2022-2031 (USD THOUSAND)
TABLE 113 REST OF ASIA-PACIFIC MASS SPECTROMETRY MARKET, BY TECHNOLOGY, 2022-2031 (USD THOUSAND)
List of Figure
FIGURE 1 ASIA-PACIFIC MASS SPECTROMETRY MARKET: SEGMENTATION
FIGURE 2 ASIA-PACIFIC MASS SPECTROMETRY MARKET: DATA TRIANGULATION
FIGURE 3 ASIA-PACIFIC MASS SPECTROMETRY MARKET: DROC ANALYSIS
FIGURE 4 ASIA-PACIFIC MASS SPECTROMETRY MARKET: ASIA-PACIFIC VS REGIONAL MARKET ANALYSIS
FIGURE 5 ASIA-PACIFIC MASS SPECTROMETRY MARKET: COMPANY RESEARCH ANALYSIS
FIGURE 6 ASIA-PACIFIC MASS SPECTROMETRY MARKET: MULTIVARIATE MODELLING
FIGURE 7 ASIA-PACIFIC MASS SPECTROMETRY MARKET: INTERVIEW DEMOGRAPHICS
FIGURE 8 ASIA-PACIFIC MASS SPECTROMETRY MARKET: DBMR MARKET POSITION GRID
FIGURE 9 ASIA-PACIFIC MASS SPECTROMETRY MARKET: VENDOR SHARE ANALYSIS
FIGURE 10 ASIA-PACIFIC MASS SPECTROMETRY MARKET: MARKET END USER COVERAGE GRID
FIGURE 11 ASIA-PACIFIC MASS SPECTROMETRY MARKET: SEGMENTATION
FIGURE 12 EXECUTIVE SUMMARY
FIGURE 13 STRATEGIC DECISIONS
FIGURE 14 ASIA-PACIFIC MASS SPECTROMETRY MARKET
FIGURE 15 HYBRID MASS SPECTROMETRY SEGMENT IS EXPECTED TO ACCOUNT FOR THE LARGEST SHARE OF THE ASIA-PACIFIC MASS SPECTROMETRY MARKET IN 2024 & 2031
FIGURE 16 DROC ANALYSIS
FIGURE 17 ASIA-PACIFIC MASS SPECTROMETRY MARKET: BY TECHNOLOGY, 2023
FIGURE 18 ASIA-PACIFIC MASS SPECTROMETRY MARKET: BY TECHNOLOGY, 2024-2031 (USD THOUSAND)
FIGURE 19 ASIA-PACIFIC MASS SPECTROMETRY MARKET: BY TECHNOLOGY, CAGR (2024-2031)
FIGURE 20 ASIA-PACIFIC MASS SPECTROMETRY MARKET: BY TECHNOLOGY, LIFELINE CURVE
FIGURE 21 ASIA-PACIFIC MASS SPECTROMETRY MARKET: BY MODALITY, 2023
FIGURE 22 ASIA-PACIFIC MASS SPECTROMETRY MARKET: BY MODALITY, 2024-2031 (USD THOUSAND)
FIGURE 23 ASIA-PACIFIC MASS SPECTROMETRY MARKET: BY MODALITY, CAGR (2024-2031)
FIGURE 24 ASIA-PACIFIC MASS SPECTROMETRY MARKET: BY MODALITY, LIFELINE CURVE
FIGURE 25 ASIA-PACIFIC MASS SPECTROMETRY MARKET: BY APPLICATION, 2023
FIGURE 26 ASIA-PACIFIC MASS SPECTROMETRY MARKET: BY APPLICATION, 2024-2031 (USD THOUSAND)
FIGURE 27 ASIA-PACIFIC MASS SPECTROMETRY MARKET: BY APPLICATION, CAGR (2024-2031)
FIGURE 28 ASIA-PACIFIC MASS SPECTROMETRY MARKET: BY APPLICATION, LIFELINE CURVE
FIGURE 29 ASIA-PACIFIC MASS SPECTROMETRY MARKET: BY DISTRIBUTION CHANNEL, 2023
FIGURE 30 ASIA-PACIFIC MASS SPECTROMETRY MARKET: BY DISTRIBUTION CHANNEL, 2024-2031 (USD THOUSAND)
FIGURE 31 ASIA-PACIFIC MASS SPECTROMETRY MARKET: BY DISTRIBUTION CHANNEL, CAGR (2024-2031)
FIGURE 32 ASIA-PACIFIC MASS SPECTROMETRY MARKET: BY DISTRIBUTION CHANNEL, LIFELINE CURVE
FIGURE 33 ASIA-PACIFIC MASS SPECTROMETRY MARKET: BY END USER, 2023
FIGURE 34 ASIA-PACIFIC MASS SPECTROMETRY MARKET: BY END USER, 2024-2031 (USD THOUSAND)
FIGURE 35 ASIA-PACIFIC MASS SPECTROMETRY MARKET: BY END USER, CAGR (2024-2031)
FIGURE 36 ASIA-PACIFIC MASS SPECTROMETRY MARKET: BY END USER, LIFELINE CURVE
FIGURE 37 ASIA-PACIFIC MASS SPECTROMETRY MARKET: SNAPSHOT (2023)
FIGURE 38 ASIA-PACIFIC MASS SPECTROMETRY MARKET: COMPANY SHARE 2023 (%)
Data collection and base year analysis are done using data collection modules with large sample sizes. The stage includes obtaining market information or related data through various sources and strategies. It includes examining and planning all the data acquired from the past in advance. It likewise envelops the examination of information inconsistencies seen across different information sources. The market data is analysed and estimated using market statistical and coherent models. Also, market share analysis and key trend analysis are the major success factors in the market report. To know more, please request an analyst call or drop down your inquiry.
The key research methodology used by DBMR research team is data triangulation which involves data mining, analysis of the impact of data variables on the market and primary (industry expert) validation. Data models include Vendor Positioning Grid, Market Time Line Analysis, Market Overview and Guide, Company Positioning Grid, Patent Analysis, Pricing Analysis, Company Market Share Analysis, Standards of Measurement, Global versus Regional and Vendor Share Analysis. To know more about the research methodology, drop in an inquiry to speak to our industry experts.
Data Bridge Market Research is a leader in advanced formative research. We take pride in servicing our existing and new customers with data and analysis that match and suits their goal. The report can be customized to include price trend analysis of target brands understanding the market for additional countries (ask for the list of countries), clinical trial results data, literature review, refurbished market and product base analysis. Market analysis of target competitors can be analyzed from technology-based analysis to market portfolio strategies. We can add as many competitors that you require data about in the format and data style you are looking for. Our team of analysts can also provide you data in crude raw excel files pivot tables (Fact book) or can assist you in creating presentations from the data sets available in the report.


