
Asia Pacific Mobility As A Service Market
Market Size in USD Billion
 USD
109.08 Billion
USD
1,113.81 Billion
2025
2033
USD
109.08 Billion
USD
1,113.81 Billion
2025
2033
| 2026 - 2033 | |
| USD 109.08 Billion | |
| USD 1,113.81 Billion | |
| % | |
|
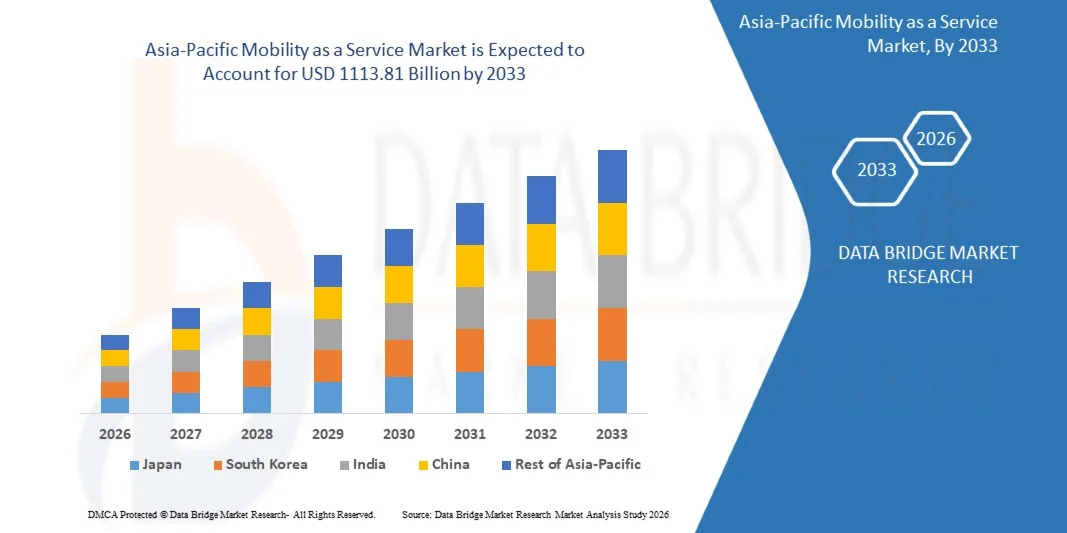
Asia-Pacific Mobility as a Service Market Size
- The Asia-Pacific Mobility as a Service (MaaS) Market was valued at USD 109.08 billion in 2025 and is projected to reach USD 1113.81 billion by 2033, expanding at a CAGR of 33.70% throughout the forecast period.
- The market’s expansion is primarily driven by rapid urbanization, rising smartphone penetration, and ongoing advancements in digital mobility platforms, which are collectively transforming transportation ecosystems across the region.
- Additionally, increasing consumer demand for seamless, integrated, and cost-efficient commuting solutions is positioning MaaS as a preferred mobility framework. These combined trends are accelerating the adoption of MaaS platforms and substantially contributing to overall market growth.
Asia-Pacific Mobility as a Service Market Analysis
- Mobility as a Service (MaaS), providing integrated digital platforms for seamless multi-modal transportation, is becoming an essential component of urban mobility solutions in both metropolitan and suburban areas due to its convenience, real-time route optimization, and integration with public transport and shared mobility services.
- The rising adoption of MaaS is primarily driven by increasing urban congestion, growing smartphone penetration, and heightened consumer preference for flexible, cost-effective, and environmentally friendly travel options.
- China dominated the Asia-Pacific Mobility as a Service Market with the largest revenue share of 34.4% in 2025, supported by early adoption of digital transportation platforms, high disposable incomes, and a robust presence of leading MaaS providers, with the U.S. witnessing significant growth in app-based mobility services and integrated transport solutions powered by AI and IoT innovations.
- India is projected to be the fastest-growing region in the Asia-Pacific Mobility as a Service Market during the forecast period due to rapid urbanization, expanding middle-class populations, and increasing investments in smart city and digital transportation initiatives.
- The ride hailing segment dominated the market with the largest revenue share of 42.5% in 2025, driven by the widespread adoption of app-based taxi services, convenience of door-to-door transport, and integration with multi-modal MaaS platforms.
Report Scope and Asia-Pacific Mobility as a Service Market Segmentation
|
Attributes |
Asia-Pacific Mobility as a Service Key Market Insights |
|
Segments Covered |
|
|
Countries Covered |
Asia-Pacific
|
|
Key Market Players |
|
|
Market Opportunities |
|
|
Value Added Data Infosets |
In addition to the market insights such as market value, growth rate, market segments, geographical coverage, market players, and market scenario, the market report curated by the Data Bridge Market Research team includes in-depth expert analysis, import/export analysis, pricing analysis, production consumption analysis, and pestle analysis. |
Asia-Pacific Mobility as a Service Market Trends
“Enhanced Convenience Through AI and Predictive Mobility”
- A significant and accelerating trend in the Asia-Pacific Mobility as a Service (MaaS) Market is the deepening integration with artificial intelligence (AI) and predictive analytics within mobility platforms. This fusion of technologies is enhancing user convenience, route optimization, and overall efficiency of multimodal transportation systems.
- For instance, MaaS platforms such as Didi Chuxing and Grab leverage AI to provide dynamic ride-matching, predictive travel times, and personalized route suggestions, allowing users to plan their journeys more efficiently and reduce wait times. Similarly, Moovit uses AI-driven algorithms to optimize public transit routes, offering commuters seamless connections between buses, trains, and shared mobility options.
- AI integration in MaaS enables features such as learning user travel patterns to suggest optimal routes and providing intelligent notifications based on traffic conditions or service disruptions. For example, platforms like Gojek and Ola incorporate AI to predict demand surges and adjust ride availability or pricing accordingly, enhancing service reliability.
- The seamless integration of MaaS platforms with digital assistants and mobility apps facilitates centralized management of multiple transportation modes. Through a single interface, users can book rides, access public transit, and monitor real-time traffic and service updates, creating a unified, efficient, and automated commuting experience.
- This trend toward more intelligent, intuitive, and interconnected mobility solutions is fundamentally reshaping user expectations for urban transportation. Consequently, companies such as Grab and Transit App are developing AI-enabled MaaS features with predictive scheduling, multimodal integration, and personalized travel recommendations.
- The demand for MaaS platforms that offer seamless AI and predictive analytics integration is growing rapidly across both urban and semi-urban regions, as consumers increasingly prioritize convenience, efficiency, and intelligent multimodal mobility solutions.
Asia-Pacific Mobility as a Service Market Dynamics
Driver
“Growing Need Due to Urban Congestion and Demand for Seamless Mobility”
- The increasing challenges of urban congestion, longer commute times, and rising demand for convenient, flexible, and multimodal transportation options are significant drivers for the heightened adoption of Mobility as a Service (MaaS) platforms.
- For instance, in 2025, Grab announced enhancements to its MaaS ecosystem, integrating ride-hailing, public transit, and bike-sharing options through a single app interface. Such initiatives by key players are expected to accelerate MaaS adoption across the Asia-Pacific region during the forecast period.
- As commuters become more aware of inefficiencies in traditional transport systems and seek streamlined, cost-effective alternatives, MaaS platforms offer advanced features such as real-time route optimization, multimodal trip planning, and dynamic pricing, providing a compelling improvement over conventional transportation options.
- Furthermore, the growing popularity of digital mobility solutions and the desire for connected, app-based transport experiences are making MaaS an integral part of smart city initiatives, offering seamless integration with public transit, shared mobility, and micro-mobility services.
- The convenience of booking, paying, and tracking multiple transport modes through a single platform, along with features like predictive scheduling and personalized route recommendations, are key factors driving MaaS adoption in both urban and semi-urban areas. Increasing smartphone penetration and the expansion of digital infrastructure further support this trend.
Restraint/Challenge
“Concerns Regarding Data Privacy, Cybersecurity, and High Implementation Costs”
- Concerns surrounding the cybersecurity and data privacy of connected mobility platforms pose a significant challenge to broader market penetration. As MaaS solutions rely on network connectivity, GPS tracking, and user data, they are susceptible to hacking attempts and potential misuse of personal travel information, raising anxieties among potential users.
- For instance, reports of data breaches in ride-hailing and mobility apps have made some consumers hesitant to fully adopt MaaS solutions.
- Addressing these concerns through robust encryption, secure authentication protocols, and transparent data management practices is crucial for building consumer trust. Companies such as Moovit, Grab, and Didi Chuxing emphasize their advanced security measures and privacy policies to reassure users.
- Additionally, the relatively high initial investment required to develop integrated MaaS platforms—including app development, fleet digitization, and IoT infrastructure—can be a barrier for smaller operators or municipalities, particularly in developing regions. While the cost of digital integration is gradually decreasing, the perceived premium for adopting comprehensive MaaS solutions can still hinder widespread deployment, especially where traditional transport infrastructure is still dominant.
- Overcoming these challenges through enhanced cybersecurity, government support, consumer education on data privacy, and scalable, cost-effective platform solutions will be vital for sustained market growth in the Asia-Pacific MaaS sector.
Asia-Pacific Mobility as a Service Market Scope
The mobility as a service market is segmented on the basis of service type, solution, transportation type, vehicle type, application platform, requirement type, organization size and usage.
- By Service Type
On the basis of service type, the Asia-Pacific Mobility as a Service Market is segmented into car sharing, bus sharing, train, ride hailing, bicycle sharing, self-driving cars, and others. The ride hailing segment dominated the market with the largest revenue share of 42.5% in 2025, driven by the widespread adoption of app-based taxi services, convenience of door-to-door transport, and integration with multi-modal MaaS platforms. Ride hailing services offer real-time booking, dynamic pricing, and route optimization, making them highly attractive for urban commuters.
The bicycle sharing segment is anticipated to witness the fastest CAGR of 23.1% from 2026 to 2033, fueled by growing environmental awareness, increasing government initiatives for sustainable urban mobility, and the expansion of dockless and e-bike sharing systems in metropolitan areas. The combination of affordability, last-mile connectivity, and health benefits is driving rapid adoption of bicycle sharing across cities in Asia-Pacific.
- By Solution
On the basis of solution, the Asia-Pacific Mobility as a Service Market is segmented into navigation solutions, ticketing solutions, technology platforms, insurance services, telecom connectivity providers, and payment engines. The technology platforms segment dominated the market with the largest revenue share of 45.3% in 2025, owing to their role as central hubs integrating multiple mobility services, enabling route planning, fare calculation, and user management. These platforms facilitate seamless multi-modal transport experiences and allow transport operators to manage fleets efficiently.
The ticketing solutions segment is expected to witness the fastest CAGR of 21.8% from 2026 to 2033, driven by the growing adoption of contactless payments, QR-based ticketing, and mobile-based fare collection systems. Increasing urban transit modernization projects and the push for cashless transactions are accelerating the implementation of advanced ticketing solutions across public and private transport networks.
- By Transportation Type
On the basis of transportation type, the Asia-Pacific Mobility as a Service Market is segmented into public and private transportation. The public transportation segment dominated the market with a revenue share of 50.2% in 2025, supported by high commuter volumes in densely populated cities, government investments in smart transit solutions, and the integration of buses, trains, and metros into MaaS platforms. Public transportation services offer cost-effective and sustainable solutions, particularly for daily commuters and inter-city travelers.
The private transportation segment is projected to witness the fastest CAGR of 22.4% from 2026 to 2033, driven by the increasing preference for personalized and flexible travel options, including car rentals, ride-hailing, and self-driving vehicles. Growth in disposable income and smartphone adoption is further enabling the convenience-driven uptake of private mobility services.
- By Vehicle Type
On the basis of vehicle type, the Asia-Pacific Mobility as a Service Market is segmented into four-wheelers, buses, trains, and micro-mobility vehicles. The four-wheelers segment dominated the market with a revenue share of 46.7% in 2025, attributed to the extensive use of cars for ride-hailing, car-sharing, and taxi services in urban areas. Four-wheelers provide convenience, privacy, and speed, making them the preferred mode for intra-city travel.
The micro-mobility segment (e-bikes, scooters) is expected to witness the fastest CAGR of 24.0% from 2026 to 2033, driven by short-distance commuting needs, traffic congestion, and supportive government initiatives promoting sustainable and eco-friendly transport solutions. Urban populations increasingly rely on micro-mobility options for last-mile connectivity, boosting adoption across smart city networks.
- By Application Platform
On the basis of application platform, the Asia-Pacific Mobility as a Service Market is segmented into iOS, Android, and others. The Android segment dominated the market with a revenue share of 57.8% in 2025, due to its higher market penetration across Asia-Pacific, widespread affordability of Android smartphones, and integration with MaaS apps offering ride booking, payment, and real-time tracking.
The iOS segment is expected to witness the fastest CAGR of 19.5% from 2026 to 2033, driven by premium users, high adoption of mobile payment services, and the seamless compatibility of iOS apps with Apple ecosystem services. Mobile app platforms remain central to user engagement, enabling frictionless access to multi-modal transport services.
- By Requirement Type
On the basis of requirement type, the Asia-Pacific Mobility as a Service Market is segmented into first- and last-mile connectivity, off-peak and shift work commute, daily commuter, airport or mass transit station trips, inter-city trips, and others. The daily commuter segment dominated the market with a revenue share of 48.9% in 2025, supported by high urban population densities, regular commuting patterns, and the integration of MaaS platforms with metro, bus, and ride-hailing services.
The first- and last-mile connectivity segment is projected to witness the fastest CAGR of 22.7% from 2026 to 2033, driven by demand for seamless connections between public transit hubs and residential or workplace locations. The growth of micro-mobility and bike-sharing services is accelerating adoption for short-distance transit.
- By Organization Size
On the basis of organization size, the Asia-Pacific Mobility as a Service Market is segmented into large enterprises and small- and medium-sized enterprises (SMEs). The large enterprises segment dominated the market with a revenue share of 54.1% in 2025, owing to their capacity to invest in customized MaaS solutions for employee transport, fleet management, and centralized mobility planning. Enterprises benefit from reduced operational costs, real-time monitoring, and scalable multi-modal solutions.
The SME segment is expected to witness the fastest CAGR of 20.8% from 2026 to 2033, as SMEs increasingly adopt MaaS platforms for employee commute solutions and cost-efficient access to shared mobility services, leveraging app-based booking and payment systems.
- By Usage
On the basis of usage, the Asia-Pacific Mobility as a Service Market is segmented into commercial and personal. The personal usage segment dominated the market with a revenue share of 51.5% in 2025, driven by rising urban populations, smartphone penetration, and preference for on-demand mobility solutions like ride-hailing and car-sharing. Consumers increasingly rely on MaaS apps for convenience, cost efficiency, and multi-modal travel planning.
The commercial usage segment is projected to witness the fastest CAGR of 21.9% from 2026 to 2033, driven by demand from logistics companies, corporate transportation services, and delivery fleets. Integration of MaaS platforms with enterprise mobility solutions ensures optimized routes, reduced downtime, and lower operational costs for businesses.
Asia-Pacific Mobility as a Service Market Regional Analysis
- China dominated the Asia-Pacific Mobility as a Service Market with the largest revenue share of 34.4% in 2025, driven by rapid urbanization, increasing smartphone penetration, and the rising adoption of integrated mobility solutions across metropolitan areas.
- Consumers in the region highly value the convenience, cost-effectiveness, and seamless integration offered by MaaS platforms, which combine ride-hailing, car-sharing, micro-mobility, and public transport services through a single digital interface.
- This widespread adoption is further supported by government initiatives promoting smart cities, growing investments in public transport infrastructure, and rising disposable incomes, establishing MaaS as a preferred solution for both personal commuting and commercial transportation needs.
China Asia-Pacific Mobility as a Service Market Insight
The China MaaS market accounted for the largest revenue share in the Asia-Pacific region in 2025, driven by rapid urbanization, growing smartphone penetration, and a strong government push for smart city initiatives. Consumers increasingly prefer integrated mobility solutions, including ride-hailing, bike-sharing, and public transportation services, accessible through mobile apps. The expansion of digital payment infrastructure and the development of AI-based traffic management systems further support MaaS adoption. Additionally, China’s domestic technology providers are innovating with data-driven platforms and seamless multimodal transport solutions, making MaaS both convenient and cost-effective for personal and commercial use.
Japan Asia-Pacific Mobility as a Service Market Insight
The Japan MaaS market is witnessing significant growth due to the country’s advanced public transport network, high smartphone adoption, and strong focus on urban mobility solutions. Consumers value the convenience of centralized platforms that integrate trains, buses, taxis, and micro-mobility options. The aging population and the need for efficient first- and last-mile connectivity are driving adoption in both urban and suburban areas. Government initiatives promoting digital ticketing, smart transport cards, and real-time traffic information also support the expansion of MaaS services across the country.
India Asia-Pacific Mobility as a Service Market Insight
The India MaaS market is expected to grow at the fastest CAGR during the forecast period, fueled by rapid urbanization, rising disposable incomes, and increasing smartphone penetration. The adoption of ride-hailing, car-sharing, and micro-mobility platforms is accelerating in metropolitan cities like Mumbai, Delhi, and Bangalore. Government policies promoting smart cities, digital payments, and sustainable transportation are further catalyzing growth. The country’s large population and increasing traffic congestion drive demand for convenient, affordable, and integrated mobility solutions, making MaaS an attractive option for daily commuting and inter-city travel.
South Korea Asia-Pacific Mobility as a Service Market Insight
The South Korea MaaS market is growing steadily due to the country’s technologically advanced infrastructure, high urban population density, and extensive public transportation network. Consumers increasingly prefer integrated mobility solutions that combine buses, subways, ride-hailing, and bike-sharing through digital platforms. Government support for smart city projects and investments in IoT and AI-based transport optimization enhance the efficiency and adoption of MaaS services. Additionally, South Korea’s tech-savvy population and strong digital payment ecosystem contribute to the market’s growth, making MaaS a convenient and reliable choice for both personal and corporate commuting.
Asia-Pacific Mobility as a Service Market Share
The Mobility as a Service industry is primarily led by well-established companies, including:
- Grab Holdings Ltd. (Singapore)
- Didi Chuxing (China)
- Uber Technologies Inc. (U.S.)
- Lyft, Inc. (U.S.)
- Moovit (Israel)
- Yandex.Taxi (Russia)
- Ola Cabs (India)
- Careem (U.A.E.)
- 99 (Brazil)
- Bolt (Estonia)
- DiDi Mobility (China)
- Tata Mobility Services (India)
- Keolis (France)
- Via Transportation (U.S.)
- Toyota Mobility Foundation (Japan)
- BMW ReachNow (Germany)
- Hyundai Mobility (South Korea)
- MaaS Global (Finland)
- GrabBike (Singapore)
- Ofo (China)
What are the Recent Developments in Asia-Pacific Mobility as a Service Market?
- In April 2024, Grab Holdings Ltd., a leading ride-hailing and digital mobility provider, expanded its MaaS offerings in Southeast Asia by integrating multi-modal transportation options, including bus, train, and micro-mobility services, into a single digital platform. This initiative emphasizes Grab’s commitment to providing seamless urban mobility solutions while addressing congestion and environmental concerns. By leveraging its established user base and technology infrastructure, Grab is strengthening its position in the rapidly growing Asia-Pacific Mobility as a Service Market.
- In March 2024, Didi Chuxing launched an AI-powered route optimization and ride-pooling solution across key cities in China, aimed at reducing travel time and carbon emissions while enhancing the efficiency of its ride-hailing services. This innovation underscores Didi’s dedication to smart urban mobility solutions and its focus on integrating advanced technologies to improve commuter experience and support sustainable transportation initiatives.
- In March 2024, Toyota Mobility Foundation introduced its MaaS Pilot Project in Bengaluru, India, providing connected mobility services that combine public transport, ride-hailing, and car-sharing options. The project highlights Toyota’s efforts to enhance urban transportation systems through smart solutions, contributing to safer, more reliable, and accessible mobility for city residents.
- In February 2024, Moovit, an Intel company, partnered with major public transit authorities in Australia to integrate real-time transit data into its MaaS platform, enabling commuters to plan seamless journeys across buses, trains, and ride-sharing services. This collaboration demonstrates Moovit’s commitment to improving urban mobility through digital solutions that enhance efficiency, accessibility, and commuter satisfaction.
- In January 2024, Uber Technologies Inc. introduced its MaaS API for corporate clients across Asia-Pacific, allowing businesses to manage employee transportation needs with integrated ride-hailing, shuttle, and micro-mobility services. The launch reflects Uber’s focus on providing flexible, cost-effective, and sustainable mobility solutions, reinforcing its leadership in the Asia-Pacific Mobility as a Service Market.
SKU-

- Interactive Data Analysis Dashboard
- Company Analysis Dashboard for high growth potential opportunities
- Research Analyst Access for customization & queries
- Competitor Analysis with Interactive dashboard
- Latest News, Updates & Trend analysis
- Harness the Power of Benchmark Analysis for Comprehensive Competitor Tracking
Data collection and base year analysis are done using data collection modules with large sample sizes. The stage includes obtaining market information or related data through various sources and strategies. It includes examining and planning all the data acquired from the past in advance. It likewise envelops the examination of information inconsistencies seen across different information sources. The market data is analysed and estimated using market statistical and coherent models. Also, market share analysis and key trend analysis are the major success factors in the market report. To know more, please request an analyst call or drop down your inquiry.
The key research methodology used by DBMR research team is data triangulation which involves data mining, analysis of the impact of data variables on the market and primary (industry expert) validation. Data models include Vendor Positioning Grid, Market Time Line Analysis, Market Overview and Guide, Company Positioning Grid, Patent Analysis, Pricing Analysis, Company Market Share Analysis, Standards of Measurement, Global versus Regional and Vendor Share Analysis. To know more about the research methodology, drop in an inquiry to speak to our industry experts.
Data Bridge Market Research is a leader in advanced formative research. We take pride in servicing our existing and new customers with data and analysis that match and suits their goal. The report can be customized to include price trend analysis of target brands understanding the market for additional countries (ask for the list of countries), clinical trial results data, literature review, refurbished market and product base analysis. Market analysis of target competitors can be analyzed from technology-based analysis to market portfolio strategies. We can add as many competitors that you require data about in the format and data style you are looking for. Our team of analysts can also provide you data in crude raw excel files pivot tables (Fact book) or can assist you in creating presentations from the data sets available in the report.


