
Asia Pacific Multiple Hereditary Exostosis Market
Market Size in USD Million
 USD
22.90 Million
USD
33.33 Million
2024
2032
USD
22.90 Million
USD
33.33 Million
2024
2032
| 2025 - 2032 | |
| USD 22.90 Million | |
| USD 33.33 Million | |
| % | |
|
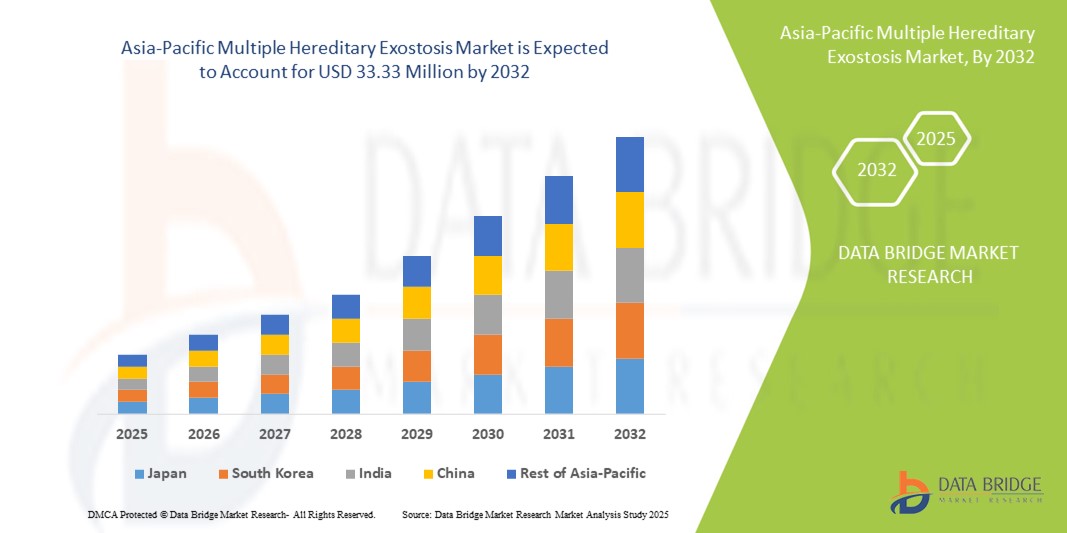
Asia-Pacific Multiple Hereditary Exostosis Market Size
- The Asia-Pacific multiple hereditary exostosis market size was valued at USD 22.90 million in 2024 and is expected to reach USD 33.33 million by 2032, at a CAGR of 4.80% during the forecast period
- The market growth is largely driven by rising awareness and early diagnosis of rare genetic disorders, improved access to specialized healthcare, and increasing genetic screening programs across emerging economies in the region
- Furthermore, growing investments in precision medicine, supportive government initiatives, and an expanding pediatric patient population are fostering greater demand for advanced treatment options. These converging factors are accelerating the uptake of diagnostic and therapeutic solutions, thereby significantly boosting the industry's growth
Asia-Pacific Multiple Hereditary Exostosis Market Analysis
- Multiple hereditary exostosis (MHE), a rare genetic disorder characterized by benign bone tumors, is gaining increasing clinical attention in the Asia-Pacific region due to rising awareness, improved diagnostic capabilities, and growing access to specialized orthopedic and genetic services in urban centers
- The escalating demand for early diagnosis and advanced therapeutic interventions is primarily fueled by improved healthcare infrastructure, government support for rare disease management, and the expansion of genetic screening programs in countries such as China, Japan, and India
- China dominated the Asia-Pacific multiple hereditary exostosis market with the largest revenue share of 39.9% in 2024, supported by a growing pediatric patient population, advancements in genomic medicine, and the presence of regional centers of excellence focusing on skeletal dysplasias
- India is expected to be the fastest-growing country in the Asia-Pacific multiple hereditary exostosis market during the forecast period, driven by enhanced rare disease policies, expanding clinical trial activity, and the growing role of patient advocacy organizations
- Sessile segment dominated the Asia-Pacific multiple hereditary exostosis market with a market share of 59.1% in 2024, driven by its higher prevalence near joints and increased such likelihood of causing nerve compression, prompting earlier clinical detection and intervention
Report Scope and Asia-Pacific Multiple Hereditary Exostosis Market Segmentation
|
Attributes |
Asia-Pacific Multiple Hereditary Exostosis Key Market Insights |
|
Segments Covered |
|
|
Countries Covered |
Asia-Pacific
|
|
Key Market Players |
|
|
Market Opportunities |
|
|
Value Added Data Infosets |
In addition to the insights on market scenarios such as market value, growth rate, segmentation, geographical coverage, and major players, the market reports curated by the Data Bridge Market Research also include in-depth expert analysis, pricing analysis, brand share analysis, consumer survey, demography analysis, supply chain analysis, value chain analysis, raw material/consumables overview, vendor selection criteria, PESTLE Analysis, Porter Analysis, and regulatory framework. |
Asia-Pacific Multiple Hereditary Exostosis Market Trends
“Advancements in Genetic Diagnostics and Personalized Treatment Approaches”
- A significant and accelerating trend in the Asia-Pacific multiple hereditary exostosis (MHE) market is the growing integration of advanced genetic diagnostic tools and the emergence of personalized treatment protocols tailored to the specific needs of pediatric patients with skeletal dysplasias. This trend is improving early detection and enabling targeted intervention strategies
- For instance, next-generation sequencing (NGS) technologies are increasingly used in countries such as Japan and China to identify EXT1 and EXT2 gene mutations, allowing clinicians to diagnose MHE early and accurately. Genetic counseling is also becoming a common practice in specialized orthopedic and pediatric clinics
- The rising adoption of non-invasive imaging techniques, such as low-radiation CT and high-resolution MRI, enables better monitoring of exostoses progression and helps in surgical planning. Coupled with AI-powered radiological analysis, these tools offer more precise lesion tracking and treatment customization
- These diagnostic advancements, along with greater public health awareness campaigns and screening programs in urban centers, are fostering a shift toward proactive management of the disease rather than reactive surgical intervention only after complications arise
- Patient registries and cross-border collaborations are increasing across the region, with countries such as South Korea and Australia participating in rare disease networks that facilitate clinical research and data sharing on MHE. These initiatives help generate region-specific epidemiological insights and promote evidence-based care
- This growing focus on early-stage identification and personalized care is transforming the landscape of MHE treatment in Asia-Pacific, creating a platform for medical innovation and the delivery of patient-centric orthopedic solutions
Asia-Pacific Multiple Hereditary Exostosis Market Dynamics
Driver
“Rising Early Diagnosis and Expansion of Pediatric Orthopedic Services”
- The increasing availability of specialized pediatric orthopedic care and diagnostic infrastructure in major Asia-Pacific economies is a significant driver for the growth of the MHE market. Early detection through genetic screening and improved access to advanced imaging have enabled earlier interventions and better disease outcomes
- For instance, government-led initiatives in India and China to include rare diseases in national health programs have led to the integration of MHE in diagnostic panels at tertiary hospitals, resulting in higher case identification rates. National rare disease registries are also being developed to monitor long-term outcomes
- As awareness spreads among clinicians and families, demand for surgical correction of deformities and pain management services has grown, particularly in pediatric-focused hospitals and orthopedic centers. Robotic-assisted surgical platforms and 3D printing for bone modeling are increasingly being deployed for precise resection of exostoses
- The emergence of rare disease support organizations in the region is also helping patients and families access resources, pushing for better care protocols, and connecting them with specialist providers. These efforts are fostering early engagement and comprehensive treatment of the condition
Restraint/Challenge
“Low Awareness in Rural Areas and Limited Access to Specialized Treatment”
- Despite advances in urban healthcare hubs, limited awareness of MHE among general practitioners and low availability of genetic diagnostic facilities in rural or remote regions remain key barriers to widespread market penetration. Many cases go undiagnosed or are misdiagnosed due to the rarity and complex presentation of the condition
- In countries with less robust healthcare infrastructure, such as parts of Southeast Asia, patients may face delays in accessing orthopedic specialists or may lack the financial means for genetic testing and follow-up imaging, resulting in under-treatment or avoidable complications
- Furthermore, the lack of standardized treatment guidelines and fragmented referral systems makes it challenging for affected individuals to receive multidisciplinary care. While initiatives to improve rare disease policy frameworks are underway in several Asia-Pacific countries, implementation remains uneven
- To overcome these challenges, increased investment in rural healthcare, telemedicine platforms for orthopedic consults, subsidized genetic screening programs, and clinician training on rare diseases are essential. Partnerships between governments, NGOs, and medical institutions will be vital to bridging the access gap and ensuring equitable care for MHE patients across the region
Asia-Pacific Multiple Hereditary Exostosis Market Scope
The market is segmented on the basis of type, treatment, diagnosis, site, age group, and end user
- By Type
On the basis of type, the Asia-Pacific multiple hereditary exostosis market is segmented into sessile and pedunculated. The sessile segment dominated the market with the largest revenue share of 59.1% in 2024, driven by its greater clinical visibility due to its broad base and proximity to vital structures such as nerves and joints. These features often lead to earlier symptom presentation, higher rates of diagnosis, and a greater need for surgical intervention. Sessile lesions are also more frequently associated with functional impairment and deformity, prompting prompt orthopedic evaluation.
The pedunculated segment is expected to grow at with the fastest pace through 2032, supported by improved imaging capabilities that allow better detection of long-stalked exostoses and the rising use of non-invasive monitoring techniques. As awareness increases and radiologic tools become more accessible in outpatient settings, detection rates of less symptomatic pedunculated lesions are also such asly to rise.
- By Treatment
On the basis of treatment, the Asia-Pacific multiple hereditary exostosis market is segmented into surgery, medication, and others. The surgery segment held the largest market share of 46.7% in 2024, due to its critical role in managing complications such as nerve compression, limb deformities, or restricted joint motion. Pediatric patients often undergo surgical resection of exostoses to prevent growth abnormalities or chronic pain. The availability of skilled orthopedic surgeons and advanced tools such as robotic-assisted surgery and 3D modeling in countries such as Japan, China, and South Korea supports this segment’s growth.
The medication segment is expected to witness the fastest CAGR from 2025 to 2032, largely in support of post-operative pain management and inflammation control. There is also growing clinical interest in targeted therapies aimed at reducing exostosis growth, though such options remain largely in the research phase.
- By Diagnosis
On the basis of diagnosis, the Asia-Pacific multiple hereditary exostosis market is segmented into X-ray, computed tomography (CT) scan, magnetic resonance imaging (MRI), genetic tests, and others. X-ray dominated the diagnosis segment with the largest share of 34.2% in 2024, owing to its cost-effectiveness, widespread availability, and efficiency in identifying the bony growths characteristic of MHE. It remains the first-line imaging tool in most clinical settings.
Genetic testing is anticipated to grow at the fastest rate through 2032 due to its role in confirming hereditary patterns through EXT1 and EXT2 gene analysis. With rising awareness and access to next-generation sequencing (NGS), particularly in urban medical centers, genetic testing is becoming essential for early diagnosis and family counseling.
- By Site
On the basis of lesion location, the Asia-Pacific multiple hereditary exostosis market is segmented into legs, arms, shoulders, pelvis, fingers, and toes. The legs segment accounted for the highest share of 36.9% in 2024, due to the common occurrence of exostoses near the femur, tibia, and fibula—areas prone to mechanical stress and growth disturbances in children. These lesions often require orthopedic evaluation and corrective surgery due to gait abnormalities or limb-length discrepancies.
Arms and shoulders is expected to witness fastest growth during forecast period, as common anatomical sites, especially in pediatric populations, where deformities can interfere with normal function and range of motion.
- By Age Group
On the basis of age group, the Asia-Pacific multiple hereditary exostosis market is segmented into pediatric and adult. The pediatric segment dominated the market with a share of 72.1% in 2024, as MHE is typically diagnosed in early childhood when bone growth is active and symptoms such as visible bumps, joint restriction, or limb deformities begin to manifest.
While adult cases is expected to witness the fastest CAGR from 2025 to 2032, especially due to delayed diagnoses or recurrence, the majority of interventions, screenings, and surgeries occur during childhood and adolescence.
- By End User
On the basis of end user, the Asia-Pacific multiple hereditary exostosis market is segmented into hospitals, specialty clinics, ambulatory surgical centers, and others. Hospitals led the segment with the largest share of 48.3% in 2024, owing to their comprehensive diagnostic and surgical capabilities, including orthopedic surgery, radiology, and genetic counseling under one roof. Pediatric hospitals and university-affiliated medical centers in countries such as China, Japan, and India are primary centers for MHE diagnosis and treatment.
Ambulatory surgical centers are expected to show strong growth during forecast period, due to increasing preference for minimally invasive procedures and day-care surgeries.
Asia-Pacific Multiple Hereditary Exostosis Market Regional Analysis
- China dominated the Asia-Pacific multiple hereditary exostosis market with the largest revenue share of 39.9% in 2024, supported by a growing pediatric patient population, advancements in genomic medicine, and the presence of regional centers of excellence focusing on skeletal dysplasias
- Patients and clinicians in China and other countries such as Japan and India are actively adopting early intervention strategies, advanced surgical techniques, and personalized care plans, leading to better patient outcomes and an expanding market
- This growth is further fueled by national rare disease policies, public–private partnerships in healthcare, and ongoing research collaborations, making Asia-Pacific a leading region for innovation and clinical progress in MHE diagnosis and treatment
The China Multiple Hereditary Exostosis Market Insight
China multiple hereditary exostosis market captured the largest revenue share of 39.9% in the Asia-Pacific MHE market in 2024, fueled by its large pediatric population, growing adoption of advanced imaging technologies, and expanding access to genetic testing in urban hospitals. National rare disease strategies, along with increased investment in genomic medicine, are supporting early-stage diagnosis and management of hereditary skeletal disorders. The presence of government-backed screening programs and specialist orthopedic centers continues to drive market growth.
Japan Multiple Hereditary Exostosis Market Insight
The Japan multiple hereditary exostosis market is experiencing notable growth, supported by the country’s advanced healthcare infrastructure and emphasis on precision medicine. The integration of genetic testing into standard diagnostic pathways, combined with Japan's proactive rare disease policy framework, is enabling more accurate and earlier detection of MHE. In addiion, strong collaboration between research institutes and healthcare providers is contributing to improved treatment protocols and patient outcomes.
India Multiple Hereditary Exostosis Market Insight
India multiple hereditary exostosis market holds a substantial share of the Asia-Pacific MHE market in 2024, driven by the increasing availability of orthopedic specialists, improved diagnostic tools in tertiary hospitals, and rising public awareness. Government initiatives aimed at rare disease identification, including the National Policy for Rare Diseases, are enabling better access to early diagnosis and surgical treatment. The presence of large pediatric demographics and expanding healthcare infrastructure in urban centers further supports market growth.
Asia-Pacific Multiple Hereditary Exostosis Market Share
The Asia-Pacific Multiple Hereditary Exostosis industry is primarily led by well-established companies, including:
- Illumina, Inc. (U.S.)
- Medtronic (Ireland)
- Zimmer Biomet Holdings, Inc. (U.S.)
- Stryker (U.S.)
- Siemens Healthineers AG (Germany)
- GE HealthCare Technologies Inc. (U.S.)
- Canon Medical Systems Corporation (Japan)
- Esaote S.p.A. (Italy)
- Thermo Fisher Scientific Inc. (U.S.)
- Roche Holding AG (Switzerland)
- Koninklijke Philips N.V. (Netherlands)
- B. Braun Melsungen AG (Germany)
- Agilent Technologies, Inc. (U.S.)
- PerkinElmer Inc. (U.S.)
- FUJIFILM Corporation (Japan)
- Beijing Genomics Institute (BGI Genomics) (China)
- Shenzhen Mindray Bio-Medical Electronics Co., Ltd. (China)
- Jiangsu Trautec Medical Technology Co., Ltd. (China)
- Toshiba Corporation (Japan)
- Takara Bio Inc. (Japan)
What are the Recent Developments in Asia-Pacific Multiple Hereditary Exostosis Market?
- In May 2024, the Chinese Ministry of Health expanded its national rare disease registry to include multiple hereditary exostosis (MHE), aiming to improve early diagnosis, treatment access, and long-term monitoring of patients across major provinces. This initiative reflects China’s strategic investment in rare disease management and its commitment to utilizing centralized data systems for personalized patient care and improved clinical outcomes
- In March 2024, Japan’s National Center for Child Health and Development launched a collaborative research project focusing on gene editing therapies targeting EXT1 and EXT2 mutations in MHE. The initiative involves leading universities and biotech firms, marking a significant advancement in precision medicine and gene therapy innovation for rare skeletal disorders in the country
- In February 2024, the Indian Council of Medical Research (ICMR) approved funding for a nationwide pilot program focused on genetic screening of pediatric patients suspected of skeletal dysplasias, including MHE. The program is designed to enhance early-stage diagnosis, build diagnostic capacity in public hospitals, and support families through genetic counseling services
- In January 2024, South Korea’s Seoul National University Hospital began clinical trials on AI-assisted imaging algorithms to improve the accuracy of MHE diagnosis through MRI and CT scan interpretation. This development highlights South Korea’s push toward integrating artificial intelligence into orthopedic diagnostics, enhancing efficiency and reducing diagnostic delays
- In December 2023, the Australian Rare Disease Network (ARDN) announced a partnership with multiple children’s hospitals to standardize treatment protocols for MHE and other bone disorders. The collaboration includes training modules for healthcare providers and the development of a centralized digital patient registry to facilitate research, clinical decision-making, and policy formulation
SKU-

- Interactive Data Analysis Dashboard
- Company Analysis Dashboard for high growth potential opportunities
- Research Analyst Access for customization & queries
- Competitor Analysis with Interactive dashboard
- Latest News, Updates & Trend analysis
- Harness the Power of Benchmark Analysis for Comprehensive Competitor Tracking
Table of Content
1 INTRODUCTION
1.1 OBJECTIVES OF THE STUDY
1.2 MARKET DEFINITION
1.3 OVERVIEW OF THE ASIA-PACIFIC MULTIPLE HEREDITARY EXOSTOSIS MARKET
1.4 CURRENCY AND PRICING
1.5 LIMITATIONS
1.6 MARKETS COVERED
2 MARKET SEGMENTATION
2.1 MARKETS COVERED
2.2 GEOGRAPHICAL SCOPE
2.3 YEARS CONSIDERED FOR THE STUDY
2.4 DBMR TRIPOD DATA VALIDATION MODEL
2.5 PRIMARY INTERVIEWS WITH KEY OPINION LEADERS
2.6 MULTIVARIATE MODELLING
2.7 MARKET END USER COVERAGE GRID
2.8 PRODUCT LIFELINE CURVE
2.9 DBMR MARKET POSITION GRID
2.1 VENDOR SHARE ANALYSIS
2.11 SECONDARY SOURCES
2.12 ASSUMPTIONS
3 EXECUTIVE SUMMARY
4 PREMIUM INSIGHTS
4.1 PORTER’S FIVE FORCES
4.2 PESTEL ANALYSIS
4.3 PIPELINE ANALYSIS - OBSERVATORY DATA
4.4 EPIDEMIOLOGY
5 ASIA-PACIFIC MULTIPLE HEREDITARY EXOSTOSIS MARKET: REGULATIONS
5.1 REGULATION IN UNITED STATES: U.S. FOOD AND DRUG ADMINISTRATION (FDA)
5.1.1 REGULATION IN EUROPE: EUROPEAN MEDICINES AGENCY (EMA)
5.2 REGULATION IN ASIA-PACIFIC (JAPAN): PHARMACEUTICAL AND MEDICAL DEVICES AGENCY (PMDA)
5.3 MEDICAL DEVICE STANDARDS
6 MARKET OVERVIEW
6.1 DRIVERS
6.1.1 RISING PREVALENCE OF GENETIC DISORDERS
6.1.2 GROWING PEDIATRIC POPULATION
6.1.3 DEVELOPMENT OF NOVEL THERAPIES
6.2 RESTRAINTS
6.2.1 HIGH COST OF ADVANCED THERAPIES
6.2.2 LIMITED AVAILABILITY OF THERAPIES
6.3 OPPORTUNITIES
6.3.1 INCREASE IN PATIENT CARE AND SUPPORT SYSTEMS
6.3.2 INCREASE IN THE NUMBER OF COLLABORATIONS AND PARTNERSHIPS
6.4 CHALLENGES
6.4.1 LIMITED AWARENESS ABOUT THE DISORDER
6.4.2 LACK OF DRUG APPROVALS ASSOCIATED WITH THE DISORDER
7 ASIA-PACIFIC MULTIPLE HEREDITARY EXOSTOSIS MARKET, BY TYPE
7.1 OVERVIEW
7.2 SESSILE
7.3 PEDUNCULATED
8 ASIA-PACIFIC MULTIPLE HEREDITARY EXOSTOSIS MARKET, BY TREATMENT
8.1 OVERVIEW
8.2 SURGERY
8.2.1 REMOVE THE TUMOR
8.2.2 LENGTHEN LIMBS
8.3 MEDICATION
8.3.1 HOSPITAL PHARMACIES
8.3.2 DRUGS STORES AND RETAIL PHARMACIES
8.3.3 ONLINE PHARMACIES
8.4 OTHERS
9 ASIA-PACIFIC MULTIPLE HEREDITARY EXOSTOSIS MARKET, BY DIAGNOSIS
9.1 OVERVIEW
9.2 X-RAY
9.2.1 SESSILE
9.2.2 PEDUNCULATED
9.3 COMPUTED TOMOGRAPHY (CT) SCAN
9.3.1 SESSILE
9.3.2 PEDUNCULATED
9.4 MAGNETIC RESONANCE IMAGING (MRI)
9.4.1 SESSILE
9.4.2 PEDUNCULATED
9.5 GENETIC TESTS
9.5.1 SESSILE
9.5.2 PEDUNCULATED
9.6 OTHERS
9.6.1 SESSILE
9.6.2 PEDUNCULATED
10 ASIA-PACIFIC MULTIPLE HEREDITARY EXOSTOSIS MARKET, BY SITE
10.1 OVERVIEW
10.2 LEGS
10.3 ARMS
10.4 SHOULDERS
10.5 PELVIS
10.6 FINGERS
10.7 TOES
11 ASIA-PACIFIC MULTIPLE HEREDITARY EXOSTOSIS MARKET, BY AGE GROUP
11.1 OVERVIEW
11.2 PEDIATRIC
11.3 ADULT
12 ASIA-PACIFIC MULTIPLE HEREDITARY EXOSTOSIS MARKET, BY END USER
12.1 OVERVIEW
12.2 HOSPITAL
12.2.1 PRIVATE
12.2.2 GOVERNMENT
12.3 SPECIALTY CLINICS
12.4 AMBULATORY SURGICAL CENTERS
12.5 OTHERS
13 ASIA-PACIFIC MULTIPLE HEREDITY EXOSTOSIS MARKET, BY REGION
13.1 ASIA-PACIFIC
13.1.1 CHINA
13.1.2 JAPAN
13.1.3 INDIA
13.1.4 AUSTRALIA
13.1.5 SOUTH KOREA
13.1.6 INDONESIA
13.1.7 NEW ZEALAND
13.1.8 MALAYSIA
13.1.9 THAILAND
13.1.10 TAIWAN
13.1.11 SINGAPORE
13.1.12 PHILIPPINES
13.1.13 VIETNAM
13.1.14 REST OF ASIA-PACIFIC
14 ASIA-PACIFIC MULTIPLE HEREDITARY EXOSTOSIS MARKET: COMPANY LANDSCAPE
14.1 COMPANY SHARE ANALYSIS: ASIA-PACIFIC
15 SWOT ANALYSIS
16 COMPANY PROFILES
16.1 BAYERS AG
16.1.1 COMPANY SNAPSHOT
16.1.2 REVENUE ANALYSIS
16.1.3 COMPANY SHARE ANALYSIS
16.1.4 PRODUCT PORTFOLIO
16.1.5 RECENT UPDATES
16.2 HALEON GROUP OF COMPANIES
16.2.1 COMPANY SNAPSHOT
16.2.2 REVENUE ANALYSIS
16.2.3 COMPANY SHARE ANALYSIS
16.2.4 PRODUCT PORTFOLIO
16.2.5 RECENT DEVELOPMENTS
16.3 BASF
16.3.1 COMPANY SNAPSHOT
16.3.2 REVENUE ANALYSIS
16.3.3 COMPANY SHARE ANALYSIS
16.3.4 PRODUCT PORTFOLIO
16.3.5 RECENT UPDATES
16.4 VIATRIS INC.
16.4.1 COMPANY SNAPSHOT
16.4.2 REVENUE ANALYSIS
16.4.3 COMPANY SHARE ANALYSIS
16.4.4 PRODUCT PORTFOLIO
16.4.5 RECENT UPDATES
16.5 ACTIZAPHARMA
16.5.1 COMPANY SNAPSHOT
16.5.2 PRODUCT PORTFOLIO
16.5.3 RECENT UPDATES
16.6 ADVACARE PHARMA
16.6.1 COMPANY SNAPSHOT
16.6.2 PRODUCT PORTFOLIO
16.6.3 RECENT UPDATES
16.7 AUROBINDO PHARMA
16.7.1 COMPANY SNAPSHOT
16.7.2 REVENUE ANALYSIS
16.7.3 PRODUCT PORTFOLIO
16.7.4 RECENT TABLETS
16.8 HALEON GROUP OF COMPANIES
16.8.1 COMPANY SNAPSHOT
16.8.2 REVENUE ANALYSIS
16.8.3 PRODUCT PORTFOLIO
16.8.4 RECENT UPDATES
16.9 IPSEN BIOPHARMACEUTICALS, INC.
16.9.1 COMPANY SNAPSHOT
16.9.2 REVENUE ANALYSIS
16.9.3 PRODUCT PORTFOLIO
16.9.4 RECENT UPDATES
16.1 MALLINCKRODT
16.10.1 COMPANY SNAPSHOT
16.10.2 REVENUE ANALYSIS
16.10.3 PRODUCT PORTFOLIO
16.10.4 RECENT UPDATES
16.11 TEVA PHARMACEUTICAL INDUSTRIES LTD.
16.11.1 COMPANY SNAPSHOT
16.11.2 REVENUE ANALYSIS
16.11.3 PRODUCT PORTFOLIO
16.11.4 RECENT UPDATES
16.12 TAJ PHARMACEUTICALS LIMITED
16.12.1 COMPANY SNAPSHOT
16.12.2 PRODUCT PORTFOLIO
16.12.3 RECENT UPDATES
17 QUESTIONNAIRE
18 RELATED REPORTS
List of Table
TABLE 1 PIPELINE ANALYSIS - OBSERVATORY DATA
TABLE 2 PIPELINE ANALYSIS - INTERVENTIONAL DATA
TABLE 3 SALES DATA - 2024
TABLE 4 SALES DATA - 2023
TABLE 5 SALES DATA - 2022
TABLE 6 SALES DATA - 2021
TABLE 7 SALES DATA - 2020
TABLE 8 SALES DATA - 2019
TABLE 9 SALES DATA - 2018
TABLE 10 COST OF PALOVAROTENE
TABLE 11 ASIA-PACIFIC MULTIPLE HEREDITARY EXOSTOSIS MARKET, BY TYPE, 2022-2031 (USD THOUSAND)
TABLE 12 ASIA-PACIFIC SESSILE IN MULTIPLE HEREDITARY EXOSTOSIS MARKET, BY REGION, 2022-2031 (USD THOUSAND)
TABLE 13 ASIA-PACIFIC PEDUNCULATED IN MULTIPLE HEREDITARY EXOSTOSIS MARKET, BY REGION, 2022-2031 (USD THOUSAND)
TABLE 14 ASIA-PACIFIC MULTIPLE HEREDITARY EXOSTOSIS MARKET, BY TREATMENT, 2022-2031 (USD THOUSAND)
TABLE 15 ASIA-PACIFIC SURGERY IN MULTIPLE HEREDITARY EXOSTOSIS MARKET, BY REGION, 2022-2031 (USD THOUSAND)
TABLE 16 ASIA-PACIFIC SURGERY IN MULTIPLE HEREDITARY EXOSTOSIS MARKET, BY TYPE, 2022-2031 (USD THOUSAND)
TABLE 17 ASIA-PACIFIC MEDICATION IN MULTIPLE HEREDITARY EXOSTOSIS MARKET, BY REGION, 2022-2031 (USD THOUSAND)
TABLE 18 ASIA-PACIFIC MEDICATION IN MULTIPLE HEREDITARY EXOSTOSIS MARKET, BY DISTRIBUTION CHANNEL, 2022-2031 (USD THOUSAND)
TABLE 19 ASIA-PACIFIC MEDICATION IN MULTIPLE HEREDITARY EXOSTOSIS MARKET, BY REGION, 2022-2031 (USD THOUSAND)
TABLE 20 ASIA-PACIFIC MULTIPLE HEREDITARY EXOSTOSIS MARKET, BY DIAGNOSIS, 2022-2031 (USD THOUSAND)
TABLE 21 ASIA-PACIFIC X-RAY IN MULTIPLE HEREDITARY EXOSTOSIS MARKET, BY REGION, 2022-2031 (USD THOUSAND)
TABLE 22 ASIA-PACIFIC X-RAY IN MULTIPLE HEREDITARY EXOSTOSIS MARKET, BY TYPE, 2022-2031 (USD THOUSAND)
TABLE 23 ASIA-PACIFIC COMPUTED TOMOGRAPHY (CT) SCAN IN MULTIPLE HEREDITARY EXOSTOSIS MARKET, BY REGION, 2022-2031 (USD THOUSAND)
TABLE 24 ASIA-PACIFIC COMPUTED TOMOGRAPHY (CT) SCAN IN MULTIPLE HEREDITARY EXOSTOSIS MARKET, BY TYPE, 2022-2031 (USD THOUSAND)
TABLE 25 ASIA-PACIFIC MAGNETIC RESONANCE IMAGING (MRI) IN MULTIPLE HEREDITARY EXOSTOSIS MARKET, BY REGION, 2022-2031 (USD THOUSAND)
TABLE 26 ASIA-PACIFIC MAGNETIC RESONANCE IMAGING (MRI) IN MULTIPLE HEREDITARY EXOSTOSIS MARKET, BY TYPE, 2022-2031 (USD THOUSAND)
TABLE 27 ASIA-PACIFIC GENETIC TESTS IN MULTIPLE HEREDITARY EXOSTOSIS MARKET, BY REGION, 2022-2031 (USD THOUSAND)
TABLE 28 ASIA-PACIFIC GENETIC TESTS IN MULTIPLE HEREDITARY EXOSTOSIS MARKET, BY TYPE, 2022-2031 (USD THOUSAND)
TABLE 29 ASIA-PACIFIC OTHERS IN MULTIPLE HEREDITARY EXOSTOSIS MARKET, BY REGION, 2022-2031 (USD THOUSAND)
TABLE 30 ASIA-PACIFIC OTHERS IN MULTIPLE HEREDITARY EXOSTOSIS MARKET, BY TYPE, 2022-2031 (USD THOUSAND)
TABLE 31 ASIA-PACIFIC MULTIPLE HEREDITARY EXOSTOSIS MARKET, BY SITE, 2022-2031 (USD THOUSAND)
TABLE 32 ASIA-PACIFIC LEGS IN MULTIPLE HEREDITARY EXOSTOSIS MARKET, BY REGION, 2022-2031 (USD THOUSAND)
TABLE 33 ASIA-PACIFIC ARMS IN MULTIPLE HEREDITARY EXOSTOSIS MARKET, BY REGION, 2022-2031 (USD THOUSAND)
TABLE 34 ASIA-PACIFIC SHOULDERS IN MULTIPLE HEREDITARY EXOSTOSIS MARKET, BY REGION, 2022-2031 (USD THOUSAND)
TABLE 35 ASIA-PACIFIC PELVIS IN MULTIPLE HEREDITARY EXOSTOSIS MARKET, BY REGION, 2022-2031 (USD THOUSAND)
TABLE 36 ASIA-PACIFIC FINGERS IN MULTIPLE HEREDITARY EXOSTOSIS MARKET, BY REGION, 2022-2031 (USD THOUSAND)
TABLE 37 ASIA-PACIFIC TOES IN MULTIPLE HEREDITARY EXOSTOSIS MARKET, BY REGION, 2022-2031 (USD THOUSAND)
TABLE 38 ASIA-PACIFIC MULTIPLE HEREDITARY EXOSTOSIS MARKET, BY AGE GROUP, 2022-2031 (USD THOUSAND)
TABLE 39 ASIA-PACIFIC PEDIATRIC IN MULTIPLE HEREDITARY EXOSTOSIS MARKET, BY REGION, 2022-2031 (USD THOUSAND)
TABLE 40 ASIA-PACIFIC ADULT IN MULTIPLE HEREDITARY EXOSTOSIS MARKET, BY REGION, 2022-2031 (USD THOUSAND)
TABLE 41 ASIA-PACIFIC MULTIPLE HEREDITARY EXOSTOSIS MARKET, BY END USER, 2022-2031 (USD THOUSAND)
TABLE 42 ASIA-PACIFIC HOSPITAL IN MULTIPLE HEREDITARY EXOSTOSIS MARKET, BY REGION, 2022-2031 (USD THOUSAND)
TABLE 43 ASIA-PACIFIC HOSPITAL IN MULTIPLE HEREDITARY EXOSTOSIS MARKET, BY TYPE, 2022-2031 (USD THOUSAND)
TABLE 44 ASIA-PACIFIC SPECIALTY CLINICS IN MULTIPLE HEREDITARY EXOSTOSIS MARKET, BY REGION, 2022-2031 (USD THOUSAND)
TABLE 45 ASIA-PACIFIC AMBULATORY SURGICAL CENTERS IN MULTIPLE HEREDITARY EXOSTOSIS MARKET, BY REGION, 2022-2031 (USD THOUSAND)
TABLE 46 ASIA-PACIFIC OTHERS IN MULTIPLE HEREDITARY EXOSTOSIS MARKET, BY REGION, 2022-2031 (USD THOUSAND)
TABLE 47 ASIA-PACIFIC MULTIPLE HEREDITARY EXOSTOSIS MARKET, BY COUNTRY, 2022-2031 (USD THOUSAND)
TABLE 48 ASIA-PACIFIC MULTIPLE HEREDITARY EXOSTOSIS MARKET, BY TYPE, 2022-2031 (USD THOUSAND)
TABLE 49 ASIA-PACIFIC MULTIPLE HEREDITARY EXOSTOSIS MARKET, BY TREATMENT, 2022-2031 (USD THOUSAND)
TABLE 50 ASIA-PACIFIC SURGERY IN MULTIPLE HEREDITARY EXOSTOSIS MARKET, BY TYPE, 2022-2031 (USD THOUSAND)
TABLE 51 ASIA-PACIFIC MEDICATION IN MULTIPLE HEREDITARY EXOSTOSIS MARKET, BY DISTRIBUTION CHANNEL, 2022-2031 (USD THOUSAND)
TABLE 52 ASIA-PACIFIC MULTIPLE HEREDITARY EXOSTOSIS MARKET, BY DIAGNOSIS, 2022-2031 (USD THOUSAND)
TABLE 53 ASIA-PACIFIC X-RAY IN MULTIPLE HEREDITARY EXOSTOSIS MARKET, BY TYPE, 2022-2031 (USD THOUSAND)
TABLE 54 ASIA-PACIFIC COMPUTED TOMOGRAPHY (CT) SCAN IN MULTIPLE HEREDITARY EXOSTOSIS MARKET, BY TYPE, 2022-2031 (USD THOUSAND)
TABLE 55 ASIA-PACIFIC MAGNETIC RESONANCE IMAGING (MRI) IN MULTIPLE HEREDITARY EXOSTOSIS MARKET, BY TYPE, 2022-2031 (USD THOUSAND)
TABLE 56 ASIA-PACIFIC GENETIC TESTS IN MULTIPLE HEREDITARY EXOSTOSIS MARKET, BY TYPE, 2022-2031 (USD THOUSAND)
TABLE 57 ASIA-PACIFIC OTHERS IN MULTIPLE HEREDITARY EXOSTOSIS MARKET, BY TYPE, 2022-2031 (USD THOUSAND)
TABLE 58 ASIA-PACIFIC MULTIPLE HEREDITARY EXOSTOSIS MARKET, BY SITE, 2022-2031 (USD THOUSAND)
TABLE 59 ASIA-PACIFIC MULTIPLE HEREDITARY EXOSTOSIS MARKET, BY AGE GROUP, 2022-2031 (USD THOUSAND)
TABLE 60 ASIA-PACIFIC MULTIPLE HEREDITARY EXOSTOSIS MARKET, BY END USER, 2022-2031 (USD THOUSAND)
TABLE 61 ASIA-PACIFIC HOSPITAL IN MULTIPLE HEREDITARY EXOSTOSIS MARKET, BY TYPE, 2022-2031 (USD THOUSAND)
TABLE 62 CHINA MULTIPLE HEREDITARY EXOSTOSIS MARKET, BY TYPE, 2022-2031 (USD THOUSAND)
TABLE 63 CHINA MULTIPLE HEREDITARY EXOSTOSIS MARKET, BY TREATMENT, 2022-2031 (USD THOUSAND)
TABLE 64 CHINA SURGERY IN MULTIPLE HEREDITARY EXOSTOSIS MARKET, BY TYPE, 2022-2031 (USD THOUSAND)
TABLE 65 CHINA MEDICATION IN MULTIPLE HEREDITARY EXOSTOSIS MARKET, BY DISTRIBUTION CHANNEL, 2022-2031 (USD THOUSAND)
TABLE 66 CHINA MULTIPLE HEREDITARY EXOSTOSIS MARKET, BY DIAGNOSIS, 2022-2031 (USD THOUSAND)
TABLE 67 CHINA X-RAY IN MULTIPLE HEREDITARY EXOSTOSIS MARKET, BY TYPE, 2022-2031 (USD THOUSAND)
TABLE 68 CHINA COMPUTED TOMOGRAPHY (CT) SCAN IN MULTIPLE HEREDITARY EXOSTOSIS MARKET, BY TYPE, 2022-2031 (USD THOUSAND)
TABLE 69 CHINA MAGNETIC RESONANCE IMAGING (MRI) IN MULTIPLE HEREDITARY EXOSTOSIS MARKET, BY TYPE, 2022-2031 (USD THOUSAND)
TABLE 70 CHINA GENETIC TESTS IN MULTIPLE HEREDITARY EXOSTOSIS MARKET, BY TYPE, 2022-2031 (USD THOUSAND)
TABLE 71 CHINA OTHERS IN MULTIPLE HEREDITARY EXOSTOSIS MARKET, BY TYPE, 2022-2031 (USD THOUSAND)
TABLE 72 CHINA MULTIPLE HEREDITARY EXOSTOSIS MARKET, BY SITE, 2022-2031 (USD THOUSAND)
TABLE 73 CHINA MULTIPLE HEREDITARY EXOSTOSIS MARKET, BY AGE GROUP, 2022-2031 (USD THOUSAND)
TABLE 74 CHINA MULTIPLE HEREDITARY EXOSTOSIS MARKET, BY END USER, 2022-2031 (USD THOUSAND)
TABLE 75 CHINA HOSPITAL IN MULTIPLE HEREDITARY EXOSTOSIS MARKET, BY TYPE, 2022-2031 (USD THOUSAND)
TABLE 76 JAPAN MULTIPLE HEREDITARY EXOSTOSIS MARKET, BY TYPE, 2022-2031 (USD THOUSAND)
TABLE 77 JAPAN MULTIPLE HEREDITARY EXOSTOSIS MARKET, BY TREATMENT, 2022-2031 (USD THOUSAND)
TABLE 78 JAPAN SURGERY IN MULTIPLE HEREDITARY EXOSTOSIS MARKET, BY TYPE, 2022-2031 (USD THOUSAND)
TABLE 79 JAPAN MEDICATION IN MULTIPLE HEREDITARY EXOSTOSIS MARKET, BY DISTRIBUTION CHANNEL, 2022-2031 (USD THOUSAND)
TABLE 80 JAPAN MULTIPLE HEREDITARY EXOSTOSIS MARKET, BY DIAGNOSIS, 2022-2031 (USD THOUSAND)
TABLE 81 JAPAN X-RAY IN MULTIPLE HEREDITARY EXOSTOSIS MARKET, BY TYPE, 2022-2031 (USD THOUSAND)
TABLE 82 JAPAN COMPUTED TOMOGRAPHY (CT) SCAN IN MULTIPLE HEREDITARY EXOSTOSIS MARKET, BY TYPE, 2022-2031 (USD THOUSAND)
TABLE 83 JAPAN MAGNETIC RESONANCE IMAGING (MRI) IN MULTIPLE HEREDITARY EXOSTOSIS MARKET, BY TYPE, 2022-2031 (USD THOUSAND)
TABLE 84 JAPAN GENETIC TESTS IN MULTIPLE HEREDITARY EXOSTOSIS MARKET, BY TYPE, 2022-2031 (USD THOUSAND)
TABLE 85 JAPAN OTHERS IN MULTIPLE HEREDITARY EXOSTOSIS MARKET, BY TYPE, 2022-2031 (USD THOUSAND)
TABLE 86 JAPAN MULTIPLE HEREDITARY EXOSTOSIS MARKET, BY SITE, 2022-2031 (USD THOUSAND)
TABLE 87 JAPAN MULTIPLE HEREDITARY EXOSTOSIS MARKET, BY AGE GROUP, 2022-2031 (USD THOUSAND)
TABLE 88 JAPAN MULTIPLE HEREDITARY EXOSTOSIS MARKET, BY END USER, 2022-2031 (USD THOUSAND)
TABLE 89 JAPAN HOSPITAL IN MULTIPLE HEREDITARY EXOSTOSIS MARKET, BY TYPE, 2022-2031 (USD THOUSAND)
TABLE 90 INDIA MULTIPLE HEREDITARY EXOSTOSIS MARKET, BY TYPE, 2022-2031 (USD THOUSAND)
TABLE 91 INDIA MULTIPLE HEREDITARY EXOSTOSIS MARKET, BY TREATMENT, 2022-2031 (USD THOUSAND)
TABLE 92 INDIA SURGERY IN MULTIPLE HEREDITARY EXOSTOSIS MARKET, BY TYPE, 2022-2031 (USD THOUSAND)
TABLE 93 INDIA MEDICATION IN MULTIPLE HEREDITARY EXOSTOSIS MARKET, BY DISTRIBUTION CHANNEL, 2022-2031 (USD THOUSAND)
TABLE 94 INDIA MULTIPLE HEREDITARY EXOSTOSIS MARKET, BY DIAGNOSIS, 2022-2031 (USD THOUSAND)
TABLE 95 INDIA X-RAY IN MULTIPLE HEREDITARY EXOSTOSIS MARKET, BY TYPE, 2022-2031 (USD THOUSAND)
TABLE 96 INDIA COMPUTED TOMOGRAPHY (CT) SCAN IN MULTIPLE HEREDITARY EXOSTOSIS MARKET, BY TYPE, 2022-2031 (USD THOUSAND)
TABLE 97 INDIA MAGNETIC RESONANCE IMAGING (MRI) IN MULTIPLE HEREDITARY EXOSTOSIS MARKET, BY TYPE, 2022-2031 (USD THOUSAND)
TABLE 98 INDIA GENETIC TESTS IN MULTIPLE HEREDITARY EXOSTOSIS MARKET, BY TYPE, 2022-2031 (USD THOUSAND)
TABLE 99 INDIA OTHERS IN MULTIPLE HEREDITARY EXOSTOSIS MARKET, BY TYPE, 2022-2031 (USD THOUSAND)
TABLE 100 INDIA MULTIPLE HEREDITARY EXOSTOSIS MARKET, BY SITE, 2022-2031 (USD THOUSAND)
TABLE 101 INDIA MULTIPLE HEREDITARY EXOSTOSIS MARKET, BY AGE GROUP, 2022-2031 (USD THOUSAND)
TABLE 102 INDIA MULTIPLE HEREDITARY EXOSTOSIS MARKET, BY END USER, 2022-2031 (USD THOUSAND)
TABLE 103 INDIA HOSPITAL IN MULTIPLE HEREDITARY EXOSTOSIS MARKET, BY TYPE, 2022-2031 (USD THOUSAND)
TABLE 104 AUSTRALIA MULTIPLE HEREDITARY EXOSTOSIS MARKET, BY TYPE, 2022-2031 (USD THOUSAND)
TABLE 105 AUSTRALIA MULTIPLE HEREDITARY EXOSTOSIS MARKET, BY TREATMENT, 2022-2031 (USD THOUSAND)
TABLE 106 AUSTRALIA SURGERY IN MULTIPLE HEREDITARY EXOSTOSIS MARKET, BY TYPE, 2022-2031 (USD THOUSAND)
TABLE 107 AUSTRALIA MEDICATION IN MULTIPLE HEREDITARY EXOSTOSIS MARKET, BY DISTRIBUTION CHANNEL, 2022-2031 (USD THOUSAND)
TABLE 108 AUSTRALIA MULTIPLE HEREDITARY EXOSTOSIS MARKET, BY DIAGNOSIS, 2022-2031 (USD THOUSAND)
TABLE 109 AUSTRALIA X-RAY IN MULTIPLE HEREDITARY EXOSTOSIS MARKET, BY TYPE, 2022-2031 (USD THOUSAND)
TABLE 110 AUSTRALIA COMPUTED TOMOGRAPHY (CT) SCAN IN MULTIPLE HEREDITARY EXOSTOSIS MARKET, BY TYPE, 2022-2031 (USD THOUSAND)
TABLE 111 AUSTRALIA MAGNETIC RESONANCE IMAGING (MRI) IN MULTIPLE HEREDITARY EXOSTOSIS MARKET, BY TYPE, 2022-2031 (USD THOUSAND)
TABLE 112 AUSTRALIA GENETIC TESTS IN MULTIPLE HEREDITARY EXOSTOSIS MARKET, BY TYPE, 2022-2031 (USD THOUSAND)
TABLE 113 AUSTRALIA OTHERS IN MULTIPLE HEREDITARY EXOSTOSIS MARKET, BY TYPE, 2022-2031 (USD THOUSAND)
TABLE 114 AUSTRALIA MULTIPLE HEREDITARY EXOSTOSIS MARKET, BY SITE, 2022-2031 (USD THOUSAND)
TABLE 115 AUSTRALIA MULTIPLE HEREDITARY EXOSTOSIS MARKET, BY AGE GROUP, 2022-2031 (USD THOUSAND)
TABLE 116 AUSTRALIA MULTIPLE HEREDITARY EXOSTOSIS MARKET, BY END USER, 2022-2031 (USD THOUSAND)
TABLE 117 AUSTRALIA HOSPITAL IN MULTIPLE HEREDITARY EXOSTOSIS MARKET, BY TYPE, 2022-2031 (USD THOUSAND)
TABLE 118 SOUTH KOREA MULTIPLE HEREDITARY EXOSTOSIS MARKET, BY TYPE, 2022-2031 (USD THOUSAND)
TABLE 119 SOUTH KOREA MULTIPLE HEREDITARY EXOSTOSIS MARKET, BY TREATMENT, 2022-2031 (USD THOUSAND)
TABLE 120 SOUTH KOREA SURGERY IN MULTIPLE HEREDITARY EXOSTOSIS MARKET, BY TYPE, 2022-2031 (USD THOUSAND)
TABLE 121 SOUTH KOREA MEDICATION IN MULTIPLE HEREDITARY EXOSTOSIS MARKET, BY DISTRIBUTION CHANNEL, 2022-2031 (USD THOUSAND)
TABLE 122 SOUTH KOREA MULTIPLE HEREDITARY EXOSTOSIS MARKET, BY DIAGNOSIS, 2022-2031 (USD THOUSAND)
TABLE 123 SOUTH KOREA X-RAY IN MULTIPLE HEREDITARY EXOSTOSIS MARKET, BY TYPE, 2022-2031 (USD THOUSAND)
TABLE 124 SOUTH KOREA COMPUTED TOMOGRAPHY (CT) SCAN IN MULTIPLE HEREDITARY EXOSTOSIS MARKET, BY TYPE, 2022-2031 (USD THOUSAND)
TABLE 125 SOUTH KOREA MAGNETIC RESONANCE IMAGING (MRI) IN MULTIPLE HEREDITARY EXOSTOSIS MARKET, BY TYPE, 2022-2031 (USD THOUSAND)
TABLE 126 SOUTH KOREA GENETIC TESTS IN MULTIPLE HEREDITARY EXOSTOSIS MARKET, BY TYPE, 2022-2031 (USD THOUSAND)
TABLE 127 SOUTH KOREA OTHERS IN MULTIPLE HEREDITARY EXOSTOSIS MARKET, BY TYPE, 2022-2031 (USD THOUSAND)
TABLE 128 SOUTH KOREA MULTIPLE HEREDITARY EXOSTOSIS MARKET, BY SITE, 2022-2031 (USD THOUSAND)
TABLE 129 SOUTH KOREA MULTIPLE HEREDITARY EXOSTOSIS MARKET, BY AGE GROUP, 2022-2031 (USD THOUSAND)
TABLE 130 SOUTH KOREA MULTIPLE HEREDITARY EXOSTOSIS MARKET, BY END USER, 2022-2031 (USD THOUSAND)
TABLE 131 SOUTH KOREA HOSPITAL IN MULTIPLE HEREDITARY EXOSTOSIS MARKET, BY TYPE, 2022-2031 (USD THOUSAND)
TABLE 132 INDONESIA MULTIPLE HEREDITARY EXOSTOSIS MARKET, BY TYPE, 2022-2031 (USD THOUSAND)
TABLE 133 INDONESIA MULTIPLE HEREDITARY EXOSTOSIS MARKET, BY TREATMENT, 2022-2031 (USD THOUSAND)
TABLE 134 INDONESIA SURGERY IN MULTIPLE HEREDITARY EXOSTOSIS MARKET, BY TYPE, 2022-2031 (USD THOUSAND)
TABLE 135 INDONESIA MEDICATION IN MULTIPLE HEREDITARY EXOSTOSIS MARKET, BY DISTRIBUTION CHANNEL, 2022-2031 (USD THOUSAND)
TABLE 136 INDONESIA MULTIPLE HEREDITARY EXOSTOSIS MARKET, BY DIAGNOSIS, 2022-2031 (USD THOUSAND)
TABLE 137 INDONESIA X-RAY IN MULTIPLE HEREDITARY EXOSTOSIS MARKET, BY TYPE, 2022-2031 (USD THOUSAND)
TABLE 138 INDONESIA COMPUTED TOMOGRAPHY (CT) SCAN IN MULTIPLE HEREDITARY EXOSTOSIS MARKET, BY TYPE, 2022-2031 (USD THOUSAND)
TABLE 139 INDONESIA MAGNETIC RESONANCE IMAGING (MRI) IN MULTIPLE HEREDITARY EXOSTOSIS MARKET, BY TYPE, 2022-2031 (USD THOUSAND)
TABLE 140 INDONESIA GENETIC TESTS IN MULTIPLE HEREDITARY EXOSTOSIS MARKET, BY TYPE, 2022-2031 (USD THOUSAND)
TABLE 141 INDONESIA OTHERS IN MULTIPLE HEREDITARY EXOSTOSIS MARKET, BY TYPE, 2022-2031 (USD THOUSAND)
TABLE 142 INDONESIA MULTIPLE HEREDITARY EXOSTOSIS MARKET, BY SITE, 2022-2031 (USD THOUSAND)
TABLE 143 INDONESIA MULTIPLE HEREDITARY EXOSTOSIS MARKET, BY AGE GROUP, 2022-2031 (USD THOUSAND)
TABLE 144 INDONESIA MULTIPLE HEREDITARY EXOSTOSIS MARKET, BY END USER, 2022-2031 (USD THOUSAND)
TABLE 145 INDONESIA HOSPITAL IN MULTIPLE HEREDITARY EXOSTOSIS MARKET, BY TYPE, 2022-2031 (USD THOUSAND)
TABLE 146 NEW ZEALAND MULTIPLE HEREDITARY EXOSTOSIS MARKET, BY TYPE, 2022-2031 (USD THOUSAND)
TABLE 147 NEW ZEALAND MULTIPLE HEREDITARY EXOSTOSIS MARKET, BY TREATMENT, 2022-2031 (USD THOUSAND)
TABLE 148 NEW ZEALAND SURGERY IN MULTIPLE HEREDITARY EXOSTOSIS MARKET, BY TYPE, 2022-2031 (USD THOUSAND)
TABLE 149 NEW ZEALAND MEDICATION IN MULTIPLE HEREDITARY EXOSTOSIS MARKET, BY DISTRIBUTION CHANNEL, 2022-2031 (USD THOUSAND)
TABLE 150 NEW ZEALAND MULTIPLE HEREDITARY EXOSTOSIS MARKET, BY DIAGNOSIS, 2022-2031 (USD THOUSAND)
TABLE 151 NEW ZEALAND X-RAY IN MULTIPLE HEREDITARY EXOSTOSIS MARKET, BY TYPE, 2022-2031 (USD THOUSAND)
TABLE 152 NEW ZEALAND COMPUTED TOMOGRAPHY (CT) SCAN IN MULTIPLE HEREDITARY EXOSTOSIS MARKET, BY TYPE, 2022-2031 (USD THOUSAND)
TABLE 153 NEW ZEALAND MAGNETIC RESONANCE IMAGING (MRI) IN MULTIPLE HEREDITARY EXOSTOSIS MARKET, BY TYPE, 2022-2031 (USD THOUSAND)
TABLE 154 NEW ZEALAND GENETIC TESTS IN MULTIPLE HEREDITARY EXOSTOSIS MARKET, BY TYPE, 2022-2031 (USD THOUSAND)
TABLE 155 NEW ZEALAND OTHERS IN MULTIPLE HEREDITARY EXOSTOSIS MARKET, BY TYPE, 2022-2031 (USD THOUSAND)
TABLE 156 NEW ZEALAND MULTIPLE HEREDITARY EXOSTOSIS MARKET, BY SITE, 2022-2031 (USD THOUSAND)
TABLE 157 NEW ZEALAND MULTIPLE HEREDITARY EXOSTOSIS MARKET, BY AGE GROUP, 2022-2031 (USD THOUSAND)
TABLE 158 NEW ZEALAND MULTIPLE HEREDITARY EXOSTOSIS MARKET, BY END USER, 2022-2031 (USD THOUSAND)
TABLE 159 NEW ZEALAND HOSPITAL IN MULTIPLE HEREDITARY EXOSTOSIS MARKET, BY TYPE, 2022-2031 (USD THOUSAND)
TABLE 160 MALAYSIA MULTIPLE HEREDITARY EXOSTOSIS MARKET, BY TYPE, 2022-2031 (USD THOUSAND)
TABLE 161 MALAYSIA MULTIPLE HEREDITARY EXOSTOSIS MARKET, BY TREATMENT, 2022-2031 (USD THOUSAND)
TABLE 162 MALAYSIA SURGERY IN MULTIPLE HEREDITARY EXOSTOSIS MARKET, BY TYPE, 2022-2031 (USD THOUSAND)
TABLE 163 MALAYSIA MEDICATION IN MULTIPLE HEREDITARY EXOSTOSIS MARKET, BY DISTRIBUTION CHANNEL, 2022-2031 (USD THOUSAND)
TABLE 164 MALAYSIA MULTIPLE HEREDITARY EXOSTOSIS MARKET, BY DIAGNOSIS, 2022-2031 (USD THOUSAND)
TABLE 165 MALAYSIA X-RAY IN MULTIPLE HEREDITARY EXOSTOSIS MARKET, BY TYPE, 2022-2031 (USD THOUSAND)
TABLE 166 MALAYSIA COMPUTED TOMOGRAPHY (CT) SCAN IN MULTIPLE HEREDITARY EXOSTOSIS MARKET, BY TYPE, 2022-2031 (USD THOUSAND)
TABLE 167 MALAYSIA MAGNETIC RESONANCE IMAGING (MRI) IN MULTIPLE HEREDITARY EXOSTOSIS MARKET, BY TYPE, 2022-2031 (USD THOUSAND)
TABLE 168 MALAYSIA GENETIC TESTS IN MULTIPLE HEREDITARY EXOSTOSIS MARKET, BY TYPE, 2022-2031 (USD THOUSAND)
TABLE 169 MALAYSIA OTHERS IN MULTIPLE HEREDITARY EXOSTOSIS MARKET, BY TYPE, 2022-2031 (USD THOUSAND)
TABLE 170 MALAYSIA MULTIPLE HEREDITARY EXOSTOSIS MARKET, BY SITE, 2022-2031 (USD THOUSAND)
TABLE 171 MALAYSIA MULTIPLE HEREDITARY EXOSTOSIS MARKET, BY AGE GROUP, 2022-2031 (USD THOUSAND)
TABLE 172 MALAYSIA MULTIPLE HEREDITARY EXOSTOSIS MARKET, BY END USER, 2022-2031 (USD THOUSAND)
TABLE 173 MALAYSIA HOSPITAL IN MULTIPLE HEREDITARY EXOSTOSIS MARKET, BY TYPE, 2022-2031 (USD THOUSAND)
TABLE 174 THAILAND MULTIPLE HEREDITARY EXOSTOSIS MARKET, BY TYPE, 2022-2031 (USD THOUSAND)
TABLE 175 THAILAND MULTIPLE HEREDITARY EXOSTOSIS MARKET, BY TREATMENT, 2022-2031 (USD THOUSAND)
TABLE 176 THAILAND SURGERY IN MULTIPLE HEREDITARY EXOSTOSIS MARKET, BY TYPE, 2022-2031 (USD THOUSAND)
TABLE 177 THAILAND MEDICATION IN MULTIPLE HEREDITARY EXOSTOSIS MARKET, BY DISTRIBUTION CHANNEL, 2022-2031 (USD THOUSAND)
TABLE 178 THAILAND MULTIPLE HEREDITARY EXOSTOSIS MARKET, BY DIAGNOSIS, 2022-2031 (USD THOUSAND)
TABLE 179 THAILAND X-RAY IN MULTIPLE HEREDITARY EXOSTOSIS MARKET, BY TYPE, 2022-2031 (USD THOUSAND)
TABLE 180 THAILAND COMPUTED TOMOGRAPHY (CT) SCAN IN MULTIPLE HEREDITARY EXOSTOSIS MARKET, BY TYPE, 2022-2031 (USD THOUSAND)
TABLE 181 THAILAND MAGNETIC RESONANCE IMAGING (MRI) IN MULTIPLE HEREDITARY EXOSTOSIS MARKET, BY TYPE, 2022-2031 (USD THOUSAND)
TABLE 182 THAILAND GENETIC TESTS IN MULTIPLE HEREDITARY EXOSTOSIS MARKET, BY TYPE, 2022-2031 (USD THOUSAND)
TABLE 183 THAILAND OTHERS IN MULTIPLE HEREDITARY EXOSTOSIS MARKET, BY TYPE, 2022-2031 (USD THOUSAND)
TABLE 184 THAILAND MULTIPLE HEREDITARY EXOSTOSIS MARKET, BY SITE, 2022-2031 (USD THOUSAND)
TABLE 185 THAILAND MULTIPLE HEREDITARY EXOSTOSIS MARKET, BY AGE GROUP, 2022-2031 (USD THOUSAND)
TABLE 186 THAILAND MULTIPLE HEREDITARY EXOSTOSIS MARKET, BY END USER, 2022-2031 (USD THOUSAND)
TABLE 187 THAILAND HOSPITAL IN MULTIPLE HEREDITARY EXOSTOSIS MARKET, BY TYPE, 2022-2031 (USD THOUSAND)
TABLE 188 TAIWAN MULTIPLE HEREDITARY EXOSTOSIS MARKET, BY TYPE, 2022-2031 (USD THOUSAND)
TABLE 189 TAIWAN MULTIPLE HEREDITARY EXOSTOSIS MARKET, BY TREATMENT, 2022-2031 (USD THOUSAND)
TABLE 190 TAIWAN SURGERY IN MULTIPLE HEREDITARY EXOSTOSIS MARKET, BY TYPE, 2022-2031 (USD THOUSAND)
TABLE 191 TAIWAN MEDICATION IN MULTIPLE HEREDITARY EXOSTOSIS MARKET, BY DISTRIBUTION CHANNEL, 2022-2031 (USD THOUSAND)
TABLE 192 TAIWAN MULTIPLE HEREDITARY EXOSTOSIS MARKET, BY DIAGNOSIS, 2022-2031 (USD THOUSAND)
TABLE 193 TAIWAN X-RAY IN MULTIPLE HEREDITARY EXOSTOSIS MARKET, BY TYPE, 2022-2031 (USD THOUSAND)
TABLE 194 TAIWAN COMPUTED TOMOGRAPHY (CT) SCAN IN MULTIPLE HEREDITARY EXOSTOSIS MARKET, BY TYPE, 2022-2031 (USD THOUSAND)
TABLE 195 TAIWAN MAGNETIC RESONANCE IMAGING (MRI) IN MULTIPLE HEREDITARY EXOSTOSIS MARKET, BY TYPE, 2022-2031 (USD THOUSAND)
TABLE 196 TAIWAN GENETIC TESTS IN MULTIPLE HEREDITARY EXOSTOSIS MARKET, BY TYPE, 2022-2031 (USD THOUSAND)
TABLE 197 TAIWAN OTHERS IN MULTIPLE HEREDITARY EXOSTOSIS MARKET, BY TYPE, 2022-2031 (USD THOUSAND)
TABLE 198 TAIWAN MULTIPLE HEREDITARY EXOSTOSIS MARKET, BY SITE, 2022-2031 (USD THOUSAND)
TABLE 199 TAIWAN MULTIPLE HEREDITARY EXOSTOSIS MARKET, BY AGE GROUP, 2022-2031 (USD THOUSAND)
TABLE 200 TAIWAN MULTIPLE HEREDITARY EXOSTOSIS MARKET, BY END USER, 2022-2031 (USD THOUSAND)
TABLE 201 TAIWAN HOSPITAL IN MULTIPLE HEREDITARY EXOSTOSIS MARKET, BY TYPE, 2022-2031 (USD THOUSAND)
TABLE 202 SINGAPORE MULTIPLE HEREDITARY EXOSTOSIS MARKET, BY TYPE, 2022-2031 (USD THOUSAND)
TABLE 203 SINGAPORE MULTIPLE HEREDITARY EXOSTOSIS MARKET, BY TREATMENT, 2022-2031 (USD THOUSAND)
TABLE 204 SINGAPORE SURGERY IN MULTIPLE HEREDITARY EXOSTOSIS MARKET, BY TYPE, 2022-2031 (USD THOUSAND)
TABLE 205 SINGAPORE MEDICATION IN MULTIPLE HEREDITARY EXOSTOSIS MARKET, BY DISTRIBUTION CHANNEL, 2022-2031 (USD THOUSAND)
TABLE 206 SINGAPORE MULTIPLE HEREDITARY EXOSTOSIS MARKET, BY DIAGNOSIS, 2022-2031 (USD THOUSAND)
TABLE 207 SINGAPORE X-RAY IN MULTIPLE HEREDITARY EXOSTOSIS MARKET, BY TYPE, 2022-2031 (USD THOUSAND)
TABLE 208 SINGAPORE COMPUTED TOMOGRAPHY (CT) SCAN IN MULTIPLE HEREDITARY EXOSTOSIS MARKET, BY TYPE, 2022-2031 (USD THOUSAND)
TABLE 209 SINGAPORE MAGNETIC RESONANCE IMAGING (MRI) IN MULTIPLE HEREDITARY EXOSTOSIS MARKET, BY TYPE, 2022-2031 (USD THOUSAND)
TABLE 210 SINGAPORE GENETIC TESTS IN MULTIPLE HEREDITARY EXOSTOSIS MARKET, BY TYPE, 2022-2031 (USD THOUSAND)
TABLE 211 SINGAPORE OTHERS IN MULTIPLE HEREDITARY EXOSTOSIS MARKET, BY TYPE, 2022-2031 (USD THOUSAND)
TABLE 212 SINGAPORE MULTIPLE HEREDITARY EXOSTOSIS MARKET, BY SITE, 2022-2031 (USD THOUSAND)
TABLE 213 SINGAPORE MULTIPLE HEREDITARY EXOSTOSIS MARKET, BY AGE GROUP, 2022-2031 (USD THOUSAND)
TABLE 214 SINGAPORE MULTIPLE HEREDITARY EXOSTOSIS MARKET, BY END USER, 2022-2031 (USD THOUSAND)
TABLE 215 SINGAPORE HOSPITAL IN MULTIPLE HEREDITARY EXOSTOSIS MARKET, BY TYPE, 2022-2031 (USD THOUSAND)
TABLE 216 PHILIPPINES MULTIPLE HEREDITARY EXOSTOSIS MARKET, BY TYPE, 2022-2031 (USD THOUSAND)
TABLE 217 PHILIPPINES MULTIPLE HEREDITARY EXOSTOSIS MARKET, BY TREATMENT, 2022-2031 (USD THOUSAND)
TABLE 218 PHILIPPINES SURGERY IN MULTIPLE HEREDITARY EXOSTOSIS MARKET, BY TYPE, 2022-2031 (USD THOUSAND)
TABLE 219 PHILIPPINES MEDICATION IN MULTIPLE HEREDITARY EXOSTOSIS MARKET, BY DISTRIBUTION CHANNEL, 2022-2031 (USD THOUSAND)
TABLE 220 PHILIPPINES MULTIPLE HEREDITARY EXOSTOSIS MARKET, BY DIAGNOSIS, 2022-2031 (USD THOUSAND)
TABLE 221 PHILIPPINES X-RAY IN MULTIPLE HEREDITARY EXOSTOSIS MARKET, BY TYPE, 2022-2031 (USD THOUSAND)
TABLE 222 PHILIPPINES COMPUTED TOMOGRAPHY (CT) SCAN IN MULTIPLE HEREDITARY EXOSTOSIS MARKET, BY TYPE, 2022-2031 (USD THOUSAND)
TABLE 223 PHILIPPINES MAGNETIC RESONANCE IMAGING (MRI) IN MULTIPLE HEREDITARY EXOSTOSIS MARKET, BY TYPE, 2022-2031 (USD THOUSAND)
TABLE 224 PHILIPPINES GENETIC TESTS IN MULTIPLE HEREDITARY EXOSTOSIS MARKET, BY TYPE, 2022-2031 (USD THOUSAND)
TABLE 225 PHILIPPINES OTHERS IN MULTIPLE HEREDITARY EXOSTOSIS MARKET, BY TYPE, 2022-2031 (USD THOUSAND)
TABLE 226 PHILIPPINES MULTIPLE HEREDITARY EXOSTOSIS MARKET, BY SITE, 2022-2031 (USD THOUSAND)
TABLE 227 PHILIPPINES MULTIPLE HEREDITARY EXOSTOSIS MARKET, BY AGE GROUP, 2022-2031 (USD THOUSAND)
TABLE 228 PHILIPPINES MULTIPLE HEREDITARY EXOSTOSIS MARKET, BY END USER, 2022-2031 (USD THOUSAND)
TABLE 229 PHILIPPINES HOSPITAL IN MULTIPLE HEREDITARY EXOSTOSIS MARKET, BY TYPE, 2022-2031 (USD THOUSAND)
TABLE 230 VIETNAM MULTIPLE HEREDITARY EXOSTOSIS MARKET, BY TYPE, 2022-2031 (USD THOUSAND)
TABLE 231 VIETNAM MULTIPLE HEREDITARY EXOSTOSIS MARKET, BY TREATMENT, 2022-2031 (USD THOUSAND)
TABLE 232 VIETNAM SURGERY IN MULTIPLE HEREDITARY EXOSTOSIS MARKET, BY TYPE, 2022-2031 (USD THOUSAND)
TABLE 233 VIETNAM MEDICATION IN MULTIPLE HEREDITARY EXOSTOSIS MARKET, BY DISTRIBUTION CHANNEL, 2022-2031 (USD THOUSAND)
TABLE 234 VIETNAM MULTIPLE HEREDITARY EXOSTOSIS MARKET, BY DIAGNOSIS, 2022-2031 (USD THOUSAND)
TABLE 235 VIETNAM X-RAY IN MULTIPLE HEREDITARY EXOSTOSIS MARKET, BY TYPE, 2022-2031 (USD THOUSAND)
TABLE 236 VIETNAM COMPUTED TOMOGRAPHY (CT) SCAN IN MULTIPLE HEREDITARY EXOSTOSIS MARKET, BY TYPE, 2022-2031 (USD THOUSAND)
TABLE 237 VIETNAM MAGNETIC RESONANCE IMAGING (MRI) IN MULTIPLE HEREDITARY EXOSTOSIS MARKET, BY TYPE, 2022-2031 (USD THOUSAND)
TABLE 238 VIETNAM GENETIC TESTS IN MULTIPLE HEREDITARY EXOSTOSIS MARKET, BY TYPE, 2022-2031 (USD THOUSAND)
TABLE 239 VIETNAM OTHERS IN MULTIPLE HEREDITARY EXOSTOSIS MARKET, BY TYPE, 2022-2031 (USD THOUSAND)
TABLE 240 VIETNAM MULTIPLE HEREDITARY EXOSTOSIS MARKET, BY SITE, 2022-2031 (USD THOUSAND)
TABLE 241 VIETNAM MULTIPLE HEREDITARY EXOSTOSIS MARKET, BY AGE GROUP, 2022-2031 (USD THOUSAND)
TABLE 242 VIETNAM MULTIPLE HEREDITARY EXOSTOSIS MARKET, BY END USER, 2022-2031 (USD THOUSAND)
TABLE 243 VIETNAM HOSPITAL IN MULTIPLE HEREDITARY EXOSTOSIS MARKET, BY TYPE, 2022-2031 (USD THOUSAND)
TABLE 244 REST OF ASIA-PACIFIC MULTIPLE HEREDITARY EXOSTOSIS MARKET, BY TYPE, 2022-2031 (USD THOUSAND)
List of Figure
FIGURE 1 ASIA-PACIFIC MULTIPLE HEREDITARY EXOSTOSIS MARKET: SEGMENTATION
FIGURE 2 ASIA-PACIFIC MULTIPLE HEREDITARY EXOSTOSIS MARKET: DATA TRIANGULATION
FIGURE 3 ASIA-PACIFIC MULTIPLE HEREDITARY EXOSTOSIS MARKET: DROC ANALYSIS
FIGURE 4 ASIA-PACIFIC MULTIPLE HEREDITARY EXOSTOSIS MARKET: ASIA-PACIFIC VS REGIONAL MARKET ANALYSIS
FIGURE 5 ASIA-PACIFIC MULTIPLE HEREDITARY EXOSTOSIS MARKET: COMPANY RESEARCH ANALYSIS
FIGURE 6 ASIA-PACIFIC MULTIPLE HEREDITARY EXOSTOSIS MARKET: INTERVIEW DEMOGRAPHICS
FIGURE 7 ASIA-PACIFIC MULTIPLE HEREDITARY EXOSTOSIS MARKET: MARKET END USER COVERAGE GRID
FIGURE 8 PRODUCT LIFELINE CURVE
FIGURE 9 ASIA-PACIFIC MULTIPLE HEREDITARY EXOSTOSIS MARKET: DBMR MARKET POSITION GRID
FIGURE 10 ASIA-PACIFIC MULTIPLE HEREDITARY EXOSTOSIS MARKET: VENDOR SHARE ANALYSIS
FIGURE 11 ASIA-PACIFIC MULTIPLE HEREDITARY EXOSTOSIS MARKET: SEGMENTATION
FIGURE 12 EXECUTIVE SUMMARY
FIGURE 13 STRATEGIC DECISIONS
FIGURE 14 TWO SEGMENTS COMPRISE THE ASIA-PACIFIC MULTIPLE HEREDITY EXOSTOSIS MARKET, BY TYPE
FIGURE 15 RISING PREVALENCE OF GENETIC DISORDERS IS DRIVING THE GROWTH OF THE ASIA-PACIFIC MULTIPLE HEREDITARY EXOSTOSIS MARKET FROM 2024 TO 2031
FIGURE 16 THE TYPE SEGMENT IS EXPECTED TO ACCOUNT FOR THE LARGEST SHARE OF THE ASIA-PACIFIC MULTIPLE HEREDITARY EXOSTOSIS MARKET IN 2024 AND 2031
FIGURE 17 MARKET OVERVIEW
FIGURE 18 ASIA-PACIFIC MULTIPLE HEREDITARY EXOSTOSIS MARKET: BY TYPE, 2023
FIGURE 19 ASIA-PACIFIC MULTIPLE HEREDITARY EXOSTOSIS MARKET: BY TYPE, 2024-2031 (USD THOUSAND)
FIGURE 20 ASIA-PACIFIC MULTIPLE HEREDITARY EXOSTOSIS MARKET: BY TYPE, CAGR (2024-2031)
FIGURE 21 ASIA-PACIFIC MULTIPLE HEREDITARY EXOSTOSIS MARKET: BY TYPE, LIFELINE CURVE
FIGURE 22 ASIA-PACIFIC MULTIPLE HEREDITARY EXOSTOSIS MARKET: BY TREATMENT, 2023
FIGURE 23 ASIA-PACIFIC MULTIPLE HEREDITARY EXOSTOSIS MARKET: BY TREATMENT, 2024-2031 (USD THOUSAND)
FIGURE 24 ASIA-PACIFIC MULTIPLE HEREDITARY EXOSTOSIS MARKET: BY TREATMENT, CAGR (2024-2031)
FIGURE 25 ASIA-PACIFIC MULTIPLE HEREDITARY EXOSTOSIS MARKET: BY TREATMENT, LIFELINE CURVE
FIGURE 26 ASIA-PACIFIC MULTIPLE HEREDITARY EXOSTOSIS MARKET: BY DIAGNOSIS, 2023
FIGURE 27 ASIA-PACIFIC MULTIPLE HEREDITARY EXOSTOSIS MARKET: BY DIAGNOSIS, 2024-2031 (USD THOUSAND)
FIGURE 28 ASIA-PACIFIC MULTIPLE HEREDITARY EXOSTOSIS MARKET: BY DIAGNOSIS, CAGR (2024-2031)
FIGURE 29 ASIA-PACIFIC MULTIPLE HEREDITARY EXOSTOSIS MARKET: BY DIAGNOSIS, LIFELINE CURVE
FIGURE 30 ASIA-PACIFIC MULTIPLE HEREDITARY EXOSTOSIS MARKET: BY SITE, 2023
FIGURE 31 ASIA-PACIFIC MULTIPLE HEREDITARY EXOSTOSIS MARKET: BY SITE, 2024-2031 (USD THOUSAND)
FIGURE 32 ASIA-PACIFIC MULTIPLE HEREDITARY EXOSTOSIS MARKET: BY SITE, CAGR (2024-2031)
FIGURE 33 ASIA-PACIFIC MULTIPLE HEREDITARY EXOSTOSIS MARKET: BY SITE, LIFELINE CURVE
FIGURE 34 ASIA-PACIFIC MULTIPLE HEREDITARY EXOSTOSIS MARKET: BY AGE GROUP, 2023
FIGURE 35 ASIA-PACIFIC MULTIPLE HEREDITARY EXOSTOSIS MARKET: BY AGE GROUP, 2024-2031 (USD THOUSAND)
FIGURE 36 ASIA-PACIFIC MULTIPLE HEREDITARY EXOSTOSIS MARKET: BY AGE GROUP, CAGR (2024-2031)
FIGURE 37 ASIA-PACIFIC MULTIPLE HEREDITARY EXOSTOSIS MARKET: BY AGE GROUP, LIFELINE CURVE
FIGURE 38 ASIA-PACIFIC MULTIPLE HEREDITARY EXOSTOSIS MARKET: BY END USER, 2023
FIGURE 39 ASIA-PACIFIC MULTIPLE HEREDITARY EXOSTOSIS MARKET: BY END USER, 2024-2031 (USD THOUSAND)
FIGURE 40 ASIA-PACIFIC MULTIPLE HEREDITARY EXOSTOSIS MARKET: BY END USER, CAGR (2024-2031)
FIGURE 41 ASIA-PACIFIC MULTIPLE HEREDITARY EXOSTOSIS MARKET: BY END USER, LIFELINE CURVE
FIGURE 42 ASIA-PACIFIC MULTIPLE HEREDITY EXOSTOSIS MARKET: SNAPSHOT (2023)
FIGURE 43 ASIA-PACIFIC MULTIPLE HEREDITARY EXOSTOSIS MARKET: COMPANY SHARE 2023 (%)
Data collection and base year analysis are done using data collection modules with large sample sizes. The stage includes obtaining market information or related data through various sources and strategies. It includes examining and planning all the data acquired from the past in advance. It likewise envelops the examination of information inconsistencies seen across different information sources. The market data is analysed and estimated using market statistical and coherent models. Also, market share analysis and key trend analysis are the major success factors in the market report. To know more, please request an analyst call or drop down your inquiry.
The key research methodology used by DBMR research team is data triangulation which involves data mining, analysis of the impact of data variables on the market and primary (industry expert) validation. Data models include Vendor Positioning Grid, Market Time Line Analysis, Market Overview and Guide, Company Positioning Grid, Patent Analysis, Pricing Analysis, Company Market Share Analysis, Standards of Measurement, Global versus Regional and Vendor Share Analysis. To know more about the research methodology, drop in an inquiry to speak to our industry experts.
Data Bridge Market Research is a leader in advanced formative research. We take pride in servicing our existing and new customers with data and analysis that match and suits their goal. The report can be customized to include price trend analysis of target brands understanding the market for additional countries (ask for the list of countries), clinical trial results data, literature review, refurbished market and product base analysis. Market analysis of target competitors can be analyzed from technology-based analysis to market portfolio strategies. We can add as many competitors that you require data about in the format and data style you are looking for. Our team of analysts can also provide you data in crude raw excel files pivot tables (Fact book) or can assist you in creating presentations from the data sets available in the report.


