
Asia Pacific Neonatal Jaundice Management Market
Market Size in USD Million
 USD
95.37 Million
USD
166.32 Million
2025
2033
USD
95.37 Million
USD
166.32 Million
2025
2033
| 2026 - 2033 | |
| USD 95.37 Million | |
| USD 166.32 Million | |
| % | |
|
Asia-Pacific Neonatal Jaundice Management Market Size
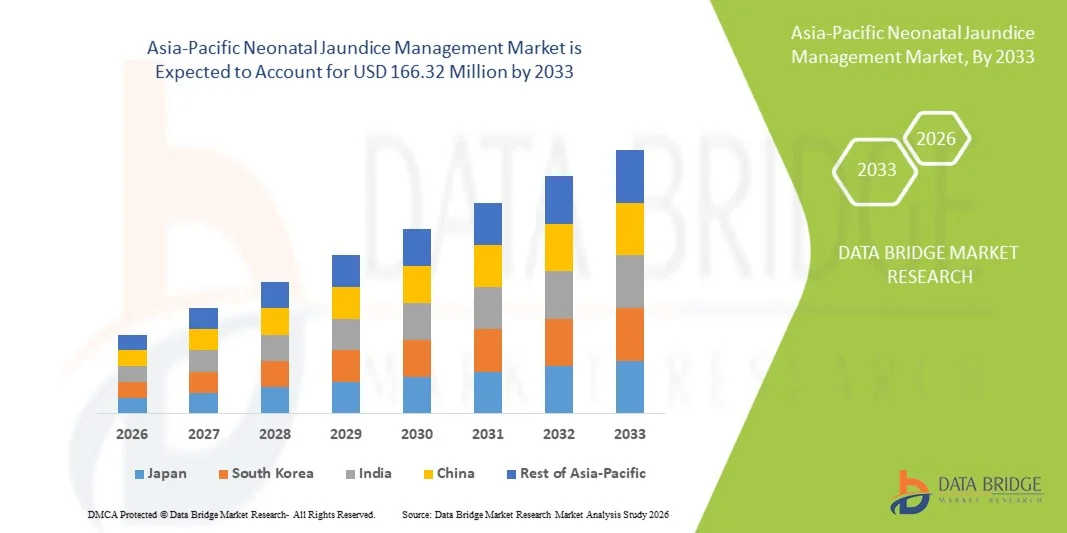
- The Asia-Pacific Neonatal Jaundice Management Market size was valued at USD 95.37 Million in 2025 and is expected to reach USD 166.32 Million by 2033, at a CAGR of 7.20% during the forecast period
- The market growth is largely fueled by the rising incidence of neonatal jaundice, increasing awareness among healthcare professionals and parents, and continuous technological advancements in phototherapy systems, leading to improved diagnosis, monitoring, and treatment outcomes across hospitals and neonatal care units.
- Furthermore, growing demand for safe, non-invasive, and effective jaundice management solutions, along with expanding neonatal intensive care infrastructure and supportive government initiatives for maternal and child health, is accelerating the adoption of neonatal jaundice management technologies, thereby significantly boosting the overall market growth.
Asia-Pacific Neonatal Jaundice Management Market Analysis
- Neonatal jaundice management solutions, including phototherapy devices and bilirubin monitoring systems, play a critical role in neonatal care by enabling early diagnosis and effective treatment of hyperbilirubinemia, thereby reducing the risk of long-term neurological complications in newborns across hospitals and neonatal intensive care units
- The escalating demand for neonatal jaundice management is primarily driven by rising birth rates in developing economies, increasing prevalence of neonatal jaundice, improved access to maternal and child healthcare services, and growing adoption of advanced, non-invasive phototherapy technologies
- China dominated the Asia-Pacific Neonatal Jaundice Management Market with the largest revenue share of approximately 36.4% in 2025, supported by a high number of annual births, expanding hospital infrastructure, strong government focus on neonatal health, and widespread deployment of phototherapy systems across public and private healthcare facilities
- India is expected to be the fastest growing country in the Asia-Pacific Neonatal Jaundice Management Market during the forecast period, registering a CAGR of around 8.9%, driven by increasing institutional deliveries, rapid expansion of neonatal intensive care units (NICUs), rising healthcare awareness, and government initiatives aimed at improving newborn survival rates
- The Treatment segment dominated the largest market revenue share of 62.8% in 2025, driven by the high prevalence of neonatal hyperbilirubinemia and the immediate need for therapeutic intervention
Report Scope and Asia-Pacific Neonatal Jaundice Management Market Segmentation
|
Attributes |
Asia-Pacific Neonatal Jaundice Management Key Market Insights |
|
Segments Covered |
|
|
Countries Covered |
Asia-Pacific
|
|
Key Market Players |
|
|
Market Opportunities |
|
|
Value Added Data Infosets |
In addition to the insights on market scenarios such as market value, growth rate, segmentation, geographical coverage, and major players, the market reports curated by the Data Bridge Market Research also include in-depth expert analysis, patient epidemiology, pipeline analysis, pricing analysis, and regulatory framework. |
Asia-Pacific Neonatal Jaundice Management Market Trends
“Advancements in Non-Invasive and Technology-Enabled Jaundice Management”
- A significant and accelerating trend in the Asia-Pacific Neonatal Jaundice Management Market is the growing adoption of non-invasive, technology-enabled diagnostic and treatment solutions, particularly transcutaneous bilirubinometers and advanced phototherapy systems. These innovations are improving early detection, treatment accuracy, and clinical efficiency across hospitals and neonatal care centers in the region
- For instance, companies such as Dräger and Natus Medical have introduced advanced LED-based phototherapy devices and handheld bilirubin measurement tools that enable rapid screening without blood sampling. These solutions are increasingly deployed across maternity hospitals in countries such as China, India, Japan, and South Korea, supporting timely intervention and reducing neonatal discomfort
- Technological enhancements in neonatal jaundice management systems are enabling real-time bilirubin monitoring, optimized light wavelength control, and improved treatment customization based on infant weight and bilirubin levels. For example, newer phototherapy units offer adjustable irradiance levels and integrated monitoring features that help clinicians ensure effective and safe treatment outcomes
- The integration of jaundice management devices into hospital neonatal care workflows is also gaining momentum, allowing seamless coordination between screening, diagnosis, and treatment. This improves clinical decision-making, shortens hospital stays, and reduces the burden on overcrowded neonatal intensive care units (NICUs) in high-birth-rate countries across Asia-Pacific
- This trend toward more efficient, patient-friendly, and technologically advanced jaundice management solutions is reshaping neonatal care standards in the region. Consequently, manufacturers such as GE HealthCare and Phoenix Medical Systems are focusing on developing compact, energy-efficient, and cost-effective devices tailored for both urban hospitals and rural healthcare facilities
- The rising demand for advanced neonatal jaundice management solutions is being driven by increasing awareness of early bilirubin screening, improving healthcare infrastructure, and government initiatives aimed at reducing neonatal morbidity and mortality across Asia-Pacific
Asia-Pacific Neonatal Jaundice Management Market Dynamics
Driver
“Rising Birth Rates, Preterm Deliveries, and Improving Neonatal Care Infrastructure”
- The high number of annual births across Asia-Pacific, combined with a growing incidence of preterm deliveries and neonatal hyperbilirubinemia, is a key driver for the increasing demand for neonatal jaundice management solutions in the region
- For instance, governments in countries such as India and China have expanded investments in maternal and child healthcare programs, supporting the procurement of phototherapy devices and bilirubin monitoring systems in public hospitals and community health centers. Such initiatives are expected to significantly drive market growth during the forecast period
- Increasing awareness among healthcare professionals regarding the risks of untreated neonatal jaundice—such as kernicterus and long-term neurological damage—is encouraging early screening and treatment adoption, further strengthening demand for effective management systems
- Furthermore, rapid expansion of neonatal intensive care units (NICUs), improving access to institutional deliveries, and rising healthcare expenditure across emerging Asia-Pacific economies are supporting broader adoption of jaundice management technologies
- The growing presence of private maternity hospitals, diagnostic centers, and specialized neonatal clinics, along with the availability of portable and easy-to-use jaundice management devices, is accelerating uptake across both urban and semi-urban healthcare settings
Restraint/Challenge
“High Equipment Costs and Limited Access in Rural Healthcare Settings”
- The relatively high initial cost of advanced phototherapy systems and bilirubin monitoring devices remains a significant challenge to widespread adoption, particularly in resource-constrained and rural healthcare facilities across several countries
- For instance, smaller hospitals and primary healthcare centers often face budget limitations that restrict the procurement of advanced neonatal care equipment, leading to continued reliance on conventional or less effective treatment methods
- In additional, disparities in healthcare infrastructure, shortage of trained neonatal care professionals, and limited awareness in remote regions can hinder the effective utilization of neonatal jaundice management solutions
- While affordable and portable devices are gradually entering the market, maintenance requirements, calibration needs, and inconsistent electricity supply in certain regions can further limit optimal device performance and adoption
Asia-Pacific Neonatal Jaundice Management Market Scope
The market is segmented on the basis of management, type, technology, end user, and distribution channel.
- By Management
On the basis of management, the Asia-Pacific Neonatal Jaundice Management Market is segmented into Diagnosis and Treatment. The Treatment segment dominated the largest market revenue share of 62.8% in 2025, driven by the high prevalence of neonatal hyperbilirubinemia and the immediate need for therapeutic intervention. Phototherapy remains the primary line of treatment across hospitals and clinics. Rising birth rates and increased screening contribute to higher treatment volumes. Hospitals prioritize rapid bilirubin reduction to prevent neurological complications. Technological advancements in phototherapy devices improve treatment efficiency. Increased clinical awareness boosts early treatment initiation. Government neonatal care programs support treatment adoption. High hospitalization rates sustain demand. Standardized treatment protocols reinforce dominance. Availability of non-invasive therapies enhances acceptance. Insurance coverage for neonatal care further supports growth. Continuous innovation maintains leadership.
The Diagnosis segment is expected to witness the fastest CAGR of 10.9% from 2026 to 2033, fueled by growing emphasis on early detection and preventive neonatal care. Rising adoption of transcutaneous bilirubin meters accelerates diagnosis rates. Screening at birth is becoming routine in hospitals. Increasing awareness among healthcare professionals supports frequent testing. Home-based diagnostic tools are gaining traction. Technological improvements enhance accuracy and portability. Government mandates for neonatal screening boost adoption. Diagnostic accessibility in primary care expands reach. Early diagnosis reduces treatment burden. Telehealth integration supports remote monitoring. Emerging markets drive volume growth. Strong CAGR reflects shift toward proactive care.
- By Type
On the basis of type, the Asia-Pacific Neonatal Jaundice Management Market is segmented into Primary Care and Secondary Care. The Secondary Care segment dominated the largest market revenue share of 55.4% in 2025, owing to the concentration of advanced neonatal facilities in secondary care hospitals. These centers manage moderate to severe jaundice cases. Availability of NICUs supports dominance. Specialized pediatric staff ensures effective management. Referral-driven patient inflow increases case volume. Advanced phototherapy equipment is widely available. Higher clinical trust drives utilization. Government-funded hospitals contribute significantly. Emergency neonatal admissions sustain demand. Established infrastructure reinforces leadership. Training programs improve care outcomes. Consistent patient flow ensures revenue stability.
The Primary Care segment is expected to witness the fastest CAGR of 11.6% from 2026 to 2033, driven by decentralization of neonatal services. Early-stage jaundice management is shifting toward primary centers. Improved screening tools enable frontline diagnosis. Rural healthcare expansion supports growth. Cost-effective care drives preference. Government initiatives strengthen primary neonatal care. Home visits by healthcare workers increase detection. Portable diagnostic devices boost adoption. Reduced referral burden enhances efficiency. Awareness campaigns support early intervention. Digital health integration accelerates growth. Strong CAGR reflects accessibility expansion.
- By Technology
On the basis of technology, the Asia-Pacific Neonatal Jaundice Management Market is segmented into Light-Emitting Diode Light Sources, Fluorescent, Halogen, Fiberoptic, and Others. The LED light source segment dominated the largest market revenue share of 48.7% in 2025, due to higher energy efficiency and longer operational life. LED phototherapy provides uniform light intensity. Reduced heat emission improves infant safety. Lower maintenance costs support hospital adoption. Compact design enables NICU integration. Clinical effectiveness drives preference. Regulatory approvals enhance trust. High usage in developed markets sustains dominance. Portable LED devices increase flexibility. Lower power consumption reduces operating costs. Manufacturer innovation supports leadership. Broad availability reinforces dominance.
The Fiberoptic segment is expected to witness the fastest CAGR of 12.3% from 2026 to 2033, driven by rising demand for home-based and low-risk phototherapy solutions. Fiberoptic blankets enable mother-infant bonding. Reduced hospitalization drives adoption. Home healthcare growth supports demand. Lightweight design enhances usability. Improved comfort boosts caregiver acceptance. Clinical outcomes support expansion. Emerging markets show strong uptake. Technological advancements improve efficacy. Pediatric recommendations support use. Insurance support increases accessibility. CAGR reflects shift toward patient-friendly care.
- By End User
On the basis of end user, the Asia-Pacific Neonatal Jaundice Management Market is segmented into Hospitals, Clinics, Ambulatory Surgical Centers, Home Users, and Others. The Hospitals segment dominated the largest market revenue share of 60.2% in 2025, driven by high neonatal admission rates. Availability of NICUs supports dominance. Hospitals manage severe jaundice cases. Advanced diagnostic and treatment tools are concentrated here. Skilled neonatal staff enhances outcomes. Emergency care access increases reliance. Government and private hospitals contribute significantly. Standardized care protocols sustain usage. High patient turnover increases volume. Insurance coverage favors hospital care. Strong infrastructure ensures leadership. Continuous upgrades maintain dominance.
The Home Users segment is expected to witness the fastest CAGR of 13.1% from 2026 to 2033, fueled by increasing preference for home-based neonatal care. Portable phototherapy devices enable home treatment. Reduced hospital stays drive adoption. Cost savings attract caregivers. Telemonitoring supports safety. Parental awareness is increasing. Healthcare providers recommend home care for mild cases. Product innovation enhances ease of use. E-commerce improves accessibility. Aging healthcare systems encourage decentralization. Government support boosts confidence. High CAGR reflects care model shift.
- By Distribution Channel
On the basis of distribution channel, the Asia-Pacific Neonatal Jaundice Management Market is segmented into Direct Tender, Retail Sales, and Third-Party Distribution. The Direct Tender segment dominated the largest market revenue share of 57.6% in 2025, supported by bulk procurement by hospitals and government healthcare systems. Long-term contracts ensure supply stability. Cost efficiency favors tenders. Public healthcare spending drives volume. Reliable vendor relationships sustain dominance. Regulatory compliance is streamlined. Large equipment orders boost revenue. Institutional trust reinforces adoption. National neonatal programs support procurement. Predictable demand aids planning. Tender-based purchasing ensures consistency. Strong policy backing sustains leadership.
The Retail Sales segment is expected to witness the fastest CAGR of 11.8% from 2026 to 2033, driven by rising demand for home-care phototherapy devices. Increased consumer awareness supports retail growth. Pharmacies and online platforms expand reach. Smaller device formats suit retail channels. Home users prefer direct purchase. Promotional pricing accelerates sales. Brand visibility boosts adoption. E-commerce penetration enhances access. Urbanization supports demand. Caregiver convenience drives preference. Product affordability improves uptake. CAGR reflects consumer-driven expansion.
Asia-Pacific Neonatal Jaundice Management Market Regional Analysis
- The Asia-Pacific Neonatal Jaundice Management Market is expected to witness strong growth during the forecast period of 2026 to 2033, driven by a high birth rate, improving maternal and neonatal healthcare infrastructure, and increasing awareness of early jaundice detection and treatment across emerging economies
- Rising healthcare expenditure, expansion of neonatal intensive care units (NICUs), and greater adoption of phototherapy devices in hospitals and clinics across countries such as China, India, and Southeast Asia are significantly contributing to market expansion
- Government initiatives aimed at reducing neonatal mortality and improving newborn care further support regional growth
China Asia-Pacific Neonatal Jaundice Management Market Insight
China Asia-Pacific Neonatal Jaundice Management Market dominated the Asia-Pacific Neonatal Jaundice Management Market in Asia-Pacific with the largest revenue share of approximately 36.4% in 2025, attributed to the country’s high number of annual births, expanding hospital infrastructure, and strong government focus on improving neonatal health outcomes. Widespread deployment of phototherapy systems across public and private healthcare facilities, along with increasing investments in maternal and child healthcare, is driving market growth. The presence of domestic manufacturers offering cost-effective neonatal care devices further enhances accessibility and adoption across urban and rural healthcare settings.
India Asia-Pacific Neonatal Jaundice Management Market Insight
India Asia-Pacific Neonatal Jaundice Management Market is expected to be the fastest growing country in the Asia-Pacific Neonatal Jaundice Management Market during the forecast period, registering a CAGR of around 8.9%. This growth is driven by increasing institutional deliveries, rapid expansion of NICUs, rising awareness of neonatal jaundice among healthcare professionals, and government initiatives focused on improving newborn survival rates. Programs promoting early screening, improved postnatal care, and strengthened healthcare infrastructure are accelerating the adoption of neonatal jaundice management solutions across hospitals and maternity centers in the country.
Asia-Pacific Neonatal Jaundice Management Market Share
The Neonatal Jaundice Management industry is primarily led by well-established companies, including:
- GE Healthcare (U.S.)
- Philips Healthcare (Netherlands)
- Drägerwerk AG (Germany)
- Natus Medical Incorporated (U.S.)
- Phoenix Medical Systems (India)
- Atom Medical Corporation (Japan)
- Medela AG (Switzerland)
- Fanem Ltda (Brazil)
- Weyer GmbH (Germany)
- Nice Neotech Medical Systems (India)
- MTTS Asia (Singapore)
- Olympic Medical (U.S.)
- Cobams Medisys (India)
- Heal Force Bio-Meditech Holdings (China)
- David Medical Device Co., Ltd. (China)
- Neotech Medical Systems (India)
- Ibis Medical Equipment & Systems (India)
- Novos Medical Systems (U.K.)
- Zeal Medical Pvt. Ltd. (India)
- Bistos Co., Ltd. (South Korea)
Latest Developments in Asia-Pacific Neonatal Jaundice Management Market
- In March 2025, Dräger expanded its neonatal care portfolio with BiliPredics, a predictive software solution that forecasts bilirubin progression up to 60 hours in advance. This innovation integrates advanced algorithms with clinical data to help healthcare professionals anticipate the dynamic development of neonatal jaundice and support timely clinical decisions. BiliPredics can align with electronic medical records and presents bilirubin trends for real-time assessment, reinforcing comprehensive jaundice management alongside Dräger’s existing phototherapy and screening solutions like the JM-105 bilirubinometer and BiliLux phototherapy light. The development represents a significant step in combining predictive analytics with traditional jaundice care to improve clinical outcomes worldwide
- In October 2023, Philips Healthcare unveiled a new advanced neonatal phototherapy device equipped with real-time monitoring capabilities. This launch marked a significant global development in jaundice treatment technology, providing continuous assessment of therapy effectiveness and enabling clinicians to tailor phototherapy dosing more precisely. The device aims to improve neonatal care by enhancing treatment efficacy while monitoring device performance and infant response, a shift towards more integrated, data-enabled neonatal therapies
- In August 2023, Drägerwerk AG introduced a next-generation LED phototherapy device designed to improve treatment outcomes. The technology focuses on energy-efficient, high-intensity LED light delivery that minimizes thermal risk and maximizes bilirubin reduction efficiency. This advancement reflects the ongoing industry trend of replacing older fluorescent and halogen units with LED solutions that deliver better clinical performance and lower operational costs globally
- In July 2023, Phoenix Medical Systems received regulatory approval for its latest neonatal phototherapy device. The cleared device includes usability and efficiency enhancements tailored for global clinical use in NICUs and maternity wards. Regulatory clearance supports broader distribution and adoption across international markets, particularly in hospitals seeking updated, clinician-friendly phototherapy equipment
SKU-

- Interactive Data Analysis Dashboard
- Company Analysis Dashboard for high growth potential opportunities
- Research Analyst Access for customization & queries
- Competitor Analysis with Interactive dashboard
- Latest News, Updates & Trend analysis
- Harness the Power of Benchmark Analysis for Comprehensive Competitor Tracking
Data collection and base year analysis are done using data collection modules with large sample sizes. The stage includes obtaining market information or related data through various sources and strategies. It includes examining and planning all the data acquired from the past in advance. It likewise envelops the examination of information inconsistencies seen across different information sources. The market data is analysed and estimated using market statistical and coherent models. Also, market share analysis and key trend analysis are the major success factors in the market report. To know more, please request an analyst call or drop down your inquiry.
The key research methodology used by DBMR research team is data triangulation which involves data mining, analysis of the impact of data variables on the market and primary (industry expert) validation. Data models include Vendor Positioning Grid, Market Time Line Analysis, Market Overview and Guide, Company Positioning Grid, Patent Analysis, Pricing Analysis, Company Market Share Analysis, Standards of Measurement, Global versus Regional and Vendor Share Analysis. To know more about the research methodology, drop in an inquiry to speak to our industry experts.
Data Bridge Market Research is a leader in advanced formative research. We take pride in servicing our existing and new customers with data and analysis that match and suits their goal. The report can be customized to include price trend analysis of target brands understanding the market for additional countries (ask for the list of countries), clinical trial results data, literature review, refurbished market and product base analysis. Market analysis of target competitors can be analyzed from technology-based analysis to market portfolio strategies. We can add as many competitors that you require data about in the format and data style you are looking for. Our team of analysts can also provide you data in crude raw excel files pivot tables (Fact book) or can assist you in creating presentations from the data sets available in the report.


