What is the Asia-Pacific Non-Destructive Testing Equipment Market Size and Growth Rate?
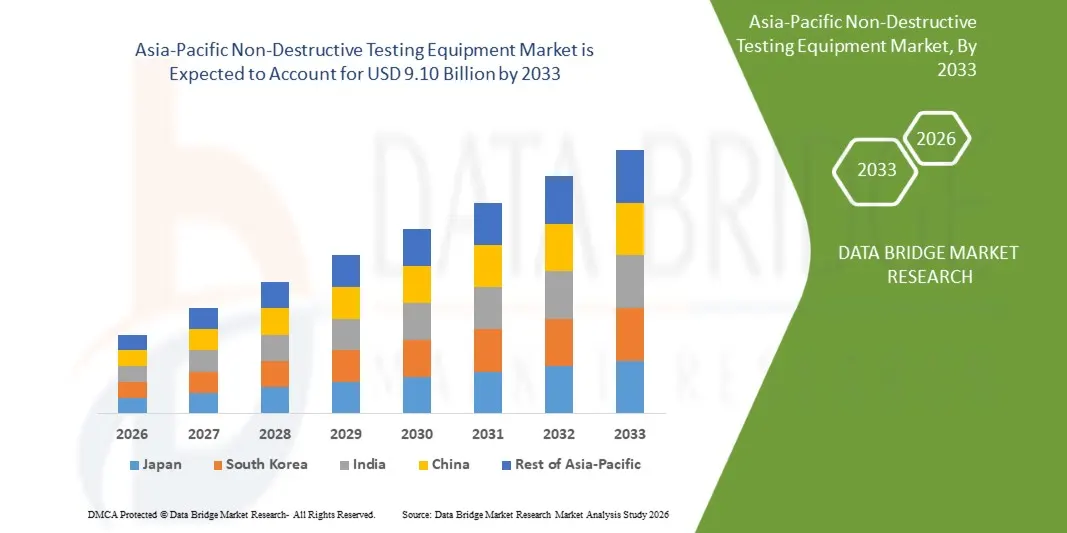
As per Data Bridge Market Research Analysis the Asia-Pacific non-destructive testing equipment market was valued at USD 6.47 billion in 2025 and is projected to reach USD 9.10 billion by 2033, growing at a CAGR of 12.09%. from 2026 to 2033. Growth in the Asia-Pacific non-destructive testing (NDT) equipment market is being driven by increasing demand for quality assurance, stringent safety regulations, rising investments in industrial infrastructure, expanding manufacturing activities, and the growing need for reliable inspection of critical components without causing damage. Non-destructive testing equipment plays a crucial role in identifying material defects, detecting structural weaknesses, evaluating component integrity, and ensuring operational safety, supporting applications across aerospace and defense, automotive and transportation, oil and gas, power generation, construction and infrastructure, manufacturing, and other industrial sectors.
The market encompasses a wide range of testing technologies, including ultrasonic testing, radiographic testing, visual inspection testing, magnetic particle testing, electromagnetic testing, eddy-current testing, liquid penetrant testing, and other testing methods, supported by techniques such as volumetric examination, surface examination, and other inspection techniques. Technological innovation, including phased-array ultrasonic testing, digital radiography, automated inspection systems, portable testing devices, robotics, and artificial intelligence-enabled defect detection, is reshaping equipment development. Meanwhile, increasing demand for predictive maintenance, improved inspection accuracy, reduced equipment downtime, regulatory compliance, and enhanced operational reliability is strengthening market opportunities across the Asia-Pacific non-destructive testing equipment market.
Market Size & Forecast
- Asia-Pacific Market Value (2025): USD 7.17 billion
- Expected Market Value (2033): USD 12.69 billion
- Forecast CAGR (2026–2033): 12.09%
- Leading state in 2025: China
- Fastest Growing state: Japan
Key Market Trends & Insights
- China dominated the Asia-Pacific non-destructive testing equipment market, accounting for an estimated 35.00% share in 2025, supported by its strong manufacturing sector, automotive production, precision engineering capabilities, and emphasis on quality control. Increasing investments in industrial automation, advanced inspection technologies, and predictive maintenance further strengthen the country's market position.
- The Ultrasonic Testing Equipment segment held an estimated 31.96% share in 2025, driven by its accuracy in detecting internal defects, suitability for thickness measurement, and widespread applications across oil and gas, aerospace and defense, energy and power, and automotive industries.
- Japan is expected to be among the fastest-growing countries in the Asia-Pacific non-destructive testing equipment market from 2026 to 2033, registering an estimated CAGR of 9.59%, supported by increasing investments in infrastructure inspection, energy projects, advanced manufacturing, and NDT technologies.
- The Radiography Testing Equipment segment is expected to be the fastest-growing testing type in the Asia-Pacific non-destructive testing equipment market during 2026–2033, registering an estimated CAGR of 12.01%, driven by increasing adoption of digital radiography, advanced imaging technologies, and automated inspection solutions for aerospace components, pipelines, and critical industrial equipment.
- The Volumetric Inspection segment is expected to be the fastest-growing method in the Asia-Pacific non-destructive testing equipment market during 2026–2033, registering an estimated CAGR of 12.03%, supported by rising demand for internal defect detection and structural integrity assessments across pipelines, pressure vessels, aerospace components, and power generation equipment.
- The Inspection Services segment accounted for an estimated 41.62% share in 2025, driven by increasing outsourcing of inspection activities, demand for specialized technical expertise, and the need to comply with industrial safety and quality standards.
- The Oil and Gas segment accounted for an estimated 26.11% share in 2025, supported by extensive pipeline networks, refinery maintenance requirements, asset integrity management, and stringent operational safety standards.
Report Scope and Asia-Pacific Non-Destructive Testing Equipment Market Segmentation
|
Attributes |
Asia-Pacific Non-Destructive Testing Equipment Key Market Insights |
|
Segments Covered |
|
|
Countries Covered |
Asia-Pacific
|
|
Key Market Players |
|
|
Market Opportunities |
|
|
Value Added Data Infosets |
In addition to the insights on market scenarios such as market value, growth rate, segmentation, geographical coverage, and major players, the market reports curated by the Data Bridge Market Research also include in-depth expert analysis, geographically represented company-wise production and capacity, network layouts of distributors and partners, detailed and updated price trend analysis and deficit analysis of supply chain and demand. |
What is the Key Trend in the Asia-Pacific Non-Destructive Testing Equipment Market?
Trend: Adoption of Advanced Digital and Automated Non-Destructive Testing Technologie
The Asia-Pacific non-destructive testing equipment market is witnessing growing opportunities as manufacturers and industrial operators increasingly focus on inspection accuracy, automation, and operational efficiency. Demand for advanced ultrasonic testing, digital radiography, phased-array ultrasonic testing, eddy-current testing, and automated visual inspection systems is increasing across oil and gas, energy and power, aerospace and defense, automotive and transportation, and infrastructure applications. These technologies help identify internal and surface defects, assess material integrity, reduce inspection time, and minimize the risk of equipment failure without damaging tested components. At the same time, the integration of artificial intelligence, robotics, digital imaging, and data analytics is improving defect recognition, inspection consistency, and predictive maintenance capabilities. These developments are creating opportunities for equipment manufacturers, inspection service providers, and industrial technology companies to develop advanced solutions that improve safety, reliability, and productivity across critical industrial operations.
For instance, in June 2025, Eddyfi Technologies announced the commercial release of its Cypher portable ultrasonic inspection platform, designed to provide advanced phased-array and Total Focusing Method (TFM) capabilities. The system incorporates high-performance imaging, a rugged design, and cloud-enabled data synchronization to support inspection and reporting in demanding industrial environments. This development highlights the industry's shift toward portable, advanced NDT equipment that improves inspection efficiency, data accessibility, and reliability.
These developments highlight the growing importance of digital inspection, automation, and advanced testing technologies in improving asset integrity and supporting the modernization of industrial inspection processes.
Asia-Pacific Non-Destructive Testing Equipment market Dynamics
Key Market Driver: Rising Demand for Industrial Safety, Asset Integrity, and Predictive Maintenance
The increasing need to maintain operational safety, equipment reliability, and structural integrity across critical industries is driving demand for non-destructive testing equipment globally. Oil and gas operators require regular inspections of pipelines, storage tanks, pressure vessels, and refinery equipment to identify defects and minimize the risk of leaks or failures. Similarly, aerospace and defense manufacturers rely on advanced inspection technologies to assess aircraft components, welds, and structural materials, while energy and power facilities use NDT systems to monitor turbines, boilers, and other critical equipment. Growing investments in infrastructure development, industrial manufacturing, transportation networks, and power generation are further strengthening the need for reliable inspection solutions. In addition, predictive maintenance programs are encouraging companies to identify potential defects before they result in costly breakdowns, production interruptions, or safety incidents. These factors are creating opportunities for NDT equipment manufacturers and inspection service providers to deliver accurate, efficient, and repeatable testing solutions across diverse industrial applications.
For instance, in April 2025, Eddyfi Technologies announced the commercial release of WeldXprt, an automated ultrasonic testing solution designed for pipeline girth weld inspection. The system integrates ultrasonic instrumentation, advanced software, and a motorized scanner to support faster, repeatable inspections, assisted analysis, and code-compliant reporting. This development demonstrates how automated NDT solutions can support pipeline integrity management, improve inspection productivity, and help operators meet industrial quality requirements.
These developments demonstrate how increasing emphasis on industrial safety, preventive maintenance, and infrastructure reliability is supporting demand for advanced non-destructive testing equipment worldwide.
Key Restraint/Challenge: High Equipment Costs and Shortage of Skilled NDT Professionals
High acquisition costs, technical complexity, and the shortage of qualified inspection professionals remain important challenges for the Asia-Pacific non-destructive testing equipment market. Advanced technologies such as phased-array ultrasonic testing, digital radiography, automated inspection systems, and robotic testing solutions require substantial investments in equipment, software, accessories, and supporting infrastructure. In addition, organizations must allocate resources for calibration, maintenance, operator training, certification, and compliance with applicable inspection standards. Small and medium-sized manufacturers may face difficulties adopting sophisticated equipment because of budget constraints and limited access to specialized technical expertise. The interpretation of complex inspection data also requires trained personnel who can distinguish relevant defects from false indications and determine whether components meet applicable quality and safety requirements. These factors can increase implementation costs, extend deployment timelines, and limit the adoption of advanced testing technologies, particularly among smaller industrial operators and organizations in developing markets.
For instance, in June 2025, Eddyfi Technologies introduced its Cypher portable ultrasonic inspection platform with advanced phased-array and Total Focusing Method capabilities. The company emphasized intuitive design to help bridge the gap between advanced ultrasonic technology and practical inspection execution. The development highlights the industry's focus on making sophisticated testing equipment more accessible and easier to operate, although specialized training and qualified interpretation remain important requirements for reliable inspection outcomes.
These challenges highlight the need for cost-effective equipment, simplified inspection workflows, accessible training programs, and improved data interpretation tools to support broader adoption of advanced NDT technologies.
Key Market Opportunity: Growing Adoption of Automated, AI-Enabled, and Remote Inspection Solutions
The growing adoption of industrial automation, artificial intelligence, robotics, and digital data analysis is creating significant opportunities in the Asia-Pacific non-destructive testing equipment market. Manufacturers and asset operators are increasingly seeking solutions that reduce manual inspection requirements, improve defect-detection consistency, and enable inspections in hazardous or difficult-to-access environments. AI-assisted analysis can help inspectors identify potential defects and prioritize areas requiring further examination, while robotic systems can support testing in confined spaces, offshore installations, pipelines, and other challenging locations. Digital inspection platforms also enable more efficient data storage, reporting, collaboration, and historical comparison, supporting condition monitoring and predictive maintenance programs. In addition, the integration of automated scanners, advanced ultrasonic techniques, and connected inspection software is creating opportunities for equipment manufacturers to offer comprehensive solutions that combine hardware, software, and inspection services. These developments can help industrial operators improve productivity, enhance worker safety, and strengthen asset management practices.
For instance, in April 2025, Eddyfi Technologies announced the commercial availability of WeldXprt, an automated ultrasonic testing solution for pipeline girth weld inspection. By combining ultrasonic instrumentation, motorized scanning, advanced imaging techniques, and assisted analysis, the system supports more consistent inspections and streamlined reporting. This example illustrates the opportunity for integrated and automated NDT solutions to improve inspection workflows and support the integrity management of critical industrial infrastructure.
These developments create opportunities for NDT equipment manufacturers, software developers, and inspection service providers to expand automated inspection capabilities, develop AI-assisted analysis tools, and deliver integrated solutions for increasingly complex industrial testing requirements.
How is the Asia-Pacific Non-Destructive Testing Equipment Market Segmented?
The Asia-Pacific non-destructive testing equipment market is segmented on the basis of testing method, technique, offering, and industry vertical.
- By Testing Method
On the basis of testing method, the Asia-Pacific non-destructive testing equipment market is segmented into ultrasonic testing, radiography testing, visual inspection testing, magnetic particle testing and electromagnetic testing, eddy-current testing, liquid penetrant testing, and others. In 2025, the Ultrasonic Testing Equipment segment dominated the market, accounting for an estimated 30.85% share, driven by its accuracy in detecting internal defects, evaluating material thickness, inspecting welds, and assessing component integrity across oil and gas, aerospace and defense, energy and power, and manufacturing applications.
The Radiography Testing Equipment segment is expected to register the fastest growth at an estimated CAGR of 12.01% from 2026 to 2033, driven by increasing adoption of digital radiography, advancements in imaging technologies, and growing demand for accurate defect detection in welds, pipelines, pressure vessels, and critical industrial components.
- By Technique
On the basis of technique, the Asia-Pacific non-destructive testing equipment market is segmented into volumetric examination, surface examination, and others. In 2025, the Volumetric Examination segment is estimated to dominate the market with a market share of 53.40%, owing to its ability to identify internal defects, assess material integrity, and inspect critical components used in pipelines, pressure vessels, aircraft structures, and power generation equipment.
The Surface Examination segment is projected to register the fastest growth at an estimated CAGR of 12.15% from 2026 to 2033, driven by increasing requirements for detecting surface cracks, corrosion, discontinuities, and other defects in manufactured components, welded structures, and industrial infrastructure.
- By Offering
On the basis of offering, the Asia-Pacific non-destructive testing equipment market is segmented into equipment, inspection services, training services, equipment rental services, and calibration services. In 2025, the Equipment segment is estimated to dominate the market with a market share of 55.80%, owing to increasing demand for advanced ultrasonic testing instruments, radiography systems, electromagnetic inspection devices, and visual testing equipment across industrial applications.
The Training Services segment is projected to register the fastest growth at an estimated CAGR of 12.99% from 2026 to 2033, driven by increasing demand for skilled and certified inspection professionals, rising adoption of advanced testing technologies, stringent industrial safety requirements, and the need for compliance with international inspection standards.
- By Industry Vertical
On the basis of industry vertical, the Asia-Pacific non-destructive testing equipment market is on the basis of industry vertical, the Asia-Pacific non-destructive testing equipment market is segmented into oil and gas, energy and power, aerospace and defense, automotive and transportation, infrastructure, and others. In 2025, the Oil and Gas segment is estimated to dominate the market with a market share of 25.40%, owing to extensive pipeline networks, refinery inspection requirements, pressure vessel maintenance, and increasing emphasis on operational safety, asset integrity, and regulatory compliance.
The infrastructure segment is projected to register the fastest growth at an estimated CAGR of 12.61% from 2026 to 2033, driven by increasing investments in bridges, transportation networks, industrial facilities, and public infrastructure, alongside growing demand for structural integrity assessments, corrosion detection, weld inspection, and preventive maintenance.
Asia-Pacific Non-Destructive Testing Equipment Market Insight
- In 2025, China dominated the Asia-Pacific non-destructive testing equipment market, accounting for an estimated revenue share of 12.89%, supported by its strong manufacturing sector, automotive production, precision engineering capabilities, and emphasis on quality control. Increasing investments in industrial automation, advanced inspection technologies, and predictive maintenance further strengthen the country's market position.
- The country benefits from well-established industrial infrastructure, stringent quality assurance requirements, and continued investments in digital inspection, automated testing, and predictive maintenance solutions. Expanding end-use applications across oil and gas, energy and power, aerospace and defense, automotive and transportation, and infrastructure continue to support strong market penetration and long-term growth potential across Europe.
China Non-Destructive Testing Equipment Market Insight
The China non-destructive testing equipment market is expanding, driven by its strong manufacturing sector, increasing automotive production, large-scale infrastructure development, and rising demand for industrial safety and quality assurance. Technological advancements in ultrasonic testing, digital radiography, automated inspection systems, and intelligent defect detection, combined with investments in industrial automation and predictive maintenance, are supporting the adoption of advanced non-destructive testing solutions across the country.
Japan Non-Destructive Testing Equipment Market Insight
The Japan non-destructive testing equipment market is witnessing growth, supported by its advanced automotive industry, precision engineering capabilities, aerospace manufacturing, and established energy infrastructure. Growing adoption of automated inspection systems, digital radiography, advanced ultrasonic testing, and predictive maintenance technologies, alongside increasing emphasis on product quality, equipment reliability, and industrial safety, is supporting demand for non-destructive testing solutions across the country.
South Korea Non-Destructive Testing Equipment Market Insight
The South Korea non-destructive testing equipment market is expanding, driven by its strong shipbuilding industry, semiconductor manufacturing, automotive production, and advanced industrial infrastructure. Increasing demand for weld inspection, defect detection, structural integrity assessments, and equipment reliability, combined with investments in smart manufacturing, digital inspection technologies, and industrial automation, is supporting the adoption of advanced non-destructive testing solutions across the country.
India Non-Destructive Testing Equipment Market Insight
The India non-destructive testing equipment market is witnessing growth, supported by expanding manufacturing activities, infrastructure development, automotive production, and increasing investments in energy and power projects. Rising demand for pipeline inspection, weld assessment, corrosion detection, and industrial safety, alongside growing adoption of automated inspection systems, digital radiography, and predictive maintenance technologies, is strengthening demand for non-destructive testing solutions across the country.
Taiwan Non-Destructive Testing Equipment Market Insight
The Taiwan non-destructive testing equipment market is expanding, driven by its advanced semiconductor manufacturing industry, electronics production, precision engineering capabilities, and industrial infrastructure. Increasing emphasis on component reliability, quality control, and defect detection, combined with technological advancements in automated inspection, ultrasonic testing, and digital imaging systems, is supporting the adoption of non-destructive testing solutions across the country.
Singapore Non-Destructive Testing Equipment Market Insight
The Singapore non-destructive testing equipment market is witnessing growth, supported by its established oil and gas industry, petrochemical facilities, marine engineering sector, and advanced manufacturing infrastructure. Increasing demand for pipeline inspection, corrosion monitoring, weld assessment, and asset integrity management, alongside investments in digital inspection technologies, industrial automation, and preventive maintenance, is supporting demand for advanced non-destructive testing solutions across the country.
Malaysia Non-Destructive Testing Equipment Market Insight
The Malaysia non-destructive testing equipment market is expanding, driven by its oil and gas industry, petrochemical facilities, manufacturing activities, and infrastructure development. Rising demand for pipeline inspection, pressure vessel assessment, corrosion detection, and industrial equipment reliability, combined with investments in energy infrastructure, manufacturing modernization, and advanced inspection technologies, is supporting the adoption of non-destructive testing solutions across the country.
Which are the Top Companies in Asia-Pacific Non-Destructive Testing Equipment Market?
The non-destructive testing equipment industry is primarily led by well-established companies, including:
- GE Company LLC (U.S.)
- Olympus Corporation (Japan)
- YXLON International (Germany)
- MISTRAS Group, Inc. (U.S.)
- Zetec, Inc. (U.S.)
- FOERSTER Holding GmbH (Germany)
- Nikon Metrology NV (Belgium)
- SGS Group (SGS SA) (Switzerland)
- Fujifilm Holdings Corporation (Japan)
- Bureau Veritas S.A. (France)
- Acuren (Canada)
- NDT Asia-Pacific (Ireland)
- Cygnus Instruments Inc. (U.K.)
- Magnaflux (U.S.)
- Eddyfi (Canada)
- Bosello High Technology Srl (Italy)
- T.D. Williamson, Inc. (U.S.)
- Sonaspection (U.S.)
- LynX Inspection (U.S.)
- Fischer Technology, Inc. (U.S.)
What are Latest Developments in Asia-Pacific Non-Destructive Testing Equipment Market Market?
- In August 2022, Olympus Corporation announced a definitive agreement to sell its subsidiary Evident, formerly known as Olympus Scientific Solutions, to Bain Capital Private Equity for approximately USD 3.1 billion (JPY 427.6 billion). The transaction included its scientific solutions business, which provided industrial inspection and non-destructive testing technologies, marking a significant change in the ownership of its industrial inspection operations.
- In January 2022, Eddyfi/NDT Inc. completed the acquisition of Zetec, Inc. from Roper Technologies for approximately USD 350 million in cash. The acquisition strengthened Eddyfi Technologies' non-destructive testing portfolio by integrating Zetec's inspection technologies and expanding its capabilities in industrial inspection applications.
- In August 2021, Eddyfi/NDT Inc. entered into a definitive agreement to acquire Zetec, Inc. from Roper Technologies. Announced on 10 August 2021, the transaction represented a strategic step toward expanding Eddyfi's non-destructive testing technology portfolio and strengthening its position in industrial inspection markets.
- In April 2023, Olympus Corporation completed the transfer of all shares of Evident to Bain Capital following regulatory approvals in Japan and other jurisdictions. The transaction separated the industrial inspection and non-destructive testing business from Olympus, allowing Evident to operate under new ownership and continue serving industrial inspection applications.
- Interactive Data Analysis Dashboard
- Company Analysis Dashboard for high growth potential opportunities
- Research Analyst Access for customization & queries
- Competitor Analysis with Interactive dashboard
- Latest News, Updates & Trend analysis
- Harness the Power of Benchmark Analysis for Comprehensive Competitor Tracking
Table of Content
1 INTRODUCTION
1.1 OBJECTIVES OF THE STUDY
1.2 MARKET DEFINITION
1.3 OVERVIEW OF ASIA-PACIFIC NON-DESTRUCTIVE TESTING EQUIPMENT MARKET
1.4 CURRENCY AND PRICING
1.5 LIMITATION
1.6 MARKETS COVERED
2 MARKET SEGMENTATION
2.1 ASIA-PACIFIC NON-DESTRUCTIVE TESTING EQUIPMENT MARKET: SEGMENTATION
2.2 KEY TAKEAWAYS
2.3 ARRIVING AT THE ASIA-PACIFIC NON-DESTRUCTIVE TESTING EQUIPMENT MARKET SIZE
2.4 MARKETS COVERED
2.5 GEOGRAPHIC SCOPE
2.6 YEARS CONSIDERED FOR THE STUDY
2.7 RESEARCH METHODOLOGY
2.8 TECHNOLOGY LIFE LINE CURVE
2.9 MULTIVARIATE MODELLING
2.1 PRIMARY INTERVIEWS WITH KEY OPINION LEADERS
2.11 DBMR MARKET POSITION GRID
2.12 MARKET APPLICATION COVERAGE GRID
2.13 DBMR MARKET CHALLENGE MATRIX
2.14 IMPORT AND EXPORT DATA
2.15 SECONDARY SOURCES
2.16 ASSUMPTIONS
2.17 ASIA-PACIFIC NON-DESTRUCTIVE TESTING EQUIPMENT MARKET: RESEARCH SNAPSHOT
2.18 ASSUMPTIONS
3 MARKET OVERVIEW
3.1 DRIVERS
3.1.1 AGEING PIPELINE AND REFINERY ASSETS FORCE INSPECTION ONTO A FIXED STATUTORY CLOCK
3.1.2 AEROSPACE BUILD RATES AND COMPOSITE AIRFRAMES SHIFT INSPECTION TOWARD SURFACE AND ARRAY METHODS
3.1.3 A CERTIFIED TECHNICIAN SHORTAGE TURNS TRAINING INTO A PURCHASED PRODUCT
3.1.4 DIGITAL RADIOGRAPHY AND SOURCE REGULATION ARE RETIRING FILM AND GAMMA ISOTOPES
3.1.5 RENTAL AND OUTCOME-BASED CONTRACTING CHANGE HOW INSPECTION FLEETS ARE FINANCED
3.1.5.1 DRIVER IMPACT ANALYSIS
3.2 RESTRAINTS
3.2.1 THE CERTIFIED INSPECTOR SHORTAGE CAPS HOW MUCH EQUIPMENT CAN BE SOLD
3.2.2 RADIOACTIVE SOURCE LICENSING IS PUSHING RADIOGRAPHY OUT OF FIELD WORK
3.2.3 CAPITAL DISCIPLINE IN OIL AND GAS TIES EQUIPMENT PURCHASES TO TURNAROUND CYCLES
3.2.4 PROBE AND SENSOR CUSTOMISATION BLOCKS VOLUME MANUFACTURING ECONOMICS
3.2.4.1 RESTRAINT IMPACT ANALYSIS
3.3 OPPORTUNITIES
3.3.1 EDDY-CURRENT ARRAY INSTRUMENTS PRICED FOR THE MID-TIER FABRICATOR
3.3.2 TRAINING SERVICES SOLD AS AN ATTACHED REVENUE LINE, NOT AN AFTERTHOUGHT
3.3.3 DIGITAL RADIOGRAPHY RETROFITS WHERE FILM AND ISOTOPE SOURCES ARE BEING RETIRED
3.3.4 MIDDLE EAST AND AFRICA INSPECTION CAPACITY ATTACHED TO NEW REFINING AND PETROCHEMICAL CAPACITY
3.3.4.1 OPPORTUNITY IMPACT ANALYSIS
3.4 CHALLENGES
3.4.1 CERTIFIED INSPECTOR SCARCITY CAPS HOW FAST CAPACITY CAN BE ADDED
3.4.1.1 RADIOGRAPHY LICENSING AND SOURCE LOGISTICS MAKE ONE METHOD STRUCTURALLY HARDER TO OPERATE
3.4.2 A FRAGMENTED SERVICE BASE COMPETES ON DAY RATE AGAINST A CONCENTRATED INSTRUMENT BASE
3.4.3 WORKING CAPITAL IS TRAPPED BETWEEN TURNAROUND TIMING AND PAYMENT TERMS
3.4.3.1 CHALLENGES IMPACT ANALYSIS
4 EMERGING TRENDS IN THE INDUSTRY
4.1 EDDY-CURRENT ARRAYS ARE TAKING SURFACE CRACK WORK AWAY FROM PENETRANT AND MAGNETIC PARTICLE
4.2 ROBOTS AND CONFINED-SPACE DRONES ARE CARRYING THE PROBE INSTEAD OF THE INSPECTOR
4.3 RADIOGRAPHY IS LEAVING FILM AND SEALED SOURCES FOR DETECTORS AND COMPUTED TOMOGRAPHY
4.4 PRIVATE CAPITAL IS CONSOLIDATING THE INSPECTION CHAIN AND MONETISING ITS SERVICE TAIL
4.5 CERTIFICATION SUPPLY, NOT EQUIPMENT SUPPLY, NOW SETS DELIVERABLE INSPECTION CAPACITY
5 EXECUTIVE SUMMARY
5.1 ASIA-PACIFIC NON-DESTRUCTIVE TESTING EQUIPMENT MARKET, 2018-2033 (USD MILLION)
5.2 ASIA-PACIFIC NON-DESTRUCTIVE TESTING EQUIPMENT MARKET: SEGMENTATION AT A GLANCE, 2025
6 PREMIUM INSIGHTS
6.1 PORTER'S FIVE FORCES ANALYSIS
6.2 PESTLE ANALYSIS
7 INNOVATION TRACKER AND STRATEGIC ANALYSIS
7.1 MAJOR DEALS AND STRATEGIC ALLIANCES ANALYSIS
7.1.1 MERGERS AND ACQUISITIONS
7.1.2 LICENSING AND PARTNERSHIP
7.1.3 TECHNOLOGY COLLABORATIONS
7.1.4 STRATEGIC DIVESTMENTS
7.2 NUMBER OF PRODUCTS IN DEVELOPMENT
7.2.1 ASIA-PACIFIC NON-DESTRUCTIVE TESTING EQUIPMENT MARKET: DISCLOSED DEVELOPMENT AND LAUNCH ACTIVITY
7.3 STAGE OF DEVELOPMENT
7.4 TIMELINES AND MILESTONES
7.5 INNOVATION STRATEGIES AND METHODOLOGIES
7.6 RISK ASSESSMENT AND MITIGATION
7.7 R&D PIPELINE
7.8 FUTURE OUTLOOK
8 PRICING ANALYSIS
8.1 KEY FACTORS INFLUENCING PRICING
8.2 TESTING METHOD PRICING TRENDS
8.3 REGIONAL PRICING DYNAMICS
8.4 TOTAL COST OF OWNERSHIP
8.5 FUTURE PRICING OUTLOOK
9 INDUSTRY ECOSYSTEM ANALYSIS
9.1 PROMINENT COMPANIES
9.2 SMALL & MEDIUM SIZE COMPANIES
9.3 END USERS
10 ASIA-PACIFIC NON-DESTRUCTIVE TESTING EQUIPMENT MARKET, BY TESTING METHOD, 2018–2033 (USD MILLION)
10.1 ASIA-PACIFIC NON-DESTRUCTIVE TESTING EQUIPMENT MARKET, BY TESTING METHOD: KEY FINDINGS
10.2 ASIA-PACIFIC NON-DESTRUCTIVE TESTING EQUIPMENT MARKET, BY TESTING METHOD, MARKET SHARE, 2025
10.3 ASIA-PACIFIC NON-DESTRUCTIVE TESTING EQUIPMENT MARKET, BY TESTING METHOD, 2018-2025 (USD MILLION)
10.4 ASIA-PACIFIC NON-DESTRUCTIVE TESTING EQUIPMENT MARKET, BY TESTING METHOD, 2026-2033 (USD MILLION)
10.5 OVERVIEW
10.6 ULTRASONIC TESTING
10.7 RADIOGRAPHY TESTING
10.8 VISUAL INSPECTION TESTING
10.9 MAGNETIC PARTICLE TESTING & ELECTROMAGNETIC TESTING
10.1 EDDY-CURRENT TESTING
10.11 LIQUID PENETRANT TESTING
10.12 OTHERS
11 ASIA-PACIFIC NON-DESTRUCTIVE TESTING EQUIPMENT MARKET, BY TECHNIQUE, 2018–2033 (USD MILLION)
11.1 ASIA-PACIFIC NON-DESTRUCTIVE TESTING EQUIPMENT MARKET, BY TECHNIQUE: KEY FINDINGS
11.2 ASIA-PACIFIC NON-DESTRUCTIVE TESTING EQUIPMENT MARKET, BY TECHNIQUE, MARKET SHARE, 2025
11.3 ASIA-PACIFIC NON-DESTRUCTIVE TESTING EQUIPMENT MARKET, BY TECHNIQUE, 2026-2033 (USD MILLION)
11.4 OVERVIEW
11.5 VOLUMETRIC EXAMINATION
11.6 SURFACE EXAMINATION
11.7 OTHERS
12 ASIA-PACIFIC NON-DESTRUCTIVE TESTING EQUIPMENT MARKET, BY OFFERING, 2018–2033 (USD MILLION)
12.1 ASIA-PACIFIC NON-DESTRUCTIVE TESTING EQUIPMENT MARKET, BY OFFERING: KEY FINDINGS
12.2 ASIA-PACIFIC NON-DESTRUCTIVE TESTING EQUIPMENT MARKET, BY OFFERING, MARKET SHARE, 2025
12.3 ASIA-PACIFIC NON-DESTRUCTIVE TESTING EQUIPMENT MARKET, BY OFFERING, 2026-2033 (USD MILLION)
12.4 OVERVIEW
12.5 EQUIPMENT
12.6 INSPECTION SERVICES
12.7 TRAINING SERVICES
12.8 EQUIPMENT RENTAL SERVICES
12.9 CALIBRATION SERVICES
13 ASIA-PACIFIC NON-DESTRUCTIVE TESTING EQUIPMENT MARKET, BY INDUSTRY VERTICAL, 2018–2033 (USD MILLION)
13.1 ASIA-PACIFIC NON-DESTRUCTIVE TESTING EQUIPMENT MARKET, BY INDUSTRY VERTICAL: KEY FINDINGS
13.2 ASIA-PACIFIC NON-DESTRUCTIVE TESTING EQUIPMENT MARKET, BY INDUSTRY VERTICAL, MARKET SHARE, 2025
13.3 ASIA-PACIFIC NON-DESTRUCTIVE TESTING EQUIPMENT MARKET, BY INDUSTRY VERTICAL, 2026-2033 (USD MILLION)
13.4 OVERVIEW
13.5 OIL AND GAS
13.6 ENERGY AND POWER
13.7 AEROSPACE AND DEFENSE
13.8 AUTOMOTIVE & TRANSPORTATION
13.9 INFRASTRUCTURE
13.1 OTHERS
14 ASIA-PACIFIC NON-DESTRUCTIVE TESTING EQUIPMENT MARKET, BY REGION, 2018–2033 (USD MILLION)
14.1 ASIA-PACIFIC NON-DESTRUCTIVE TESTING EQUIPMENT MARKET, BY REGION: KEY FINDINGS
14.1.1 ASIA-PACIFIC
14.1.1.1 ASIA-PACIFIC, BY COUNTRY, 2025
14.1.1.2 ASIA-PACIFIC, BY COUNTRY, 2018-2025 (USD MILLION)
14.1.1.3 ASIA-PACIFIC, BY COUNTRY, 2026-2033 (USD MILLION)
14.1.1.4 ASIA-PACIFIC, BY TESTING METHOD, 2018-2025 (USD MILLION)
14.1.1.5 ASIA-PACIFIC, BY TESTING METHOD, 2026-2033 (USD MILLION)
14.1.1.6 ASIA-PACIFIC, BY TECHNIQUE, 2018-2025 (USD MILLION)
14.1.1.7 ASIA-PACIFIC, BY TECHNIQUE, 2026-2033 (USD MILLION)
14.1.1.8 ASIA-PACIFIC, BY OFFERING, 2018-2025 (USD MILLION)
14.1.1.9 ASIA-PACIFIC, BY OFFERING, 2026-2033 (USD MILLION)
14.1.1.10 ASIA-PACIFIC, BY INDUSTRY VERTICAL, 2018-2025 (USD MILLION)
14.1.1.11 ASIA-PACIFIC, BY INDUSTRY VERTICAL, 2026-2033 (USD MILLION)
14.1.1.12 CHINA
14.1.1.12.1 CHINA, BY TESTING METHOD, 2018-2025 (USD MILLION)
14.1.1.12.2 CHINA, BY TESTING METHOD, 2026-2033 (USD MILLION)
14.1.1.12.3 CHINA, BY TECHNIQUE, 2018-2025 (USD MILLION)
14.1.1.12.4 CHINA, BY TECHNIQUE, 2026-2033 (USD MILLION)
14.1.1.12.5 CHINA, BY OFFERING, 2018-2025 (USD MILLION)
14.1.1.12.6 CHINA, BY OFFERING, 2026-2033 (USD MILLION)
14.1.1.12.7 CHINA, BY INDUSTRY VERTICAL, 2018-2025 (USD MILLION)
14.1.1.12.8 CHINA, BY INDUSTRY VERTICAL, 2026-2033 (USD MILLION)
14.1.1.13 JAPAN
14.1.1.13.1 JAPAN, BY TESTING METHOD, 2018-2025 (USD MILLION)
14.1.1.13.2 JAPAN, BY TESTING METHOD, 2026-2033 (USD MILLION)
14.1.1.13.3 JAPAN, BY TECHNIQUE, 2018-2025 (USD MILLION)
14.1.1.13.4 JAPAN, BY TECHNIQUE, 2026-2033 (USD MILLION)
14.1.1.13.5 JAPAN, BY OFFERING, 2018-2025 (USD MILLION)
14.1.1.13.6 JAPAN, BY OFFERING, 2026-2033 (USD MILLION)
14.1.1.13.7 JAPAN, BY INDUSTRY VERTICAL, 2018-2025 (USD MILLION)
14.1.1.13.8 JAPAN, BY INDUSTRY VERTICAL, 2026-2033 (USD MILLION)
14.1.1.14 SOUTH KOREA
14.1.1.14.1 SOUTH KOREA, BY TESTING METHOD, 2018-2025 (USD MILLION)
14.1.1.14.2 SOUTH KOREA, BY TESTING METHOD, 2026-2033 (USD MILLION)
14.1.1.14.3 SOUTH KOREA, BY TECHNIQUE, 2018-2025 (USD MILLION)
14.1.1.14.4 SOUTH KOREA, BY TECHNIQUE, 2026-2033 (USD MILLION)
14.1.1.14.5 SOUTH KOREA, BY OFFERING, 2018-2025 (USD MILLION)
14.1.1.14.6 SOUTH KOREA, BY OFFERING, 2026-2033 (USD MILLION)
14.1.1.14.7 SOUTH KOREA, BY INDUSTRY VERTICAL, 2018-2025 (USD MILLION)
14.1.1.14.8 SOUTH KOREA, BY INDUSTRY VERTICAL, 2026-2033 (USD MILLION)
14.1.1.15 INDIA
14.1.1.15.1 INDIA, BY TESTING METHOD, 2018-2025 (USD MILLION)
14.1.1.15.2 INDIA, BY TESTING METHOD, 2026-2033 (USD MILLION)
14.1.1.15.3 INDIA, BY TECHNIQUE, 2018-2025 (USD MILLION)
14.1.1.15.4 INDIA, BY TECHNIQUE, 2026-2033 (USD MILLION)
14.1.1.15.5 INDIA, BY OFFERING, 2018-2025 (USD MILLION)
14.1.1.15.6 INDIA, BY OFFERING, 2026-2033 (USD MILLION)
14.1.1.15.7 INDIA, BY INDUSTRY VERTICAL, 2018-2025 (USD MILLION)
14.1.1.15.8 INDIA, BY INDUSTRY VERTICAL, 2026-2033 (USD MILLION)
14.1.1.16 TAIWAN
14.1.1.16.1 TAIWAN, BY TESTING METHOD, 2018-2025 (USD MILLION)
14.1.1.16.2 TAIWAN, BY TESTING METHOD, 2026-2033 (USD MILLION)
14.1.1.16.3 TAIWAN, BY TECHNIQUE, 2018-2025 (USD MILLION)
14.1.1.16.4 TAIWAN, BY TECHNIQUE, 2026-2033 (USD MILLION)
14.1.1.16.5 TAIWAN, BY OFFERING, 2018-2025 (USD MILLION)
14.1.1.16.6 TAIWAN, BY OFFERING, 2026-2033 (USD MILLION)
14.1.1.16.7 TAIWAN, BY INDUSTRY VERTICAL, 2018-2025 (USD MILLION)
14.1.1.16.8 TAIWAN, BY INDUSTRY VERTICAL, 2026-2033 (USD MILLION)
14.1.1.17 SINGAPORE
14.1.1.17.1 SINGAPORE, BY TESTING METHOD, 2018-2025 (USD MILLION)
14.1.1.17.2 SINGAPORE, BY TESTING METHOD, 2026-2033 (USD MILLION)
14.1.1.17.3 SINGAPORE, BY TECHNIQUE, 2018-2025 (USD MILLION)
14.1.1.17.4 SINGAPORE, BY TECHNIQUE, 2026-2033 (USD MILLION)
14.1.1.17.5 SINGAPORE, BY OFFERING, 2018-2025 (USD MILLION)
14.1.1.17.6 SINGAPORE, BY OFFERING, 2026-2033 (USD MILLION)
14.1.1.17.7 SINGAPORE, BY INDUSTRY VERTICAL, 2018-2025 (USD MILLION)
14.1.1.17.8 SINGAPORE, BY INDUSTRY VERTICAL, 2026-2033 (USD MILLION)
14.1.1.18 MALAYSIA
14.1.1.18.1 MALAYSIA, BY TESTING METHOD, 2018-2025 (USD MILLION)
14.1.1.18.2 MALAYSIA, BY TESTING METHOD, 2026-2033 (USD MILLION)
14.1.1.18.3 MALAYSIA, BY TECHNIQUE, 2018-2025 (USD MILLION)
14.1.1.18.4 MALAYSIA, BY TECHNIQUE, 2026-2033 (USD MILLION)
14.1.1.18.5 MALAYSIA, BY OFFERING, 2018-2025 (USD MILLION)
14.1.1.18.6 MALAYSIA, BY OFFERING, 2026-2033 (USD MILLION)
14.1.1.18.7 MALAYSIA, BY INDUSTRY VERTICAL, 2018-2025 (USD MILLION)
14.1.1.18.8 MALAYSIA, BY INDUSTRY VERTICAL, 2026-2033 (USD MILLION)
14.1.1.19 AUSTRALIA
14.1.1.19.1 AUSTRALIA, BY TESTING METHOD, 2018-2025 (USD MILLION)
14.1.1.19.2 AUSTRALIA, BY TESTING METHOD, 2026-2033 (USD MILLION)
14.1.1.19.3 AUSTRALIA, BY TECHNIQUE, 2018-2025 (USD MILLION)
14.1.1.19.4 AUSTRALIA, BY TECHNIQUE, 2026-2033 (USD MILLION)
14.1.1.19.5 AUSTRALIA, BY OFFERING, 2018-2025 (USD MILLION)
14.1.1.19.6 AUSTRALIA, BY OFFERING, 2026-2033 (USD MILLION)
14.1.1.19.7 AUSTRALIA, BY INDUSTRY VERTICAL, 2018-2025 (USD MILLION)
14.1.1.19.8 AUSTRALIA, BY INDUSTRY VERTICAL, 2026-2033 (USD MILLION)
14.1.1.20 THAILAND
14.1.1.20.1 THAILAND, BY TESTING METHOD, 2018-2025 (USD MILLION)
14.1.1.20.2 THAILAND, BY TESTING METHOD, 2026-2033 (USD MILLION)
14.1.1.20.3 THAILAND, BY TECHNIQUE, 2018-2025 (USD MILLION)
14.1.1.20.4 THAILAND, BY TECHNIQUE, 2026-2033 (USD MILLION)
14.1.1.20.5 THAILAND, BY OFFERING, 2018-2025 (USD MILLION)
14.1.1.20.6 THAILAND, BY OFFERING, 2026-2033 (USD MILLION)
14.1.1.20.7 THAILAND, BY INDUSTRY VERTICAL, 2018-2025 (USD MILLION)
14.1.1.20.8 THAILAND, BY INDUSTRY VERTICAL, 2026-2033 (USD MILLION)
14.1.1.21 INDONESIA
14.1.1.21.1 INDONESIA, BY TESTING METHOD, 2018-2025 (USD MILLION)
14.1.1.21.2 INDONESIA, BY TESTING METHOD, 2026-2033 (USD MILLION)
14.1.1.21.3 INDONESIA, BY TECHNIQUE, 2018-2025 (USD MILLION)
14.1.1.21.4 INDONESIA, BY TECHNIQUE, 2026-2033 (USD MILLION)
14.1.1.21.5 INDONESIA, BY OFFERING, 2018-2025 (USD MILLION)
14.1.1.21.6 INDONESIA, BY OFFERING, 2026-2033 (USD MILLION)
14.1.1.21.7 INDONESIA, BY INDUSTRY VERTICAL, 2018-2025 (USD MILLION)
14.1.1.21.8 INDONESIA, BY INDUSTRY VERTICAL, 2026-2033 (USD MILLION)
14.1.1.22 PHILIPPINES
14.1.1.22.1 PHILIPPINES, BY TESTING METHOD, 2018-2025 (USD MILLION)
14.1.1.22.2 PHILIPPINES, BY TESTING METHOD, 2026-2033 (USD MILLION)
14.1.1.22.3 PHILIPPINES, BY TECHNIQUE, 2018-2025 (USD MILLION)
14.1.1.22.4 PHILIPPINES, BY TECHNIQUE, 2026-2033 (USD MILLION)
14.1.1.22.5 PHILIPPINES, BY OFFERING, 2018-2025 (USD MILLION)
14.1.1.22.6 PHILIPPINES, BY OFFERING, 2026-2033 (USD MILLION)
14.1.1.22.7 PHILIPPINES, BY INDUSTRY VERTICAL, 2018-2025 (USD MILLION)
14.1.1.22.8 PHILIPPINES, BY INDUSTRY VERTICAL, 2026-2033 (USD MILLION)
14.1.1.23 REST OF ASIA-PACIFIC
14.1.1.23.1 REST OF ASIA-PACIFIC, BY TESTING METHOD, 2018-2025 (USD MILLION)
14.1.1.23.2 REST OF ASIA-PACIFIC, BY TESTING METHOD, 2026-2033 (USD MILLION)
14.1.1.23.3 REST OF ASIA-PACIFIC, BY TECHNIQUE, 2018-2025 (USD MILLION)
14.1.1.23.4 REST OF ASIA-PACIFIC, BY TECHNIQUE, 2026-2033 (USD MILLION)
14.1.1.23.5 REST OF ASIA-PACIFIC, BY OFFERING, 2018-2025 (USD MILLION)
14.1.1.23.6 REST OF ASIA-PACIFIC, BY OFFERING, 2026-2033 (USD MILLION)
14.1.1.23.7 REST OF ASIA-PACIFIC, BY INDUSTRY VERTICAL, 2018-2025 (USD MILLION)
14.1.1.23.8 REST OF ASIA-PACIFIC, BY INDUSTRY VERTICAL, 2026-2033 (USD MILLION)
15 ASIA-PACIFIC NON-DESTRUCTIVE TESTING EQUIPMENT MARKET, COMPANY LANDSCAPE
15.1 COMPANY SHARE ANALYSIS: ASIA-PACIFIC
15.2 MERGERS & ACQUISITIONS
15.2.1 ASIA-PACIFIC NON-DESTRUCTIVE TESTING EQUIPMENT MARKET: MERGERS & ACQUISITIONS
15.3 NEW PRODUCT DEVELOPMENT & APPROVALS
15.3.1 ASIA-PACIFIC NON-DESTRUCTIVE TESTING EQUIPMENT MARKET: NEW PRODUCT DEVELOPMENT & APPROVALS
15.4 EXPANSIONS
15.4.1 ASIA-PACIFIC NON-DESTRUCTIVE TESTING EQUIPMENT MARKET: EXPANSIONS
15.5 PARTNERSHIP AND OTHER STRATEGIC DEVELOPMENTS
15.5.1 ASIA-PACIFIC NON-DESTRUCTIVE TESTING EQUIPMENT MARKET: PARTNERSHIP AND OTHER STRATEGIC DEVELOPMENTS
15.6 ASIA-PACIFIC NON-DESTRUCTIVE TESTING EQUIPMENT MARKET, SWOT ANALYSIS
15.6.1 ASIA-PACIFIC NON-DESTRUCTIVE TESTING EQUIPMENT: SWOT ANALYSIS
16 ASIA-PACIFIC NON-DESTRUCTIVE TESTING EQUIPMENT MARKET, COMPANY PROFILES
16.1 ASIA-PACIFIC COMPANIES
16.1.1 GE COMPANY LLC (USA)
16.1.1.1 GE COMPANY LLC (USA), SHARE OF THE ASIA-PACIFIC NON-DESTRUCTIVE TESTING EQUIPMENT MARKET, 2025
16.1.1.2 COMPANY OVERVIEW
16.1.1.2.1 GE COMPANY LLC (USA): COMPANY SNAPSHOT
16.1.1.3 GEOGRAPHIC PRESENCE
16.1.1.4 PRODUCT PORTFOLIO
16.1.1.4.1 GE COMPANY LLC (USA): PRODUCT PORTFOLIO
16.1.1.4.2 MAJOR DEALS
16.1.1.4.3 M&A
16.1.1.4.4 COLLABORATION
16.1.1.4.5 PRODUCT ACQUISITION
16.1.1.4.6 PRODUCTION CAPACITY EXPANSION
16.1.1.4.7 JOINT VENTURES
16.1.1.4.8 INNOVATIONS
16.1.1.4.9 PRODUCT LAUNCHES
16.1.1.4.10 EVENTS
16.1.1.4.11 CONFERENCES
16.1.1.4.12 SYMPOSIUMS
16.1.1.4.13 WEBINARS
16.1.1.4.14 OTHERS
16.1.2 OLYMPUS CORPORATION (JAPAN)
16.1.2.1 OLYMPUS CORPORATION (JAPAN), SHARE OF THE ASIA-PACIFIC NON-DESTRUCTIVE TESTING EQUIPMENT MARKET, 2025
16.1.2.2 COMPANY OVERVIEW
16.1.2.2.1 OLYMPUS CORPORATION (JAPAN): COMPANY SNAPSHOT
16.1.2.3 REVENUE ANALYSIS
16.1.2.4 GEOGRAPHIC PRESENCE
16.1.2.5 PRODUCT PORTFOLIO
16.1.2.5.1 OLYMPUS CORPORATION (JAPAN): PRODUCT PORTFOLIO
16.1.2.6 RECENT DEVELOPMENTS
16.1.2.6.1 OLYMPUS CORPORATION (JAPAN): RECENT DEVELOPMENTS
16.1.2.6.2 MAJOR DEALS
16.1.2.6.3 M&A
16.1.2.6.4 COLLABORATION
16.1.2.6.5 PRODUCT ACQUISITION
16.1.2.6.6 PRODUCTION CAPACITY EXPANSION
16.1.2.6.7 JOINT VENTURES
16.1.2.6.8 INNOVATIONS
16.1.2.6.9 PRODUCT LAUNCHES
16.1.2.7 RECENT NEWS
16.1.2.7.1 OLYMPUS CORPORATION (JAPAN): RECENT NEWS
16.1.2.7.2 EVENTS
16.1.2.7.3 CONFERENCES
16.1.2.7.4 SYMPOSIUMS
16.1.2.7.5 WEBINARS
16.1.2.7.6 OTHERS
16.1.3 YXLON INTERNATIONAL (GERMANY)
16.1.3.1 YXLON INTERNATIONAL (GERMANY), SHARE OF THE ASIA-PACIFIC NON-DESTRUCTIVE TESTING EQUIPMENT MARKET, 2025
16.1.3.2 COMPANY OVERVIEW
16.1.3.2.1 YXLON INTERNATIONAL (GERMANY): COMPANY SNAPSHOT
16.1.3.3 REVENUE ANALYSIS
16.1.3.4 GEOGRAPHIC PRESENCE
16.1.3.5 PRODUCT PORTFOLIO
16.1.3.5.1 YXLON INTERNATIONAL (GERMANY): PRODUCT PORTFOLIO
16.1.3.6 RECENT DEVELOPMENTS
16.1.3.6.1 YXLON INTERNATIONAL (GERMANY): RECENT DEVELOPMENTS
16.1.3.6.2 MAJOR DEALS
16.1.3.6.3 M&A
16.1.3.6.4 COLLABORATION
16.1.3.6.5 PRODUCT ACQUISITION
16.1.3.6.6 PRODUCTION CAPACITY EXPANSION
16.1.3.6.7 JOINT VENTURES
16.1.3.6.8 INNOVATIONS
16.1.3.6.9 PRODUCT LAUNCHES
16.1.3.7 RECENT NEWS
16.1.3.7.1 YXLON INTERNATIONAL (GERMANY): RECENT NEWS
16.1.3.7.2 EVENTS
16.1.3.7.3 CONFERENCES
16.1.3.7.4 SYMPOSIUMS
16.1.3.7.5 WEBINARS
16.1.3.7.6 OTHERS
16.1.4 MISTRAS GROUP, INC. (USA)
16.1.4.1 MISTRAS GROUP, INC. (USA), SHARE OF THE ASIA-PACIFIC NON-DESTRUCTIVE TESTING EQUIPMENT MARKET, 2025
16.1.4.2 COMPANY OVERVIEW
16.1.4.2.1 MISTRAS GROUP, INC. (USA): COMPANY SNAPSHOT
16.1.4.3 REVENUE ANALYSIS
16.1.4.4 GEOGRAPHIC PRESENCE
16.1.4.5 PRODUCT PORTFOLIO
16.1.4.5.1 MISTRAS GROUP, INC. (USA): PRODUCT PORTFOLIO
16.1.4.6 RECENT DEVELOPMENTS
16.1.4.6.1 MISTRAS GROUP, INC. (USA): RECENT DEVELOPMENTS
16.1.4.6.2 MAJOR DEALS
16.1.4.6.3 COLLABORATION
16.1.4.6.4 PRODUCTION CAPACITY EXPANSION
16.1.4.6.5 JOINT VENTURES
16.1.4.6.6 INNOVATIONS
16.1.4.6.7 PRODUCT LAUNCHES
16.1.4.7 RECENT NEWS
16.1.4.7.1 MISTRAS GROUP, INC. (USA): RECENT NEWS
16.1.4.7.2 EVENTS
16.1.4.7.3 CONFERENCES
16.1.4.7.4 SYMPOSIUMS
16.1.4.7.5 WEBINARS
16.1.4.7.6 OTHERS
16.1.5 ZETEC, INC. (USA)
16.1.5.1 ZETEC, INC. (USA), SHARE OF THE ASIA-PACIFIC NON-DESTRUCTIVE TESTING EQUIPMENT MARKET, 2025
16.1.5.2 COMPANY OVERVIEW
16.1.5.2.1 ZETEC, INC. (USA): COMPANY SNAPSHOT
16.1.5.3 REVENUE ANALYSIS
16.1.5.4 GEOGRAPHIC PRESENCE
16.1.5.5 PRODUCT PORTFOLIO
16.1.5.5.1 ZETEC, INC. (USA): PRODUCT PORTFOLIO
16.1.5.6 RECENT DEVELOPMENTS
16.1.5.6.1 ZETEC, INC. (USA): RECENT DEVELOPMENTS
16.1.5.6.2 MAJOR DEALS
16.1.5.6.3 M&A
16.1.5.6.4 COLLABORATION
16.1.5.6.5 PRODUCT ACQUISITION
16.1.5.6.6 PRODUCTION CAPACITY EXPANSION
16.1.5.6.7 JOINT VENTURES
16.1.5.6.8 INNOVATIONS
16.1.5.6.9 PRODUCT LAUNCHES
16.1.5.7 RECENT NEWS
16.1.5.7.1 ZETEC, INC. (USA): RECENT NEWS
16.1.5.7.2 EVENTS
16.1.5.7.3 CONFERENCES
16.1.5.7.4 SYMPOSIUMS
16.1.5.7.5 WEBINARS
16.1.5.7.6 OTHERS
16.1.6 FOERSTER HOLDING GMBH (GERMANY)
16.1.6.1 FOERSTER HOLDING GMBH (GERMANY), SHARE OF THE ASIA-PACIFIC NON-DESTRUCTIVE TESTING EQUIPMENT MARKET, 2025
16.1.6.2 COMPANY OVERVIEW
16.1.6.2.1 FOERSTER HOLDING GMBH (GERMANY): COMPANY SNAPSHOT
16.1.6.3 REVENUE ANALYSIS
16.1.6.4 GEOGRAPHIC PRESENCE
16.1.6.5 PRODUCT PORTFOLIO
16.1.6.5.1 FOERSTER HOLDING GMBH (GERMANY): PRODUCT PORTFOLIO
16.1.6.6 RECENT DEVELOPMENTS
16.1.6.6.1 FOERSTER HOLDING GMBH (GERMANY): RECENT DEVELOPMENTS
16.1.6.6.2 MAJOR DEALS
16.1.6.6.3 M&A
16.1.6.6.4 COLLABORATION
16.1.6.6.5 PRODUCT ACQUISITION
16.1.6.6.6 PRODUCTION CAPACITY EXPANSION
16.1.6.6.7 JOINT VENTURES
16.1.6.6.8 INNOVATIONS
16.1.6.6.9 PRODUCT LAUNCHES
16.1.6.7 RECENT NEWS
16.1.6.7.1 FOERSTER HOLDING GMBH (GERMANY): RECENT NEWS
16.1.6.7.2 EVENTS
16.1.6.7.3 CONFERENCES
16.1.6.7.4 SYMPOSIUMS
16.1.6.7.5 WEBINARS
16.1.6.7.6 OTHERS
16.1.7 NIKON METROLOGY NV (BELGIUM)
16.1.7.1 NIKON METROLOGY NV (BELGIUM), SHARE OF THE ASIA-PACIFIC NON-DESTRUCTIVE TESTING EQUIPMENT MARKET, 2025
16.1.7.2 COMPANY OVERVIEW
16.1.7.2.1 NIKON METROLOGY NV (BELGIUM): COMPANY SNAPSHOT
16.1.7.3 REVENUE ANALYSIS
16.1.7.4 GEOGRAPHIC PRESENCE
16.1.7.5 PRODUCT PORTFOLIO
16.1.7.5.1 NIKON METROLOGY NV (BELGIUM): PRODUCT PORTFOLIO
16.1.7.6 RECENT DEVELOPMENTS
16.1.7.6.1 NIKON METROLOGY NV (BELGIUM): RECENT DEVELOPMENTS
16.1.7.6.2 MAJOR DEALS
16.1.7.6.3 M&A
16.1.7.6.4 COLLABORATION
16.1.7.6.5 PRODUCT ACQUISITION
16.1.7.6.6 PRODUCTION CAPACITY EXPANSION
16.1.7.6.7 JOINT VENTURES
16.1.7.6.8 INNOVATIONS
16.1.7.6.9 PRODUCT LAUNCHES
16.1.7.7 RECENT NEWS
16.1.7.7.1 NIKON METROLOGY NV (BELGIUM): RECENT NEWS
16.1.7.7.2 EVENTS
16.1.7.7.3 CONFERENCES
16.1.7.7.4 WEBINARS
16.1.7.7.5 OTHERS
16.1.8 SGS GROUP (SGS SA) (SWITZERLAND)
16.1.8.1 SGS GROUP (SGS SA) (SWITZERLAND), SHARE OF THE ASIA-PACIFIC NON-DESTRUCTIVE TESTING EQUIPMENT MARKET, 2025
16.1.8.2 COMPANY OVERVIEW
16.1.8.2.1 SGS GROUP (SGS SA) (SWITZERLAND): COMPANY SNAPSHOT
16.1.8.3 REVENUE ANALYSIS
16.1.8.4 GEOGRAPHIC PRESENCE
16.1.8.5 PRODUCT PORTFOLIO
16.1.8.5.1 SGS GROUP (SGS SA) (SWITZERLAND): PRODUCT PORTFOLIO
16.1.8.6 RECENT DEVELOPMENTS
16.1.8.6.1 SGS GROUP (SGS SA) (SWITZERLAND): RECENT DEVELOPMENTS
16.1.8.6.2 MAJOR DEALS
16.1.8.6.3 M&A
16.1.8.6.4 COLLABORATION
16.1.8.6.5 PRODUCT ACQUISITION
16.1.8.6.6 PRODUCTION CAPACITY EXPANSION
16.1.8.6.7 JOINT VENTURES
16.1.8.6.8 INNOVATIONS
16.1.8.6.9 PRODUCT LAUNCHES
16.1.8.7 RECENT NEWS
16.1.8.7.1 SGS GROUP (SGS SA) (SWITZERLAND): RECENT NEWS
16.1.8.7.2 EVENTS
16.1.8.7.3 CONFERENCES
16.1.8.7.4 SYMPOSIUMS
16.1.8.7.5 WEBINARS
16.1.8.7.6 OTHERS
16.1.9 FUJIFILM HOLDINGS CORPORATION (JAPAN)
16.1.9.1 FUJIFILM HOLDINGS CORPORATION (JAPAN), SHARE OF THE ASIA-PACIFIC NON-DESTRUCTIVE TESTING EQUIPMENT MARKET, 2025
16.1.9.2 COMPANY OVERVIEW
16.1.9.2.1 FUJIFILM HOLDINGS CORPORATION (JAPAN): COMPANY SNAPSHOT
16.1.9.3 REVENUE ANALYSIS
16.1.9.4 GEOGRAPHIC PRESENCE
16.1.9.5 PRODUCT PORTFOLIO
16.1.9.5.1 FUJIFILM HOLDINGS CORPORATION (JAPAN): PRODUCT PORTFOLIO
16.1.9.5.2 MAJOR DEALS
16.1.9.5.3 M&A
16.1.9.5.4 COLLABORATION
16.1.9.5.5 PRODUCT ACQUISITION
16.1.9.5.6 PRODUCTION CAPACITY EXPANSION
16.1.9.5.7 JOINT VENTURES
16.1.9.5.8 INNOVATIONS
16.1.9.5.9 PRODUCT LAUNCHES
16.1.9.6 RECENT NEWS
16.1.9.6.1 FUJIFILM HOLDINGS CORPORATION (JAPAN): RECENT NEWS
16.1.9.6.2 EVENTS
16.1.9.6.3 CONFERENCES
16.1.9.6.4 SYMPOSIUMS
16.1.9.6.5 WEBINARS
16.1.9.6.6 OTHERS
16.1.10 BUREAU VERITAS S.A. (FRANCE)
16.1.10.1 BUREAU VERITAS S.A. (FRANCE), SHARE OF THE ASIA-PACIFIC NON-DESTRUCTIVE TESTING EQUIPMENT MARKET, 2025
16.1.10.2 COMPANY OVERVIEW
16.1.10.2.1 BUREAU VERITAS S.A. (FRANCE): COMPANY SNAPSHOT
16.1.10.3 REVENUE ANALYSIS
16.1.10.4 GEOGRAPHIC PRESENCE
16.1.10.5 PRODUCT PORTFOLIO
16.1.10.5.1 BUREAU VERITAS S.A. (FRANCE): PRODUCT PORTFOLIO
16.1.10.6 RECENT DEVELOPMENTS
16.1.10.6.1 BUREAU VERITAS S.A. (FRANCE): RECENT DEVELOPMENTS
16.1.10.6.2 MAJOR DEALS
16.1.10.6.3 M&A
16.1.10.6.4 COLLABORATION
16.1.10.6.5 PRODUCT ACQUISITION
16.1.10.6.6 PRODUCTION CAPACITY EXPANSION
16.1.10.6.7 JOINT VENTURES
16.1.10.6.8 INNOVATIONS
16.1.10.6.9 PRODUCT LAUNCHES
16.1.10.7 RECENT NEWS
16.1.10.7.1 BUREAU VERITAS S.A. (FRANCE): RECENT NEWS
16.1.10.7.2 CONFERENCES
16.1.10.7.3 SYMPOSIUMS
16.1.10.7.4 WEBINARS
16.1.10.7.5 OTHERS
16.1.11 ACUREN (CANADA)
16.1.11.1 ACUREN (CANADA), SHARE OF THE ASIA-PACIFIC NON-DESTRUCTIVE TESTING EQUIPMENT MARKET, 2025
16.1.11.2 COMPANY OVERVIEW
16.1.11.2.1 ACUREN (CANADA): COMPANY SNAPSHOT
16.1.11.3 REVENUE ANALYSIS
16.1.11.4 GEOGRAPHIC PRESENCE
16.1.11.5 PRODUCT PORTFOLIO
16.1.11.5.1 ACUREN (CANADA): PRODUCT PORTFOLIO
16.1.11.6 RECENT DEVELOPMENTS
16.1.11.6.1 ACUREN (CANADA): RECENT DEVELOPMENTS
16.1.11.6.2 MAJOR DEALS
16.1.11.6.3 M&A
16.1.11.6.4 COLLABORATION
16.1.11.6.5 PRODUCT ACQUISITION
16.1.11.6.6 PRODUCTION CAPACITY EXPANSION
16.1.11.6.7 JOINT VENTURES
16.1.11.6.8 INNOVATIONS
16.1.11.6.9 PRODUCT LAUNCHES
16.1.11.7 RECENT NEWS
16.1.11.7.1 ACUREN (CANADA): RECENT NEWS
16.1.11.7.2 EVENTS
16.1.11.7.3 CONFERENCES
16.1.11.7.4 SYMPOSIUMS
16.1.11.7.5 WEBINARS
16.1.11.7.6 OTHERS
16.1.12 NDT ASIA-PACIFIC (IRELAND)
16.1.12.1 NDT ASIA-PACIFIC (IRELAND), SHARE OF THE ASIA-PACIFIC NON-DESTRUCTIVE TESTING EQUIPMENT MARKET, 2025
16.1.12.2 COMPANY OVERVIEW
16.1.12.2.1 NDT ASIA-PACIFIC (IRELAND): COMPANY SNAPSHOT
16.1.12.3 REVENUE ANALYSIS
16.1.12.4 GEOGRAPHIC PRESENCE
16.1.12.5 PRODUCT PORTFOLIO
16.1.12.5.1 NDT ASIA-PACIFIC (IRELAND): PRODUCT PORTFOLIO
16.1.12.6 RECENT DEVELOPMENTS
16.1.12.6.1 NDT ASIA-PACIFIC (IRELAND): RECENT DEVELOPMENTS
16.1.12.6.2 MAJOR DEALS
16.1.12.6.3 M&A
16.1.12.6.4 COLLABORATION
16.1.12.6.5 PRODUCT ACQUISITION
16.1.12.6.6 JOINT VENTURES
16.1.12.6.7 INNOVATIONS
16.1.12.6.8 PRODUCT LAUNCHES
16.1.12.7 RECENT NEWS
16.1.12.7.1 NDT ASIA-PACIFIC (IRELAND): RECENT NEWS
16.1.12.7.2 EVENTS
16.1.12.7.3 CONFERENCES
16.1.12.7.4 SYMPOSIUMS
16.1.12.7.5 WEBINARS
16.1.12.7.6 OTHERS
16.1.13 CYGNUS INSTRUMENTS INC. (UNITED KINGDOM)
16.1.13.1 CYGNUS INSTRUMENTS INC. (UNITED KINGDOM), SHARE OF THE ASIA-PACIFIC NON-DESTRUCTIVE TESTING EQUIPMENT MARKET, 2025
16.1.13.2 COMPANY OVERVIEW
16.1.13.2.1 CYGNUS INSTRUMENTS INC. (UNITED KINGDOM): COMPANY SNAPSHOT
16.1.13.3 REVENUE ANALYSIS
16.1.13.4 GEOGRAPHIC PRESENCE
16.1.13.5 PRODUCT PORTFOLIO
16.1.13.5.1 CYGNUS INSTRUMENTS INC. (UNITED KINGDOM): PRODUCT PORTFOLIO
16.1.13.6 RECENT DEVELOPMENTS
16.1.13.6.1 CYGNUS INSTRUMENTS INC. (UNITED KINGDOM): RECENT DEVELOPMENTS
16.1.13.6.2 MAJOR DEALS
16.1.13.6.3 M&A
16.1.13.6.4 COLLABORATION
16.1.13.6.5 PRODUCT ACQUISITION
16.1.13.6.6 PRODUCTION CAPACITY EXPANSION
16.1.13.6.7 JOINT VENTURES
16.1.13.6.8 INNOVATIONS
16.1.13.6.9 PRODUCT LAUNCHES
16.1.13.7 RECENT NEWS
16.1.13.7.1 CYGNUS INSTRUMENTS INC. (UNITED KINGDOM): RECENT NEWS
16.1.13.7.2 EVENTS
16.1.13.7.3 CONFERENCES
16.1.13.7.4 SYMPOSIUMS
16.1.13.7.5 WEBINARS
16.1.13.7.6 OTHERS
16.1.14 MAGNAFLUX (USA)
16.1.14.1 MAGNAFLUX (USA), SHARE OF THE ASIA-PACIFIC NON-DESTRUCTIVE TESTING EQUIPMENT MARKET, 2025
16.1.14.2 COMPANY OVERVIEW
16.1.14.2.1 MAGNAFLUX (USA): COMPANY SNAPSHOT
16.1.14.3 REVENUE ANALYSIS
16.1.14.4 GEOGRAPHIC PRESENCE
16.1.14.5 PRODUCT PORTFOLIO
16.1.14.5.1 MAGNAFLUX (USA): PRODUCT PORTFOLIO
16.1.14.6 RECENT DEVELOPMENTS
16.1.14.6.1 MAGNAFLUX (USA): RECENT DEVELOPMENTS
16.1.14.6.2 MAJOR DEALS
16.1.14.6.3 M&A
16.1.14.6.4 COLLABORATION
16.1.14.6.5 PRODUCT ACQUISITION
16.1.14.6.6 PRODUCTION CAPACITY EXPANSION
16.1.14.6.7 JOINT VENTURES
16.1.14.6.8 INNOVATIONS
16.1.14.6.9 PRODUCT LAUNCHES
16.1.14.7 RECENT NEWS
16.1.14.7.1 MAGNAFLUX (USA): RECENT NEWS
16.1.14.7.2 EVENTS
16.1.14.7.3 CONFERENCES
16.1.14.7.4 SYMPOSIUMS
16.1.14.7.5 WEBINARS
16.1.14.7.6 OTHERS
16.1.15 EDDYFI (CANADA)
16.1.15.1 EDDYFI (CANADA), SHARE OF THE ASIA-PACIFIC NON-DESTRUCTIVE TESTING EQUIPMENT MARKET, 2025
16.1.15.2 COMPANY OVERVIEW
16.1.15.2.1 EDDYFI (CANADA): COMPANY SNAPSHOT
16.1.15.3 REVENUE ANALYSIS
16.1.15.4 GEOGRAPHIC PRESENCE
16.1.15.5 PRODUCT PORTFOLIO
16.1.15.5.1 EDDYFI (CANADA): PRODUCT PORTFOLIO
16.1.15.6 RECENT DEVELOPMENTS
16.1.15.6.1 EDDYFI (CANADA): RECENT DEVELOPMENTS
16.1.15.6.2 MAJOR DEALS
16.1.15.6.3 M&A
16.1.15.6.4 COLLABORATION
16.1.15.6.5 PRODUCT ACQUISITION
16.1.15.6.6 PRODUCTION CAPACITY EXPANSION
16.1.15.6.7 JOINT VENTURES
16.1.15.6.8 INNOVATIONS
16.1.15.6.9 PRODUCT LAUNCHES
16.1.15.7 RECENT NEWS
16.1.15.7.1 EDDYFI (CANADA): RECENT NEWS
16.1.15.7.2 EVENTS
16.1.15.7.3 CONFERENCES
16.1.15.7.4 SYMPOSIUMS
16.1.15.7.5 WEBINARS
16.1.15.7.6 OTHERS
16.1.16 BOSELLO HIGH TECHNOLOGY SRL (ITALY)
16.1.16.1 BOSELLO HIGH TECHNOLOGY SRL (ITALY), SHARE OF THE ASIA-PACIFIC NON-DESTRUCTIVE TESTING EQUIPMENT MARKET, 2025
16.1.16.2 COMPANY OVERVIEW
16.1.16.2.1 BOSELLO HIGH TECHNOLOGY SRL (ITALY): COMPANY SNAPSHOT
16.1.16.3 REVENUE ANALYSIS
16.1.16.4 GEOGRAPHIC PRESENCE
16.1.16.5 PRODUCT PORTFOLIO
16.1.16.5.1 BOSELLO HIGH TECHNOLOGY SRL (ITALY): PRODUCT PORTFOLIO
16.1.16.6 RECENT DEVELOPMENTS
16.1.16.6.1 BOSELLO HIGH TECHNOLOGY SRL (ITALY): RECENT DEVELOPMENTS
16.1.16.6.2 MAJOR DEALS
16.1.16.6.3 M&A
16.1.16.6.4 COLLABORATION
16.1.16.6.5 PRODUCT ACQUISITION
16.1.16.6.6 PRODUCTION CAPACITY EXPANSION
16.1.16.6.7 JOINT VENTURES
16.1.16.6.8 INNOVATIONS
16.1.16.6.9 PRODUCT LAUNCHES
16.1.16.7 RECENT NEWS
16.1.16.7.1 BOSELLO HIGH TECHNOLOGY SRL (ITALY): RECENT NEWS
16.1.16.7.2 EVENTS
16.1.16.7.3 CONFERENCES
16.1.16.7.4 SYMPOSIUMS
16.1.16.7.5 WEBINARS
16.1.16.7.6 OTHERS
16.1.17 T.D. WILLIAMSON, INC.(USA)
16.1.17.1 T.D. WILLIAMSON, INC.(USA), SHARE OF THE ASIA-PACIFIC NON-DESTRUCTIVE TESTING EQUIPMENT MARKET, 2025
16.1.17.2 COMPANY OVERVIEW
16.1.17.2.1 T.D. WILLIAMSON, INC.(USA): COMPANY SNAPSHOT
16.1.17.3 REVENUE ANALYSIS
16.1.17.4 GEOGRAPHIC PRESENCE
16.1.17.5 PRODUCT PORTFOLIO
16.1.17.5.1 T.D. WILLIAMSON, INC.(USA): PRODUCT PORTFOLIO
16.1.17.6 RECENT DEVELOPMENTS
16.1.17.6.1 T.D. WILLIAMSON, INC.(USA): RECENT DEVELOPMENTS
16.1.17.6.2 MAJOR DEALS
16.1.17.6.3 M&A
16.1.17.6.4 COLLABORATION
16.1.17.6.5 PRODUCT ACQUISITION
16.1.17.6.6 PRODUCTION CAPACITY EXPANSION
16.1.17.6.7 JOINT VENTURES
16.1.17.6.8 INNOVATIONS
16.1.17.6.9 PRODUCT LAUNCHES
16.1.17.7 RECENT NEWS
16.1.17.7.1 T.D. WILLIAMSON, INC.(USA): RECENT NEWS
16.1.17.7.2 EVENTS
16.1.17.7.3 CONFERENCES
16.1.17.7.4 SYMPOSIUMS
16.1.17.7.5 WEBINARS
16.1.17.7.6 OTHERS
16.1.18 SONASPECTION (USA)
16.1.18.1 SONASPECTION (USA), SHARE OF THE ASIA-PACIFIC NON-DESTRUCTIVE TESTING EQUIPMENT MARKET, 2025
16.1.18.2 COMPANY OVERVIEW
16.1.18.2.1 SONASPECTION (USA): COMPANY SNAPSHOT
16.1.18.3 REVENUE ANALYSIS
16.1.18.4 GEOGRAPHIC PRESENCE
16.1.18.5 PRODUCT PORTFOLIO
16.1.18.5.1 SONASPECTION (USA): PRODUCT PORTFOLIO
16.1.18.6 RECENT DEVELOPMENTS
16.1.18.6.1 SONASPECTION (USA): RECENT DEVELOPMENTS
16.1.18.6.2 MAJOR DEALS
16.1.18.6.3 M&A
16.1.18.6.4 COLLABORATION
16.1.18.6.5 PRODUCT ACQUISITION
16.1.18.6.6 PRODUCTION CAPACITY EXPANSION
16.1.18.6.7 JOINT VENTURES
16.1.18.6.8 INNOVATIONS
16.1.18.7 RECENT NEWS
16.1.18.7.1 SONASPECTION (USA): RECENT NEWS
16.1.18.7.2 EVENTS
16.1.18.7.3 CONFERENCES
16.1.18.7.4 SYMPOSIUMS
16.1.18.7.5 WEBINARS
16.1.18.7.6 OTHERS
16.1.19 LYNX INSPECTION (USA)
16.1.19.1 LYNX INSPECTION (USA), SHARE OF THE ASIA-PACIFIC NON-DESTRUCTIVE TESTING EQUIPMENT MARKET, 2025
16.1.19.2 COMPANY OVERVIEW
16.1.19.2.1 LYNX INSPECTION (USA): COMPANY SNAPSHOT
16.1.19.3 REVENUE ANALYSIS
16.1.19.4 GEOGRAPHIC PRESENCE
16.1.19.5 PRODUCT PORTFOLIO
16.1.19.5.1 LYNX INSPECTION (USA): PRODUCT PORTFOLIO
16.1.19.6 RECENT DEVELOPMENTS
16.1.19.6.1 LYNX INSPECTION (USA): RECENT DEVELOPMENTS
16.1.19.6.2 MAJOR DEALS
16.1.19.6.3 M&A
16.1.19.6.4 COLLABORATION
16.1.19.6.5 PRODUCT ACQUISITION
16.1.19.6.6 PRODUCTION CAPACITY EXPANSION
16.1.19.6.7 JOINT VENTURES
16.1.19.6.8 INNOVATIONS
16.1.19.6.9 PRODUCT LAUNCHES
16.1.19.7 RECENT NEWS
16.1.19.7.1 LYNX INSPECTION (USA): RECENT NEWS
16.1.19.7.2 EVENTS
16.1.19.7.3 CONFERENCES
16.1.19.7.4 SYMPOSIUMS
16.1.19.7.5 WEBINARS
16.1.19.7.6 OTHERS
16.1.20 FISCHER TECHNOLOGY, INC. (USA)
16.1.20.1 FISCHER TECHNOLOGY, INC. (USA), SHARE OF THE ASIA-PACIFIC NON-DESTRUCTIVE TESTING EQUIPMENT MARKET, 2025
16.1.20.2 COMPANY OVERVIEW
16.1.20.2.1 FISCHER TECHNOLOGY, INC. (USA): COMPANY SNAPSHOT
16.1.20.3 REVENUE ANALYSIS
16.1.20.4 GEOGRAPHIC PRESENCE
16.1.20.5 PRODUCT PORTFOLIO
16.1.20.5.1 FISCHER TECHNOLOGY, INC. (USA): PRODUCT PORTFOLIO
16.1.20.6 RECENT DEVELOPMENTS
16.1.20.6.1 FISCHER TECHNOLOGY, INC. (USA): RECENT DEVELOPMENTS
16.1.20.6.2 MAJOR DEALS
16.1.20.6.3 M&A
16.1.20.6.4 COLLABORATION
16.1.20.6.5 PRODUCT ACQUISITION
16.1.20.6.6 PRODUCTION CAPACITY EXPANSION
16.1.20.6.7 JOINT VENTURES
16.1.20.6.8 INNOVATIONS
16.1.20.6.9 PRODUCT LAUNCHES
16.1.20.7 RECENT NEWS
16.1.20.7.1 FISCHER TECHNOLOGY, INC. (USA): RECENT NEWS
16.1.20.7.2 EVENTS
16.1.20.7.3 CONFERENCES
16.1.20.7.4 SYMPOSIUMS
16.1.20.7.5 WEBINARS
16.1.20.7.6 OTHERS
17 QUESTIONNAIRE
18 RELATED REPORTS
List of Table
TABLE 1 ASIA-PACIFIC NON-DESTRUCTIVE TESTING EQUIPMENT MARKET: RESEARCH SNAPSHOT
TABLE 2 IMPACT TABLE: DRIVER IMPACT ANALYSIS
TABLE 3 IMPACT TABLE: RESTRAINT IMPACT ANALYSIS
TABLE 4 IMPACT TABLE: OPPORTUNITY IMPACT ANALYSIS
TABLE 5 IMPACT TABLE: CHALLENGES IMPACT ANALYSIS
TABLE 6 KEY INDUSTRY TRENDS AND THEIR IMPACT ON THE ASIA-PACIFIC NON-DESTRUCTIVE TESTING (NDT) MARKET, 2018–2033
TABLE 7 ASIA-PACIFIC NON-DESTRUCTIVE TESTING EQUIPMENT MARKET: DISCLOSED DEVELOPMENT AND LAUNCH ACTIVITY
TABLE 8 ASIA-PACIFIC NON-DESTRUCTIVE TESTING EQUIPMENT MARKET: PROMINENT COMPANIES
TABLE 9 ASIA-PACIFIC NON-DESTRUCTIVE TESTING EQUIPMENT MARKET: SMALL AND MEDIUM SIZE COMPANIES
TABLE 10 ASIA-PACIFIC NON-DESTRUCTIVE TESTING EQUIPMENT MARKET: END USERS AND THEIR PURCHASE DRIVERS
TABLE 11 ASIA-PACIFIC NON-DESTRUCTIVE TESTING EQUIPMENT MARKET, BY TESTING METHOD, 2018-2025 (USD MILLION)
TABLE 12 ASIA-PACIFIC NON-DESTRUCTIVE TESTING EQUIPMENT MARKET, BY TESTING METHOD, 2026-2033 (USD MILLION)
TABLE 13 ASIA-PACIFIC NON-DESTRUCTIVE TESTING EQUIPMENT MARKET, BY TECHNIQUE, 2018-2025 (USD MILLION)
TABLE 14 ASIA-PACIFIC NON-DESTRUCTIVE TESTING EQUIPMENT MARKET, BY TECHNIQUE, 2026-2033 (USD MILLION)
TABLE 15 ASIA-PACIFIC NON-DESTRUCTIVE TESTING EQUIPMENT MARKET, BY OFFERING, 2018-2025 (USD MILLION)
TABLE 16 ASIA-PACIFIC NON-DESTRUCTIVE TESTING EQUIPMENT MARKET, BY OFFERING, 2026-2033 (USD MILLION)
TABLE 17 ASIA-PACIFIC NON-DESTRUCTIVE TESTING EQUIPMENT MARKET, BY INDUSTRY VERTICAL, 2018-2025 (USD MILLION)
TABLE 18 ASIA-PACIFIC NON-DESTRUCTIVE TESTING EQUIPMENT MARKET, BY INDUSTRY VERTICAL, 2026-2033 (USD MILLION)
TABLE 19 ASIA-PACIFIC, BY COUNTRY, 2018-2025 (USD MILLION)
TABLE 20 ASIA-PACIFIC, BY COUNTRY, 2026-2033 (USD MILLION)
TABLE 21 ASIA-PACIFIC, BY TESTING METHOD, 2018-2025 (USD MILLION)
TABLE 22 ASIA-PACIFIC, BY TESTING METHOD, 2026-2033 (USD MILLION)
TABLE 23 ASIA-PACIFIC, BY TECHNIQUE, 2018-2025 (USD MILLION)
TABLE 24 ASIA-PACIFIC, BY TECHNIQUE, 2026-2033 (USD MILLION)
TABLE 25 ASIA-PACIFIC, BY OFFERING, 2018-2025 (USD MILLION)
TABLE 26 ASIA-PACIFIC, BY OFFERING, 2026-2033 (USD MILLION)
TABLE 27 ASIA-PACIFIC, BY INDUSTRY VERTICAL, 2018-2025 (USD MILLION)
TABLE 28 ASIA-PACIFIC, BY INDUSTRY VERTICAL, 2026-2033 (USD MILLION)
TABLE 29 CHINA, BY TESTING METHOD, 2018-2025 (USD MILLION)
TABLE 30 CHINA, BY TESTING METHOD, 2026-2033 (USD MILLION)
TABLE 31 CHINA, BY TECHNIQUE, 2018-2025 (USD MILLION)
TABLE 32 CHINA, BY TECHNIQUE, 2026-2033 (USD MILLION)
TABLE 33 CHINA, BY OFFERING, 2018-2025 (USD MILLION)
TABLE 34 CHINA, BY OFFERING, 2026-2033 (USD MILLION)
TABLE 35 CHINA, BY INDUSTRY VERTICAL, 2018-2025 (USD MILLION)
TABLE 36 CHINA, BY INDUSTRY VERTICAL, 2026-2033 (USD MILLION)
TABLE 37 JAPAN, BY TESTING METHOD, 2018-2025 (USD MILLION)
TABLE 38 JAPAN, BY TESTING METHOD, 2026-2033 (USD MILLION)
TABLE 39 JAPAN, BY TECHNIQUE, 2018-2025 (USD MILLION)
TABLE 40 JAPAN, BY TECHNIQUE, 2026-2033 (USD MILLION)
TABLE 41 JAPAN, BY OFFERING, 2018-2025 (USD MILLION)
TABLE 42 JAPAN, BY OFFERING, 2026-2033 (USD MILLION)
TABLE 43 JAPAN, BY INDUSTRY VERTICAL, 2018-2025 (USD MILLION)
TABLE 44 JAPAN, BY INDUSTRY VERTICAL, 2026-2033 (USD MILLION)
TABLE 45 SOUTH KOREA, BY TESTING METHOD, 2018-2025 (USD MILLION)
TABLE 46 SOUTH KOREA, BY TESTING METHOD, 2026-2033 (USD MILLION)
TABLE 47 SOUTH KOREA, BY TECHNIQUE, 2018-2025 (USD MILLION)
TABLE 48 SOUTH KOREA, BY TECHNIQUE, 2026-2033 (USD MILLION)
TABLE 49 SOUTH KOREA, BY OFFERING, 2018-2025 (USD MILLION)
TABLE 50 SOUTH KOREA, BY OFFERING, 2026-2033 (USD MILLION)
TABLE 51 SOUTH KOREA, BY INDUSTRY VERTICAL, 2018-2025 (USD MILLION)
TABLE 52 SOUTH KOREA, BY INDUSTRY VERTICAL, 2026-2033 (USD MILLION)
TABLE 53 INDIA, BY TESTING METHOD, 2018-2025 (USD MILLION)
TABLE 54 INDIA, BY TESTING METHOD, 2026-2033 (USD MILLION)
TABLE 55 INDIA, BY TECHNIQUE, 2018-2025 (USD MILLION)
TABLE 56 INDIA, BY TECHNIQUE, 2026-2033 (USD MILLION)
TABLE 57 INDIA, BY OFFERING, 2018-2025 (USD MILLION)
TABLE 58 INDIA, BY OFFERING, 2026-2033 (USD MILLION)
TABLE 59 INDIA, BY INDUSTRY VERTICAL, 2018-2025 (USD MILLION)
TABLE 60 INDIA, BY INDUSTRY VERTICAL, 2026-2033 (USD MILLION)
TABLE 61 TAIWAN, BY TESTING METHOD, 2018-2025 (USD MILLION)
TABLE 62 TAIWAN, BY TESTING METHOD, 2026-2033 (USD MILLION)
TABLE 63 TAIWAN, BY TECHNIQUE, 2018-2025 (USD MILLION)
TABLE 64 TAIWAN, BY TECHNIQUE, 2026-2033 (USD MILLION)
TABLE 65 TAIWAN, BY OFFERING, 2018-2025 (USD MILLION)
TABLE 66 TAIWAN, BY OFFERING, 2026-2033 (USD MILLION)
TABLE 67 TAIWAN, BY INDUSTRY VERTICAL, 2018-2025 (USD MILLION)
TABLE 68 TAIWAN, BY INDUSTRY VERTICAL, 2026-2033 (USD MILLION)
TABLE 69 SINGAPORE, BY TESTING METHOD, 2018-2025 (USD MILLION)
TABLE 70 SINGAPORE, BY TESTING METHOD, 2026-2033 (USD MILLION)
TABLE 71 SINGAPORE, BY TECHNIQUE, 2018-2025 (USD MILLION)
TABLE 72 SINGAPORE, BY TECHNIQUE, 2026-2033 (USD MILLION)
TABLE 73 SINGAPORE, BY OFFERING, 2018-2025 (USD MILLION)
TABLE 74 SINGAPORE, BY OFFERING, 2026-2033 (USD MILLION)
TABLE 75 SINGAPORE, BY INDUSTRY VERTICAL, 2018-2025 (USD MILLION)
TABLE 76 SINGAPORE, BY INDUSTRY VERTICAL, 2026-2033 (USD MILLION)
TABLE 77 MALAYSIA, BY TESTING METHOD, 2018-2025 (USD MILLION)
TABLE 78 MALAYSIA, BY TESTING METHOD, 2026-2033 (USD MILLION)
TABLE 79 MALAYSIA, BY TECHNIQUE, 2018-2025 (USD MILLION)
TABLE 80 MALAYSIA, BY TECHNIQUE, 2026-2033 (USD MILLION)
TABLE 81 MALAYSIA, BY OFFERING, 2018-2025 (USD MILLION)
TABLE 82 MALAYSIA, BY OFFERING, 2026-2033 (USD MILLION)
TABLE 83 MALAYSIA, BY INDUSTRY VERTICAL, 2018-2025 (USD MILLION)
TABLE 84 MALAYSIA, BY INDUSTRY VERTICAL, 2026-2033 (USD MILLION)
TABLE 85 AUSTRALIA, BY TESTING METHOD, 2018-2025 (USD MILLION)
TABLE 86 AUSTRALIA, BY TESTING METHOD, 2026-2033 (USD MILLION)
TABLE 87 AUSTRALIA, BY TECHNIQUE, 2018-2025 (USD MILLION)
TABLE 88 AUSTRALIA, BY TECHNIQUE, 2026-2033 (USD MILLION)
TABLE 89 AUSTRALIA, BY OFFERING, 2018-2025 (USD MILLION)
TABLE 90 AUSTRALIA, BY OFFERING, 2026-2033 (USD MILLION)
TABLE 91 AUSTRALIA, BY INDUSTRY VERTICAL, 2018-2025 (USD MILLION)
TABLE 92 AUSTRALIA, BY INDUSTRY VERTICAL, 2026-2033 (USD MILLION)
TABLE 93 THAILAND, BY TESTING METHOD, 2018-2025 (USD MILLION)
TABLE 94 THAILAND, BY TESTING METHOD, 2026-2033 (USD MILLION)
TABLE 95 THAILAND, BY TECHNIQUE, 2018-2025 (USD MILLION)
TABLE 96 THAILAND, BY TECHNIQUE, 2026-2033 (USD MILLION)
TABLE 97 THAILAND, BY OFFERING, 2018-2025 (USD MILLION)
TABLE 98 THAILAND, BY OFFERING, 2026-2033 (USD MILLION)
TABLE 99 THAILAND, BY INDUSTRY VERTICAL, 2018-2025 (USD MILLION)
TABLE 100 THAILAND, BY INDUSTRY VERTICAL, 2026-2033 (USD MILLION)
TABLE 101 INDONESIA, BY TESTING METHOD, 2018-2025 (USD MILLION)
TABLE 102 INDONESIA, BY TESTING METHOD, 2026-2033 (USD MILLION)
TABLE 103 INDONESIA, BY TECHNIQUE, 2018-2025 (USD MILLION)
TABLE 104 INDONESIA, BY TECHNIQUE, 2026-2033 (USD MILLION)
TABLE 105 INDONESIA, BY OFFERING, 2018-2025 (USD MILLION)
TABLE 106 INDONESIA, BY OFFERING, 2026-2033 (USD MILLION)
TABLE 107 INDONESIA, BY INDUSTRY VERTICAL, 2018-2025 (USD MILLION)
TABLE 108 INDONESIA, BY INDUSTRY VERTICAL, 2026-2033 (USD MILLION)
TABLE 109 PHILIPPINES, BY TESTING METHOD, 2018-2025 (USD MILLION)
TABLE 110 PHILIPPINES, BY TESTING METHOD, 2026-2033 (USD MILLION)
TABLE 111 PHILIPPINES, BY TECHNIQUE, 2018-2025 (USD MILLION)
TABLE 112 PHILIPPINES, BY TECHNIQUE, 2026-2033 (USD MILLION)
TABLE 113 PHILIPPINES, BY OFFERING, 2018-2025 (USD MILLION)
TABLE 114 PHILIPPINES, BY OFFERING, 2026-2033 (USD MILLION)
TABLE 115 PHILIPPINES, BY INDUSTRY VERTICAL, 2018-2025 (USD MILLION)
TABLE 116 PHILIPPINES, BY INDUSTRY VERTICAL, 2026-2033 (USD MILLION)
TABLE 117 REST OF ASIA-PACIFIC, BY TESTING METHOD, 2018-2025 (USD MILLION)
TABLE 118 REST OF ASIA-PACIFIC, BY TESTING METHOD, 2026-2033 (USD MILLION)
TABLE 119 REST OF ASIA-PACIFIC, BY TECHNIQUE, 2018-2025 (USD MILLION)
TABLE 120 REST OF ASIA-PACIFIC, BY TECHNIQUE, 2026-2033 (USD MILLION)
TABLE 121 REST OF ASIA-PACIFIC, BY OFFERING, 2018-2025 (USD MILLION)
TABLE 122 REST OF ASIA-PACIFIC, BY OFFERING, 2026-2033 (USD MILLION)
TABLE 123 REST OF ASIA-PACIFIC, BY INDUSTRY VERTICAL, 2018-2025 (USD MILLION)
TABLE 124 REST OF ASIA-PACIFIC, BY INDUSTRY VERTICAL, 2026-2033 (USD MILLION)
TABLE 125 ASIA-PACIFIC NON-DESTRUCTIVE TESTING EQUIPMENT MARKET: ESTIMATED COMPANY SHARE, NON-DESTRUCTIVE, 2025
TABLE 126 ASIA-PACIFIC NON-DESTRUCTIVE TESTING EQUIPMENT MARKET: MERGERS & ACQUISITIONS
TABLE 127 ASIA-PACIFIC NON-DESTRUCTIVE TESTING EQUIPMENT MARKET: NEW PRODUCT DEVELOPMENT & APPROVALS
TABLE 128 ASIA-PACIFIC NON-DESTRUCTIVE TESTING EQUIPMENT MARKET: EXPANSIONS
TABLE 129 ASIA-PACIFIC NON-DESTRUCTIVE TESTING EQUIPMENT MARKET: PARTNERSHIP AND OTHER STRATEGIC DEVELOPMENTS
TABLE 130 GE COMPANY LLC (USA): PRODUCT PORTFOLIO
TABLE 131 OLYMPUS CORPORATION (JAPAN): PRODUCT PORTFOLIO
TABLE 132 OLYMPUS CORPORATION (JAPAN): RECENT DEVELOPMENTS
TABLE 133 OLYMPUS CORPORATION (JAPAN): RECENT NEWS
TABLE 134 YXLON INTERNATIONAL (GERMANY): PRODUCT PORTFOLIO
TABLE 135 YXLON INTERNATIONAL (GERMANY): RECENT DEVELOPMENTS
TABLE 136 YXLON INTERNATIONAL (GERMANY): RECENT NEWS
TABLE 137 MISTRAS GROUP, INC. (USA): PRODUCT PORTFOLIO
TABLE 138 MISTRAS GROUP, INC. (USA): RECENT DEVELOPMENTS
TABLE 139 MISTRAS GROUP, INC. (USA): RECENT NEWS
TABLE 140 ZETEC, INC. (USA): PRODUCT PORTFOLIO
TABLE 141 ZETEC, INC. (USA): RECENT DEVELOPMENTS
TABLE 142 ZETEC, INC. (USA): RECENT NEWS
TABLE 143 FOERSTER HOLDING GMBH (GERMANY): PRODUCT PORTFOLIO
TABLE 144 FOERSTER HOLDING GMBH (GERMANY): RECENT DEVELOPMENTS
TABLE 145 FOERSTER HOLDING GMBH (GERMANY): RECENT NEWS
TABLE 146 NIKON METROLOGY NV (BELGIUM): PRODUCT PORTFOLIO
TABLE 147 NIKON METROLOGY NV (BELGIUM): RECENT DEVELOPMENTS
TABLE 148 NIKON METROLOGY NV (BELGIUM): RECENT NEWS
TABLE 149 SGS GROUP (SGS SA) (SWITZERLAND): PRODUCT PORTFOLIO
TABLE 150 SGS GROUP (SGS SA) (SWITZERLAND): RECENT DEVELOPMENTS
TABLE 151 SGS GROUP (SGS SA) (SWITZERLAND): RECENT NEWS
TABLE 152 FUJIFILM HOLDINGS CORPORATION (JAPAN): PRODUCT PORTFOLIO
TABLE 153 FUJIFILM HOLDINGS CORPORATION (JAPAN): RECENT NEWS
TABLE 154 BUREAU VERITAS S.A. (FRANCE): PRODUCT PORTFOLIO
TABLE 155 BUREAU VERITAS S.A. (FRANCE): RECENT DEVELOPMENTS
TABLE 156 BUREAU VERITAS S.A. (FRANCE): RECENT NEWS
TABLE 157 ACUREN (CANADA): PRODUCT PORTFOLIO
TABLE 158 ACUREN (CANADA): RECENT DEVELOPMENTS
TABLE 159 ACUREN (CANADA): RECENT NEWS
TABLE 160 NDT ASIA-PACIFIC (IRELAND): PRODUCT PORTFOLIO
TABLE 161 NDT ASIA-PACIFIC (IRELAND): RECENT DEVELOPMENTS
TABLE 162 NDT ASIA-PACIFIC (IRELAND): RECENT NEWS
TABLE 163 CYGNUS INSTRUMENTS INC. (UNITED KINGDOM): PRODUCT PORTFOLIO
TABLE 164 CYGNUS INSTRUMENTS INC. (UNITED KINGDOM): RECENT DEVELOPMENTS
TABLE 165 CYGNUS INSTRUMENTS INC. (UNITED KINGDOM): RECENT NEWS
TABLE 166 MAGNAFLUX (USA): PRODUCT PORTFOLIO
TABLE 167 MAGNAFLUX (USA): RECENT DEVELOPMENTS
TABLE 168 MAGNAFLUX (USA): RECENT NEWS
TABLE 169 EDDYFI (CANADA): PRODUCT PORTFOLIO
TABLE 170 EDDYFI (CANADA): RECENT DEVELOPMENTS
TABLE 171 EDDYFI (CANADA): RECENT NEWS
TABLE 172 BOSELLO HIGH TECHNOLOGY SRL (ITALY): PRODUCT PORTFOLIO
TABLE 173 BOSELLO HIGH TECHNOLOGY SRL (ITALY): RECENT DEVELOPMENTS
TABLE 174 BOSELLO HIGH TECHNOLOGY SRL (ITALY): RECENT NEWS
TABLE 175 T.D. WILLIAMSON, INC.(USA): PRODUCT PORTFOLIO
TABLE 176 T.D. WILLIAMSON, INC.(USA): RECENT DEVELOPMENTS
TABLE 177 T.D. WILLIAMSON, INC.(USA): RECENT NEWS
TABLE 178 SONASPECTION (USA): PRODUCT PORTFOLIO
TABLE 179 SONASPECTION (USA): RECENT DEVELOPMENTS
TABLE 180 SONASPECTION (USA): RECENT NEWS
TABLE 181 LYNX INSPECTION (USA): PRODUCT PORTFOLIO
TABLE 182 LYNX INSPECTION (USA): RECENT DEVELOPMENTS
TABLE 183 LYNX INSPECTION (USA): RECENT NEWS
TABLE 184 FISCHER TECHNOLOGY, INC. (USA): PRODUCT PORTFOLIO
TABLE 185 FISCHER TECHNOLOGY, INC. (USA): RECENT DEVELOPMENTS
TABLE 186 FISCHER TECHNOLOGY, INC. (USA): RECENT NEWS
List of Figure
FIGURE 1 ASIA-PACIFIC NON-DESTRUCTIVE TESTING EQUIPMENT MARKET: SEGMENTATION
FIGURE 2 ASIA-PACIFIC NON-DESTRUCTIVE TESTING EQUIPMENT MARKET: GEOGRAPHIC SCOPE
FIGURE 3 YEARS CONSIDERED FOR THE STUDY
FIGURE 4 ASIA-PACIFIC NON-DESTRUCTIVE TESTING EQUIPMENT MARKET: PRIMARY AND SECONDARY RESOURCES
FIGURE 5 ASIA-PACIFIC NON-DESTRUCTIVE TESTING EQUIPMENT MARKET, DROC ANALYSIS
FIGURE 6 ASIA-PACIFIC NON-DESTRUCTIVE TESTING EQUIPMENT MARKET, ASIA-PACIFIC VS REGIONAL MARKET
FIGURE 7 ASIA-PACIFIC NON-DESTRUCTIVE TESTING EQUIPMENT MARKET, ARRIVING AT THE MARKET SIZE
FIGURE 8 PRIMARY INTERVIEWS, BY DESIGNATION
FIGURE 9 PRIMARY INTERVIEWS, BY GEOGRAPHY
FIGURE 10 ASIA-PACIFIC NON-DESTRUCTIVE TESTING EQUIPMENT MARKET: DBMR MARKET POSITION GRID
FIGURE 11 MARKET COVERAGE GRID: ROUTES TO MARKET EVIDENCED IN PUBLISHED SOURCES
FIGURE 12 ASIA-PACIFIC NON-DESTRUCTIVE TESTING EQUIPMENT: MARKET OVERVIEW
FIGURE 13 IMPACT TABLE: DRIVER IMPACT ANALYSIS
FIGURE 14 ASIA-PACIFIC NON-DESTRUCTIVE TESTING EQUIPMENT MARKET, 2018-2033 (USD MILLION)
FIGURE 15 ASIA-PACIFIC NON-DESTRUCTIVE TESTING EQUIPMENT MARKET: SEGMENTATION AT A GLANCE, 2025
FIGURE 16 ASIA-PACIFIC NON-DESTRUCTIVE TESTING EQUIPMENT MARKET: PORTER'S FIVE FORCES
FIGURE 17 ASIA-PACIFIC NON-DESTRUCTIVE TESTING EQUIPMENT MARKET: PESTLE ANALYSIS
FIGURE 18 ASIA-PACIFIC NON-DESTRUCTIVE TESTING EQUIPMENT MARKET: STRATEGIC INITIATIVES
FIGURE 19 ASIA-PACIFIC NON-DESTRUCTIVE TESTING EQUIPMENT MARKET, BY TESTING METHOD: KEY FINDINGS
FIGURE 20 ASIA-PACIFIC NON-DESTRUCTIVE TESTING EQUIPMENT MARKET, BY TESTING METHOD, 2025
FIGURE 21 ASIA-PACIFIC NON-DESTRUCTIVE TESTING EQUIPMENT MARKET, BY TESTING METHOD, 2033 (USD MILLION)
FIGURE 22 ASIA-PACIFIC NON-DESTRUCTIVE TESTING EQUIPMENT MARKET, BY TECHNIQUE: KEY FINDINGS
FIGURE 23 ASIA-PACIFIC NON-DESTRUCTIVE TESTING EQUIPMENT MARKET, BY TECHNIQUE, 2025
FIGURE 24 ASIA-PACIFIC NON-DESTRUCTIVE TESTING EQUIPMENT MARKET, BY TECHNIQUE, 2033 (USD MILLION)
FIGURE 25 ASIA-PACIFIC NON-DESTRUCTIVE TESTING EQUIPMENT MARKET, BY OFFERING: KEY FINDINGS
FIGURE 26 ASIA-PACIFIC NON-DESTRUCTIVE TESTING EQUIPMENT MARKET, BY OFFERING, 2025
FIGURE 27 ASIA-PACIFIC NON-DESTRUCTIVE TESTING EQUIPMENT MARKET, BY OFFERING, 2033 (USD MILLION)
FIGURE 28 ASIA-PACIFIC NON-DESTRUCTIVE TESTING EQUIPMENT MARKET, BY INDUSTRY VERTICAL: KEY FINDINGS
FIGURE 29 ASIA-PACIFIC NON-DESTRUCTIVE TESTING EQUIPMENT MARKET, BY INDUSTRY VERTICAL, 2025
FIGURE 30 ASIA-PACIFIC NON-DESTRUCTIVE TESTING EQUIPMENT MARKET, BY INDUSTRY VERTICAL, 2033 (USD MILLION)
FIGURE 31 ASIA-PACIFIC NON-DESTRUCTIVE TESTING EQUIPMENT MARKET, BY REGION: KEY FINDINGS
FIGURE 32 ASIA-PACIFIC, BY COUNTRY, 2025
FIGURE 33 ASIA-PACIFIC NON-DESTRUCTIVE TESTING EQUIPMENT: SWOT ANALYSIS
FIGURE 34 GE COMPANY LLC (USA), SHARE OF THE ASIA-PACIFIC NON-DESTRUCTIVE TESTING EQUIPMENT MARKET, 2025
FIGURE 35 GE COMPANY LLC (USA): COMPANY SNAPSHOT
FIGURE 36 OLYMPUS CORPORATION (JAPAN), SHARE OF THE ASIA-PACIFIC NON-DESTRUCTIVE TESTING EQUIPMENT MARKET, 2025
FIGURE 37 OLYMPUS CORPORATION (JAPAN): COMPANY SNAPSHOT
FIGURE 38 YXLON INTERNATIONAL (GERMANY), SHARE OF THE ASIA-PACIFIC NON-DESTRUCTIVE TESTING EQUIPMENT MARKET, 2025
FIGURE 39 YXLON INTERNATIONAL (GERMANY): COMPANY SNAPSHOT
FIGURE 40 MISTRAS GROUP, INC. (USA), SHARE OF THE ASIA-PACIFIC NON-DESTRUCTIVE TESTING EQUIPMENT MARKET, 2025
FIGURE 41 MISTRAS GROUP, INC. (USA): COMPANY SNAPSHOT
FIGURE 42 ZETEC, INC. (USA), SHARE OF THE ASIA-PACIFIC NON-DESTRUCTIVE TESTING EQUIPMENT MARKET, 2025
FIGURE 43 ZETEC, INC. (USA): COMPANY SNAPSHOT
FIGURE 44 FOERSTER HOLDING GMBH (GERMANY), SHARE OF THE ASIA-PACIFIC NON-DESTRUCTIVE TESTING EQUIPMENT MARKET, 2025
FIGURE 45 FOERSTER HOLDING GMBH (GERMANY): COMPANY SNAPSHOT
FIGURE 46 NIKON METROLOGY NV (BELGIUM), SHARE OF THE ASIA-PACIFIC NON-DESTRUCTIVE TESTING EQUIPMENT MARKET, 2025
FIGURE 47 NIKON METROLOGY NV (BELGIUM): COMPANY SNAPSHOT
FIGURE 48 SGS GROUP (SGS SA) (SWITZERLAND), SHARE OF THE ASIA-PACIFIC NON-DESTRUCTIVE TESTING EQUIPMENT MARKET, 2025
FIGURE 49 SGS GROUP (SGS SA) (SWITZERLAND): COMPANY SNAPSHOT
FIGURE 50 FUJIFILM HOLDINGS CORPORATION (JAPAN), SHARE OF THE ASIA-PACIFIC NON-DESTRUCTIVE TESTING EQUIPMENT MARKET, 2025
FIGURE 51 FUJIFILM HOLDINGS CORPORATION (JAPAN): COMPANY SNAPSHOT
FIGURE 52 BUREAU VERITAS S.A. (FRANCE), SHARE OF THE ASIA-PACIFIC NON-DESTRUCTIVE TESTING EQUIPMENT MARKET, 2025
FIGURE 53 BUREAU VERITAS S.A. (FRANCE): COMPANY SNAPSHOT
FIGURE 54 ACUREN (CANADA), SHARE OF THE ASIA-PACIFIC NON-DESTRUCTIVE TESTING EQUIPMENT MARKET, 2025
FIGURE 55 ACUREN (CANADA): COMPANY SNAPSHOT
FIGURE 56 NDT ASIA-PACIFIC (IRELAND), SHARE OF THE ASIA-PACIFIC NON-DESTRUCTIVE TESTING EQUIPMENT MARKET, 2025
FIGURE 57 NDT ASIA-PACIFIC (IRELAND): COMPANY SNAPSHOT
FIGURE 58 CYGNUS INSTRUMENTS INC. (UNITED KINGDOM), SHARE OF THE ASIA-PACIFIC NON-DESTRUCTIVE TESTING EQUIPMENT MARKET, 2025
FIGURE 59 CYGNUS INSTRUMENTS INC. (UNITED KINGDOM): COMPANY SNAPSHOT
FIGURE 60 MAGNAFLUX (USA), SHARE OF THE ASIA-PACIFIC NON-DESTRUCTIVE TESTING EQUIPMENT MARKET, 2025
FIGURE 61 MAGNAFLUX (USA): COMPANY SNAPSHOT
FIGURE 62 EDDYFI (CANADA), SHARE OF THE ASIA-PACIFIC NON-DESTRUCTIVE TESTING EQUIPMENT MARKET, 2025
FIGURE 63 EDDYFI (CANADA): COMPANY SNAPSHOT
FIGURE 64 BOSELLO HIGH TECHNOLOGY SRL (ITALY), SHARE OF THE ASIA-PACIFIC NON-DESTRUCTIVE TESTING EQUIPMENT MARKET, 2025
FIGURE 65 BOSELLO HIGH TECHNOLOGY SRL (ITALY): COMPANY SNAPSHOT
FIGURE 66 T.D. WILLIAMSON, INC.(USA), SHARE OF THE ASIA-PACIFIC NON-DESTRUCTIVE TESTING EQUIPMENT MARKET, 2025
FIGURE 67 T.D. WILLIAMSON, INC.(USA): COMPANY SNAPSHOT
FIGURE 68 SONASPECTION (USA), SHARE OF THE ASIA-PACIFIC NON-DESTRUCTIVE TESTING EQUIPMENT MARKET, 2025
FIGURE 69 SONASPECTION (USA): COMPANY SNAPSHOT
FIGURE 70 LYNX INSPECTION (USA), SHARE OF THE ASIA-PACIFIC NON-DESTRUCTIVE TESTING EQUIPMENT MARKET, 2025
FIGURE 71 LYNX INSPECTION (USA): COMPANY SNAPSHOT
FIGURE 72 FISCHER TECHNOLOGY, INC. (USA), SHARE OF THE ASIA-PACIFIC NON-DESTRUCTIVE TESTING EQUIPMENT MARKET, 2025
FIGURE 73 FISCHER TECHNOLOGY, INC. (USA): COMPANY SNAPSHOT

Asia Pacific Non Destructive Testing Equipment Market, Supply Chain Analysis and Ecosystem Framework
To support market growth and help clients navigate the impact of geopolitical shifts, DBMR has integrated in-depth supply chain analysis into its Asia Pacific Non Destructive Testing Equipment Market research reports. This addition empowers clients to respond effectively to global changes affecting their industries. The supply chain analysis section includes detailed insights such as Asia Pacific Non Destructive Testing Equipment Market consumption and production by country, price trend analysis, the impact of tariffs and geopolitical developments, and import and export trends by country and HSN code. It also highlights major suppliers with data on production capacity and company profiles, as well as key importers and exporters. In addition to research, DBMR offers specialized supply chain consulting services backed by over a decade of experience, providing solutions like supplier discovery, supplier risk assessment, price trend analysis, impact evaluation of inflation and trade route changes, and comprehensive market trend analysis.
Data collection and base year analysis are done using data collection modules with large sample sizes. The stage includes obtaining market information or related data through various sources and strategies. It includes examining and planning all the data acquired from the past in advance. It likewise envelops the examination of information inconsistencies seen across different information sources. The market data is analysed and estimated using market statistical and coherent models. Also, market share analysis and key trend analysis are the major success factors in the market report. To know more, please request an analyst call or drop down your inquiry.
The key research methodology used by DBMR research team is data triangulation which involves data mining, analysis of the impact of data variables on the market and primary (industry expert) validation. Data models include Vendor Positioning Grid, Market Time Line Analysis, Market Overview and Guide, Company Positioning Grid, Patent Analysis, Pricing Analysis, Company Market Share Analysis, Standards of Measurement, Global versus Regional and Vendor Share Analysis. To know more about the research methodology, drop in an inquiry to speak to our industry experts.
Data Bridge Market Research is a leader in advanced formative research. We take pride in servicing our existing and new customers with data and analysis that match and suits their goal. The report can be customized to include price trend analysis of target brands understanding the market for additional countries (ask for the list of countries), clinical trial results data, literature review, refurbished market and product base analysis. Market analysis of target competitors can be analyzed from technology-based analysis to market portfolio strategies. We can add as many competitors that you require data about in the format and data style you are looking for. Our team of analysts can also provide you data in crude raw excel files pivot tables (Fact book) or can assist you in creating presentations from the data sets available in the report.