
Asia Pacific Optical Power Meter Market
Market Size in USD Thousand
 USD
51,933.30 Thousand
USD
87,483.66 Thousand
2022
2030
USD
51,933.30 Thousand
USD
87,483.66 Thousand
2022
2030
| 2023 - 2030 | |
| USD 51,933.30 Thousand | |
| USD 87,483.66 Thousand | |
| % | |
|
Asia-Pacific Optical Power Meter Market Analysis and Size
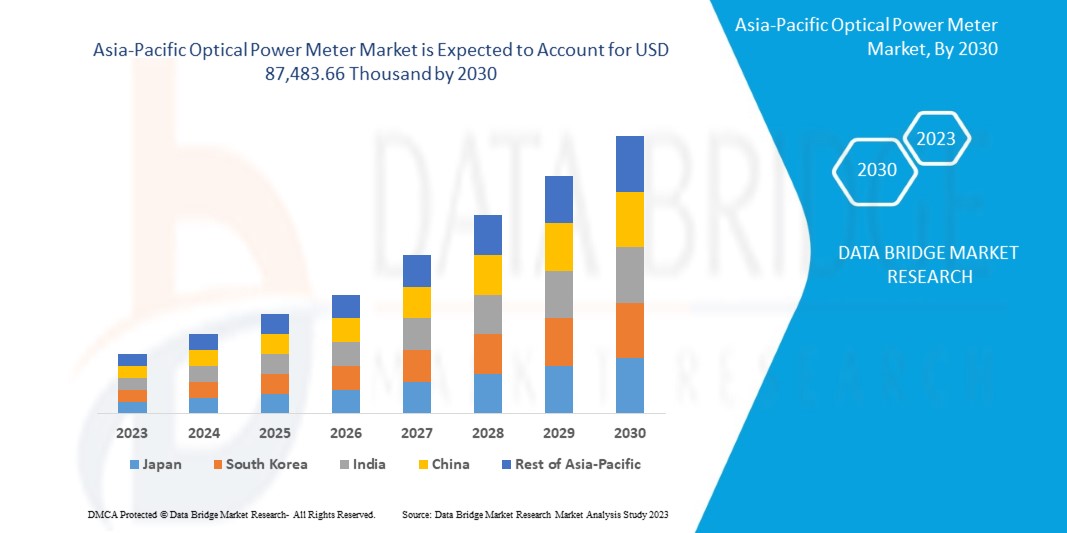
Asia-Pacific has witnessed high growth in the optical power meter market as countries such as China and Japan are witnessing high adoption of optical power meters, which is increasing the demand for optical power meter systems.
The Asia-Pacific optical power meter market is expected to gain market growth in the forecast period of 2023 to 2030. Data Bridge Market Research analyzes that the Asia-Pacific optical power meter market is expected to reach USD 87,483.66 thousand by 2030 from USD 51,933.30 thousand in 2022, growing with a substantial CAGR of 6.9% in the forecast period of 2023 to 2030.
|
Report Metric |
Details |
|
Forecast Period |
2023 to 2030 |
|
Base Year |
2022 |
|
Historic Years |
2021 (Customizable to 2015-2020) |
|
Quantitative Units |
Revenue in USD Thousand |
|
Segments Covered |
Type (Thermal Detectors and Photo Detectors), Instrument/Product Type (Benchtop Meter, Portable Meter, Virtual Meter, Optical Wavelength, Hand-Held Meter, and Others), Detector Type (InGaAs (Indium Gallium Arsenide), Germanium, Silicon, and Others), Power Range (High, Medium, and Low), Wavelength (850 NM to 1650 NM and 400 NM to 1100 NM), Light Source (LASER and LED), Application (Installation & Maintenance, Testing, Manufacturing, Research & Development, and Others), End-User (Telecommunication Industry, Electrical and Electronics Industry, Automotive Industry, Military & Aerospace Industry, Energy & Utilities Industry, and Others) |
|
Countries Covered |
Japan, China, South Korea, India, Australia, Singapore, Thailand, Malaysia, Indonesia, Philippines, New Zealand, Taiwan, Vietnam, and Rest of Asia-Pacific |
|
Market Players Covered |
ADC CORPORATION, AFL (A subsidiary of Fujikura, Ltd.), Anritsu, APEX Technologies, Artifex Engineering GmbH & Co KG., BIOPTIC CO.,LTD, ComSonics, Deviser Instruments, Incorporated, Edmund Optics Inc., EXFO Inc., Fluke Corporation, GAO Tek & GAO Group Inc., HIOKI E.E. CORPORATION, JOINWIT, Jonard Tools, Keysight Technologies, Kingfisher International, Newport Corporation (A subsidiary of MKS Instruments), Ophir Optronics Solutions Ltd, OZ Optics Ltd., PDR World, Santec Corporation, Stanlay, Thorlabs, Inc., VIAVI Solutions Inc., and Yokogawa Test & Measurement Corporation among others |
Market Definition
An optical power meter is a device that measures electricity and power in an optical signal. It is used to test the average amount of power in fiber optic networks and systems. It consists of a combination and integration of a calibrated sensor, display, and measuring amplifier and display which measures and monitors a range of wavelengths and power levels.
There are two types of optical power meters: thermal detectors and photodetectors. Thermal detectors are a type of optical power meter wherein temperature rise caused by optical radiation is measured. A photodetector measures power levels as low as 1 pW (90 dBm). The main advantage of optical power measurement by using an optical power meter is its easy-to-use feature and low bandwidth requirement for electronics products.
Asia Pacific Optical Power Meter Market Dynamics
This section deals with understanding the market drivers, opportunities, restraints, and challenges. All of this is discussed in detail below:
Drivers
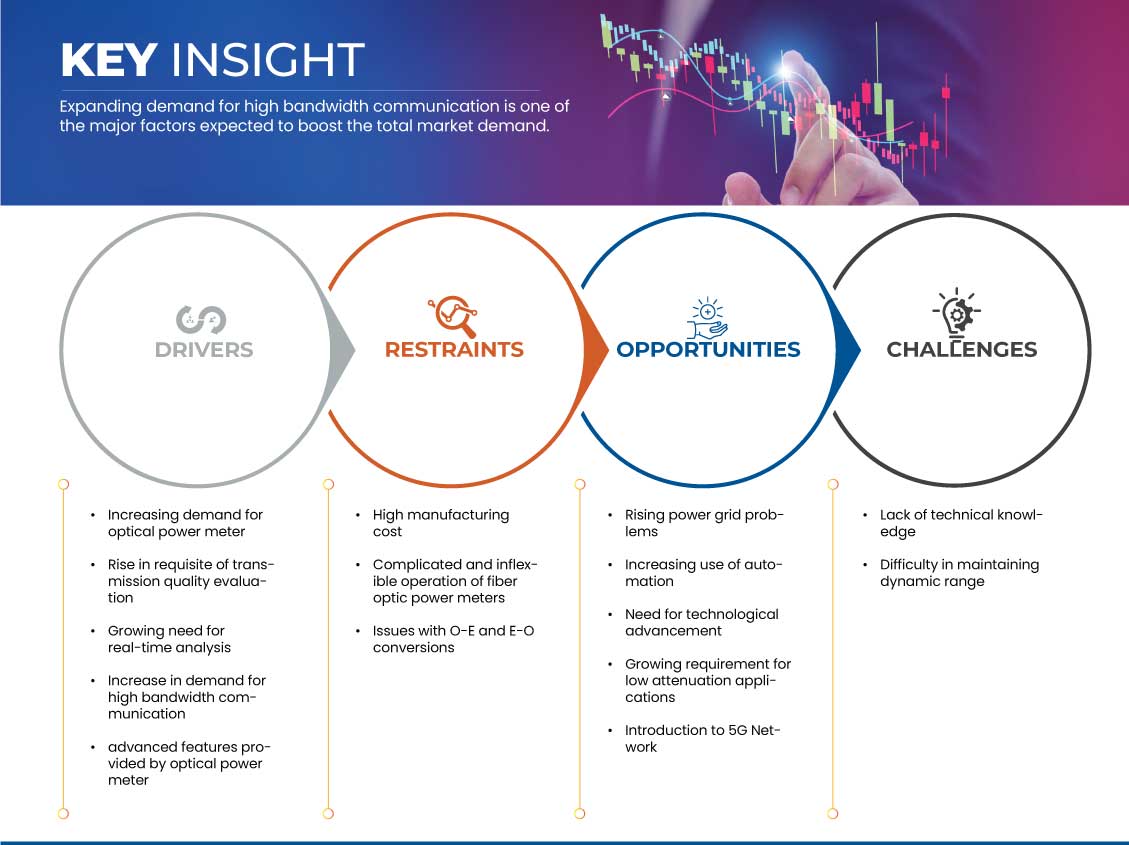
- Increasing Demand for Optical Power Meters
An optical power meter is a device that measures electricity and power in an optical signal. It is used to test the average amount of power in fiber optic networks and systems. It is a combination and integration of a calibrated sensor, display, and measuring amplifier, which measures and monitors the range of wavelengths and power levels. It also helps to determine the power loss incurred by the optical signal while passing through the optical media.
The Asia-Pacific optical power meter market is expected to witness significant growth in the coming years due to the increasing demand for optical power meters. They are widely used in the telecommunication industry, as they provide accurate measurements of the optical power of a fiber-optic cable or system.
- Rise in Requisite of Transmission Quality Evaluation
The transmission network is an important factor in the communication network to provide better consumer services. For the evaluation and monitoring of the quality of the transmission network, there is no general standard. One of the main aims on which the telecommunication industry has a major focus is to transmit signals through the cables with the least disruption, maximum capacity, least noise, low energy consumption, and optimal transmission quality.
Nowadays, different traffic-consumptive services such as ultra HD videos, 3D Televisions, online commerce, cloud computing, and others increase the demand of internet consumers for IP traffic.
These access applications led to the use of fixed wireless network antennas, key security, mobile network base stations, and monitoring & measuring structures, which then require higher information and data throughput. Consequently, the increase of the transport capacity of access networks becomes crucial for internet service providers. The transmission wires are exposed to external conditions, and many factors can lead to miscalibration. So, it is important to regularly evaluate the transmission quality, including the evaluation of power within the cables through optical power meters.
Opportunity
- Rising Power Grid Problems
A power grid, also referred to as an electrical grid, is an interconnected network structure for delivering electricity and power from producers to consumers for daily usage. It consists of three stages: generation, transmission, and distribution. Power plants convert mechanical energy into electrical energy by the use of a generator. Electrical transmission is carried out with the use of power lines. The distribution process connects substations from large industrial buildings to small homes to provide electricity for them.
There are lots of factors that contribute to the increasing power grid problems worldwide, which creates the need for regular maintenance and monitoring and to keep backup units in prime condition with the use of power meters. Thus, rising power grid problems are expected to provide an opportunity for market growth.
Restraint/Challenge
- Lack of Technical Knowledge
Increasing technological advances, new innovations, and digitization of business processes are making it difficult for workers, employees, and staff to match their skill sets with the needs of growing and technologically updated operations.
This creates a skill gap between the staff and the business. There is a shortage of skilled technical expertise with relevant qualifications and knowledge as technology upgrades day by day.
As computers get upgraded with smarter and innovative solutions, they become more capable of performing tasks that were earlier performed by humans, so the employees and staff will need to develop and upgrade the skill set that will provide them the advantage over computer machines such as critical thinking, innovations, and creativity.
The optical power meters fall under semiconductors and require substantial technical knowledge regarding units, conversions, and others, which makes it difficult for regular staff to operate power meters.
Recent Developments
- In March 2023, Santec Corporation released OPM-200 power meter. With a dynamic range of +8dBm to -80dBm, this high-performance optical power meter is intended to deliver exact measurements. This product launch helped the company to cater to a large market and get recognition in the Asia-Pacific region
- In January 2023, Thorlabs, Inc. announced the acquisition of JML Optical Industries. This step is expected to allow the company to develop its custom designing and manufacturing of precision optics hardware and components, which in return will boost its dominance in the optical power meter market
- In April 2022, Ophir Optronics Solutions Ltd announced the release of Ophir BeamPeek, High Power Laser Beam Analysis and Power Measurement System for Additive Manufacturing. It can tolerate harsh chamber conditions, such as residual metal powder and the absence of cooling agents or airflow connection points. This launch helped to increase the revenue of the company
- In March 2022, OZ Optics Ltd. received regulatory certification for many test equipment and sensor products. CSA-C22.2 NO. 61010-1-12 and UL 61010-1 certification for Safety criteria for electrical equipment used in laboratories, measurement, and control, CE Certification confirms that the product complies with all EU health, safety, and environmental standards. This certification helped the company increase its customer base and company sales
- In December 2020, VIAVI Solutions Inc. unveiled the VIAVI Optimeter, a novel kind of network testing equipment. VIAVI Optimeter provides uncomplicated FTTx certification and troubleshooting by combining the functions of a broadband or GPON/XG(S)-PON power meter with fiber certification and connection inspection. This product launch helped to cater to a wide range of markets and customers
Asia Pacific Optical Power Meter Market Scope
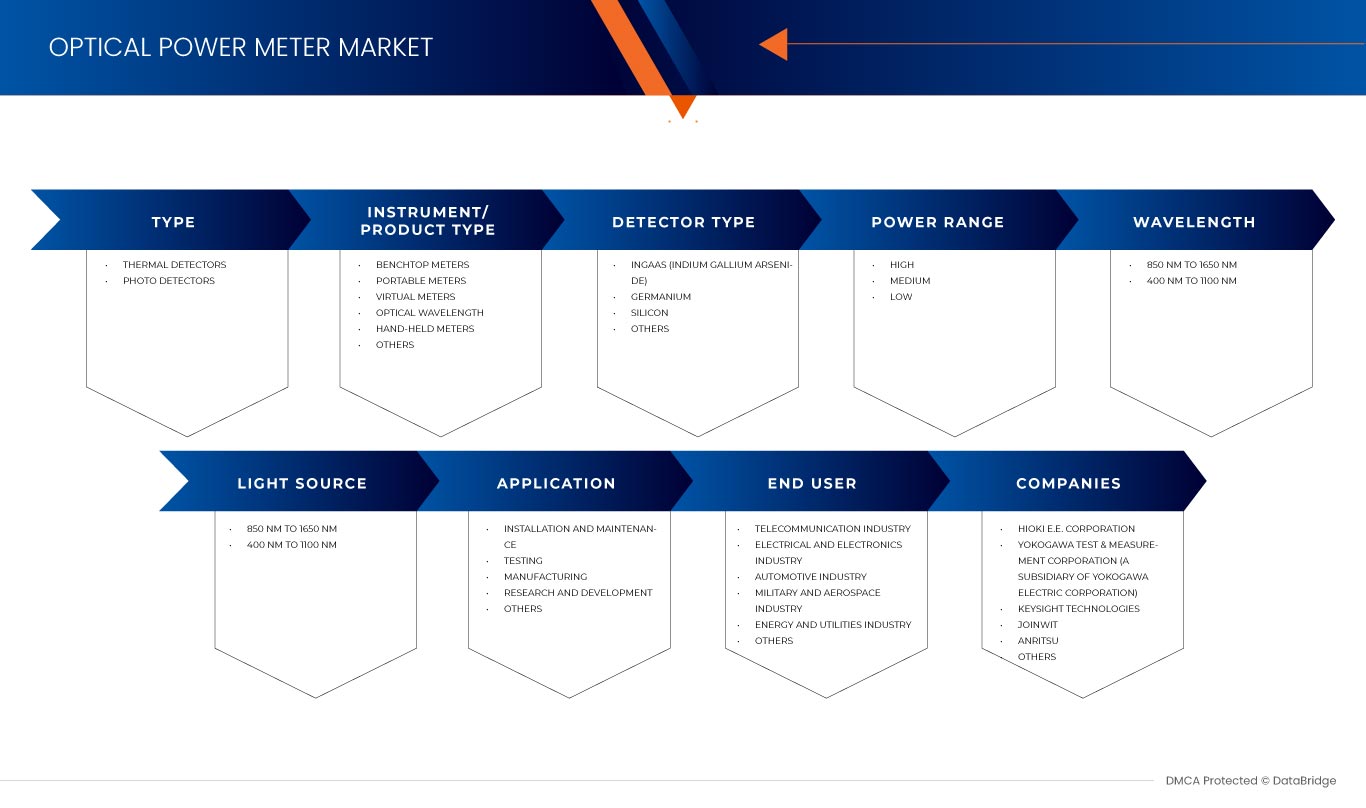
The Asia-Pacific optical power meter market is segmented into eight notable segments based on type, instrument\product type, detector type, power range, wavelength, light source, application, and end-user. The growth amongst these segments will help you analyze meager growth segments in the industries and provide the users with a valuable market overview and market insights to help them make strategic decisions for identifying core market applications.
Type
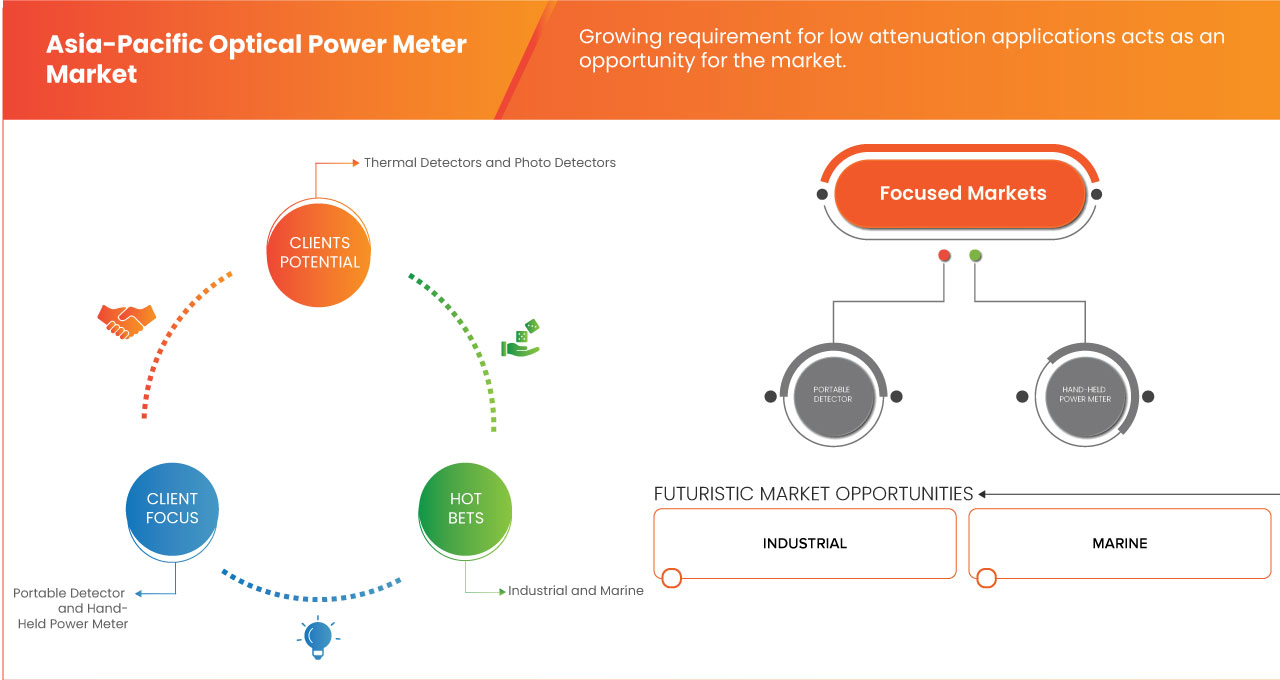
- Thermal Detectors
- Photo Detectors
On the basis of type, the market is segmented into thermal detectors and photo detectors.
Instrument/Product Type
- Benchtop Meter
- Portable Meter
- Virtual Meter
- Optical Wavelength
- Hand-Held Meter
- Others
On the basis of instrument/product type, the market is segmented into benchtop meters, portable meters, virtual meters, optical wavelength, hand-held meters, and others.
Detector Type
- InGaAs (Indium Gallium Arsenide)
- Germanium
- Silicon
- Others
On the basis of detector type, the market is segmented into InGaAs (indium gallium arsenide), germanium, silicon, and others.
Power Range
- High
- Medium
- Low
On the basis of power range, the market is segmented into the high, medium, and low.
Wavelength
- 850 NM to 1650 NM
- 400 NM to 1100 NM
On the basis of wavelength, the market is segmented into 850 NM to 1650 NM and 400 NM to 1100 NM.
Light Source
- LASER
- LED
On the basis of light source, the market is segmented into LASER and LED.
Application
- Installation and Maintenance
- Testing
- Manufacturing
- Research and Development
- Others
On the basis of application, the market is segmented into installation and maintenance, testing, manufacturing, research and development, and others.
End-User
- Telecommunication Industry
- Electrical & Electronics Industry
- Automotive Industry
- Military & Aerospace Industry
- Energy & Utilities Industry
- Others
On the basis of end-user, the market is segmented into telecommunication industry, electrical & electronics industry, automotive industry, military & aerospace industry, energy & utilities industry, and others.
Asia Pacific Optical Power Meter Market Regional Analysis/Insights
The Asia-Pacific optical power meter market is analyzed and market size insights and trends are provided by country, type, instrument\product type, detector type, power range, wavelength, light source, application, and end-user.
The countries covered in this market report are Japan, China, South Korea, India, Australia, Singapore, Thailand, Malaysia, Indonesia, Philippines, New Zealand, Taiwan, Vietnam, and Rest of Asia-Pacific.
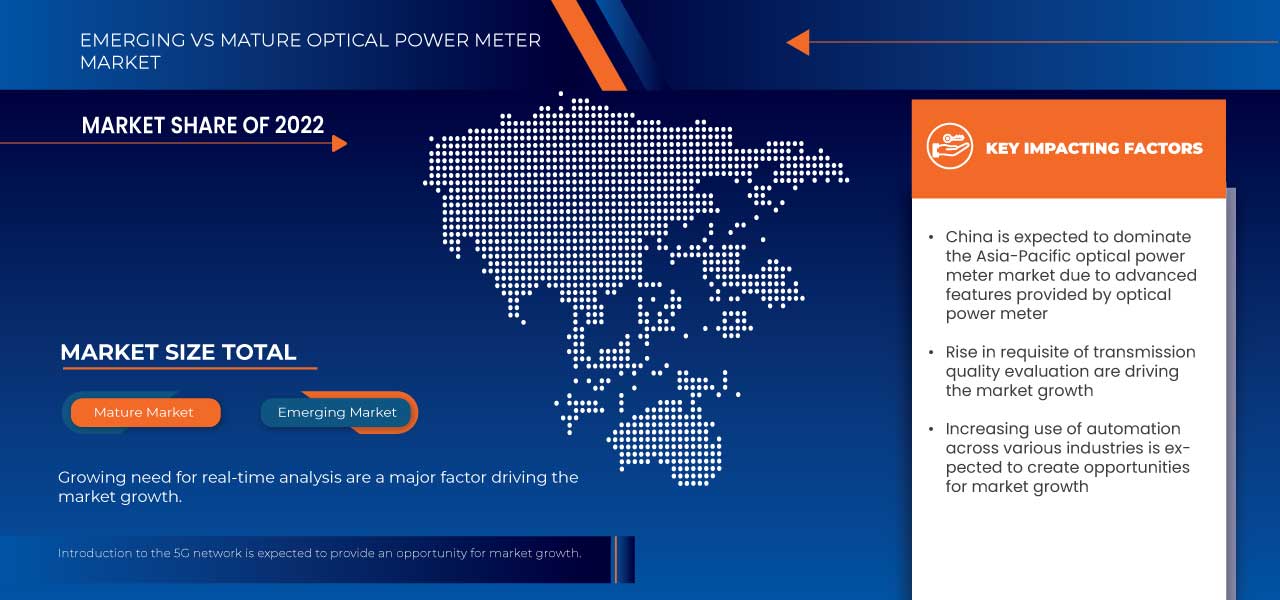
China is expected to dominate the Asia-Pacific optical power meter market as it has the highest number of industries that adopt measure absolute optical power or relative loss of optical power through a section of optical fiber for their manufacturing/production processes, which subsequently increases the need for an optical power meter.
The country section of the report also provides individual market-impacting factors and changes in market regulation that impact the current and future trends of the market. Data points such as downstream and upstream value chain analysis, technical trends, Porter's five forces analysis, and case studies are some of the pointers used to forecast the market scenario for individual countries. Also, the presence and availability of regional brands and their challenges faced due to large or scarce competition from local and domestic brands, the impact of domestic tariffs, and trade routes are considered while providing forecast analysis of the country data.
Competitive Landscape and Asia-Pacific Optical Power Meter Market Share Analysis
The Asia-Pacific optical power meter market competitive landscape provides details of competitors. Details included are company overview, company financials, revenue generated, market potential, investment in research and development, new market initiatives, regional presence, production sites and facilities, production capacities, company strengths and weaknesses, product launch, product width and breadth, and application dominance. The above data points provided are only related to the companies' focus related to the market.
Some of the major market players operating in the Asia-Pacific optical power meter market are ADC CORPORATION, AFL (A subsidiary of Fujikura, Ltd.), Anritsu, APEX Technologies, Artifex Engineering GmbH & Co KG., BIOPTIC CO.,LTD, ComSonics, Deviser Instruments, Incorporated, Edmund Optics Inc., EXFO Inc., Fluke Corporation, GAO Tek & GAO Group Inc., HIOKI E.E. CORPORATION, JOINWIT, Jonard Tools, Keysight Technologies, Kingfisher International, Newport Corporation (A subsidiary of MKS Instruments), Ophir Optronics Solutions Ltd, OZ Optics Ltd., PDR World, Santec Corporation, Stanlay, Thorlabs, Inc., VIAVI Solutions Inc., and Yokogawa Test & Measurement Corporation, among others.
SKU-

- Interactive Data Analysis Dashboard
- Company Analysis Dashboard for high growth potential opportunities
- Research Analyst Access for customization & queries
- Competitor Analysis with Interactive dashboard
- Latest News, Updates & Trend analysis
- Harness the Power of Benchmark Analysis for Comprehensive Competitor Tracking
Table of Content
1 INTRODUCTION
1.1 OBJECTIVES OF THE STUDY
1.2 MARKET DEFINITION
1.3 OVERVIEW OF THE ASIA-PACIFIC OPTICAL POWER METER MARKET
1.4 CURRENCY AND PRICING
1.5 LIMITATIONS
1.6 MARKETS COVERED
2 MARKET SEGMENTATION
2.1 MARKETS COVERED
2.2 GEOGRAPHICAL SCOPE
2.3 YEARS CONSIDERED FOR THE STUDY
2.4 DBMR TRIPOD DATA VALIDATION MODEL
2.5 PRIMARY INTERVIEWS WITH KEY OPINION LEADERS
2.6 DBMR MARKET POSITION GRID
2.7 MULTIVARIATE MODELING
2.8 TYPE TIMELINE CURVE
2.9 MARKET APPLICATION COVERAGE GRID
2.1 SECONDARY SOURCES
2.11 ASSUMPTIONS
3 EXECUTIVE SUMMARY
4 PREMIUM INSIGHTS
4.1 PORTERS FIVE FORCES
4.2 TECHNOLOGICAL TRENDS
4.3 PATENT ANALYSIS
4.4 VALUE CHAIN ANALYSIS
4.5 COMPANY COMPARATIVE ANALYSIS
4.5.1 YOKOGAWA ELECTRIC CORPORATION:
4.5.2 VIAVI SOLUTIONS INC.:
4.5.3 KEYSIGHT TECHNOLOGIES, INC.:
4.6 CASE STUDY
4.6.1 FAULT CAUSED BY ABNORMAL LIGHT-WAVE EMISSION FROM UNCONTROLLED ONU
4.6.2 FATAL DAMAGE TO THE OPTICAL FIBER END SURFACE OF THE CONNECTOR
4.7 REGULATORY STANDARDS
5 MARKET OVERVIEW
5.1 DRIVERS
5.1.1 INCREASING DEMAND FOR OPTICAL POWER METERS
5.1.2 RISE IN REQUISITE OF TRANSMISSION QUALITY EVALUATION
5.1.3 GROWING NEED FOR REAL-TIME ANALYSIS
5.1.4 INCREASE IN DEMAND FOR HIGH BANDWIDTH COMMUNICATION
5.1.5 ADVANCED FEATURES PROVIDED BY OPTICAL POWER METERS
5.2 RESTRAINTS
5.2.1 HIGH MANUFACTURING COST
5.2.2 COMPLICATED AND INFLEXIBLE OPERATION OF FIBER OPTIC POWER METERS
5.2.3 ISSUES WITH O-E AND E-O CONVERSIONS
5.3 OPPORTUNITIES
5.3.1 RISING POWER GRID PROBLEMS
5.3.2 INCREASING USE OF AUTOMATION
5.3.3 NEED FOR TECHNOLOGICAL ADVANCEMENTS
5.3.4 GROWING REQUIREMENT FOR LOW ATTENUATION APPLICATIONS
5.3.5 INTRODUCTION OF 5G NETWORK
5.4 CHALLENGES
5.4.1 LACK OF TECHNICAL KNOWLEDGE
5.4.2 DIFFICULTY IN MAINTAINING DYNAMIC RANGE
6 ASIA-PACIFIC OPTICAL POWER METER MARKET, BY TYPE
6.1 OVERVIEW
6.2 PHOTO DETECTORS
6.3 THERMAL DETECTORS
7 ASIA-PACIFIC OPTICAL POWER METER MARKET, BY INSTRUMENT/PRODUCT TYPE
7.1 OVERVIEW
7.2 HAND-HELD METER
7.2.1 MULTI MODE
7.2.2 SINGLE MODE
7.3 PORTABLE METER
7.4 BENCHTOP METER
7.5 OPTICAL WAVELENGTH
7.6 VIRTUAL METERS
7.7 OTHERS
8 ASIA-PACIFIC OPTICAL POWER METER MARKET, BY DETECTOR TYPE
8.1 OVERVIEW
8.2 GERMANIUM
8.3 SILICON
8.4 INGAAS (INDIUM GALLIUM ARSENIDE)
8.5 OTHERS
9 ASIA-PACIFIC OPTICAL POWER METER MARKET, BY POWER RANGE
9.1 OVERVIEW
9.2 MEDIUM
9.3 HIGH
9.4 LOW
10 ASIA-PACIFIC OPTICAL POWER METER MARKET, BY WAVELENGTH
10.1 OVERVIEW
10.2 850NM TO 1650NM
10.3 400NM TO 1100NM
11 ASIA-PACIFIC OPTICAL POWER METER MARKET, BY LIGHT SOURCE
11.1 OVERVIEW
11.2 LASER
11.3 LED
12 ASIA-PACIFIC OPTICAL POWER METER MARKET, BY APPLICATION
12.1 OVERVIEW
12.2 TESTING
12.3 INSTALLATION & MAINTENANCE
12.4 MANUFACTURING
12.5 RESEARCH & DEVELOPMENT
12.6 OTHERS
13 ASIA-PACIFIC OPTICAL POWER METER MARKET, BY END-USER
13.1 OVERVIEW
13.2 TELECOMMUNICATION INDUSTRY
13.2.1 PHOTON DETECTORS
13.2.2 THERMAL DETECTORS
13.3 AUTOMOTIVE INDUSTRY
13.3.1 PHOTON DETECTORS
13.3.2 THERMAL DETECTORS
13.4 MILITARY & AEROSPACE INDUSTRY
13.4.1 PHOTON DETECTORS
13.4.2 THERMAL DETECTORS
13.5 ENERGY & UTILITIES INDUSTRY
13.5.1 PHOTON DETECTORS
13.5.2 THERMAL DETECTORS
13.6 ELECTRICAL & ELECTRONICS INDUSTRY
13.6.1 PHOTON DETECTORS
13.6.2 THERMAL DETECTORS
13.7 OTHERS
14 ASIA-PACIFIC OPTICAL POWER METER MARKET BY COUNTRY
14.1 ASIA-PACIFIC
14.1.1 CHINA
14.1.2 JAPAN
14.1.3 SOUTH KOREA
14.1.4 AUSTRALIA
14.1.5 MALAYSIA
14.1.6 SINGAPORE
14.1.7 INDIA
14.1.8 THAILAND
14.1.9 INDONESIA
14.1.10 PHILIPPINES
14.1.11 TAIWAN
14.1.12 VIETNAM
14.1.13 REST OF ASIA-PACIFIC
15 ASIA-PACIFIC OPTICAL POWER METER MARKET, COMPANY LANDSCAPE
15.1 COMPANY SHARE ANALYSIS: ASIA-PACIFIC
16 SWOT ANALYSIS
17 COMPANY PROFILINGS
17.1 HIOKI E.E. CORPORATION
17.1.1 COMPANY SNAPSHOT
17.1.2 REVENUE ANALYSIS
17.1.3 PRODUCT PORTFOLIO
17.1.4 RECENT DEVELOPMENTS
17.2 YOKOGAWA TEST & MEASUREMENT CORPORATION (A SUBSIDIARY OF YOKOGAWA ELECTRIC CORPORATION)
17.2.1 COMPANY SNAPSHOT
17.2.2 REVENUE ANALYSIS
17.2.3 PRODUCT PORTFOLIO
17.2.4 RECENT DEVELOPMENTS
17.3 KEYSIGHT TECHNOLOGIES
17.3.1 COMPANY SNAPSHOT
17.3.2 REVENUE ANALYSIS
17.3.3 PRODUCT PORTFOLIO
17.3.4 RECENT DEVELOPMENTS
17.4 JOINWIT
17.4.1 COMPANY SNAPSHOT
17.4.2 PRODUCT PORTFOLIO
17.4.3 RECENT DEVELOPMENTS
17.5 ANRITSU
17.5.1 COMPANY SNAPSHOT
17.5.2 REVENUE ANALYSIS
17.5.3 PRODUCT PORTFOLIO
17.5.4 RECENT DEVELOPMENTS
17.6 ADC CORPORATION
17.6.1 COMPANY SNAPSHOT
17.6.2 PRODUCT PORTFOLIO
17.6.3 RECENT DEVELOPMENT
17.7 AFL
17.7.1 COMPANY SNAPSHOT
17.7.2 REVENUE ANALYSIS
17.7.3 PRODUCT PORTFOLIO
17.7.4 RECENT DEVELOPMENT
17.8 APEX TECHNOLOGIES
17.8.1 COMPANY SNAPSHOT
17.8.2 PRODUCT PORTFOLIO
17.8.3 RECENT DEVELOPMENT
17.9 ARTIFEX ENGINEERING GMBH & CO KG.
17.9.1 COMPANY SNAPSHOT
17.9.2 PRODUCT PORTFOLIO
17.9.3 RECENT DEVELOPMENTS
17.1 COMSONICS
17.10.1 COMPANY SNAPSHOT
17.10.2 PRODUCT PORTFOLIO
17.10.3 RECENT DEVELOPMENTS
17.11 DEVISER INSTRUMENTS
17.11.1 COMPANY SNAPSHOT
17.11.2 PRODUCT PORTFOLIO
17.11.3 RECENT DEVELOPMENTS
17.12 EDMUND OPTICS INC.
17.12.1 COMPANY SNAPSHOT
17.12.2 PRODUCT PORTFOLIO
17.12.3 RECENT DEVELOPMENTS
17.13 EXFO INC.
17.13.1 COMPANY SNAPSHOT
17.13.2 PRODUCT PORTFOLIO
17.13.3 RECENT DEVELOPMENTS
17.14 FLUKE CORPORATION
17.14.1 COMPANY SNAPSHOT
17.14.2 PRODUCT PORTFOLIO
17.14.3 RECENT DEVELOPMENTS
17.15 GAO TEK & GAO GROUP INC.
17.15.1 COMPANY SNAPSHOT
17.15.2 PRODUCT PORTFOLIO
17.15.3 RECENT DEVELOPMENT
17.16 JONARD TOOLS
17.16.1 COMPANY SNAPSHOT
17.16.2 PRODUCT PORTFOLIO
17.16.3 RECENT DEVELOPMENTS
17.17 KINGFISHER INTERNATIONAL
17.17.1 COMPANY SNAPSHOT
17.17.2 PRODUCT PORTFOLIO
17.17.3 RECENT DEVELOPMENTS
17.18 NEWPORT CORPORATION (A SUBSIDIARY OF MKS INSTRUMENTS)
17.18.1 COMPANY SNAPSHOT
17.18.2 REVENUE ANALYSIS
17.18.3 PRODUCT PORTFOLIO
17.18.4 RECENT DEVELOPMENTS
17.19 OPHIR OPTRONICS SOLUTIONS LTD
17.19.1 COMPANY SNAPSHOT
17.19.2 PRODUCT PORTFOLIO
17.19.3 RECENT DEVELOPMENT
17.2 PDR WORLD
17.20.1 COMPANY SNAPSHOT
17.20.2 PRODUCT PORTFOLIO
17.20.3 RECENT DEVELOPMENTS
17.21 SANTEC CORPORATION
17.21.1 COMPANY SNAPSHOT
17.21.2 REVENUE ANALYSIS
17.21.3 PRODUCT PORTFOLIO
17.21.4 RECENT DEVELOPMENTS
17.22 STANLAY
17.22.1 COMPANY SNAPSHOT
17.22.2 PRODUCT PORTFOLIO
17.22.3 RECENT DEVELOPMENT
17.23 THORLABS, INC.
17.23.1 COMPANY SNAPSHOT
17.23.2 PRODUCT PORTFOLIO
17.23.3 RECENT DEVELOPMENTS
17.24 VIAVI SOLUTIONS INC.
17.24.1 COMPANY SNAPSHOT
17.24.2 REVENUE ANALYSIS
17.24.3 PRODUCT PORTFOLIO
17.24.4 RECENT DEVELOPMENTS
18 QUESTIONNAIRE
19 RELATED REPORTS
List of Table
TABLE 1 ASIA-PACIFIC OPTICAL POWER METER MARKET, BY TYPE, 2021-2030 (USD THOUSAND)
TABLE 2 ASIA-PACIFIC OPTICAL POWER METER MARKET, BY INSTRUMENT/PRODUCT TYPE, 2021-2030 (USD THOUSAND)
TABLE 3 ASIA-PACIFIC HAND-HELD METER IN OPTICAL POWER METER MARKET, BY TYPE, 2021-2030 (USD THOUSAND)
TABLE 4 ASIA-PACIFIC OPTICAL POWER METER MARKET, BY DETECTOR TYPE, 2021-2030 (USD THOUSAND)
TABLE 5 ASIA-PACIFIC OPTICAL POWER METER MARKET, BY POWER RANGE, 2021-2030 (USD THOUSAND)
TABLE 6 ASIA-PACIFIC OPTICAL POWER METER MARKET, BY WAVELENGTH, 2021-2030 (USD THOUSAND)
TABLE 7 ASIA-PACIFIC OPTICAL POWER METER MARKET, BY LIGHT SOURCE, 2021-2030 (USD THOUSAND)
TABLE 8 ASIA-PACIFIC OPTICAL POWER METER MARKET, BY APPLICATION, 2021-2030 (USD THOUSAND)
TABLE 9 ASIA-PACIFIC OPTICAL POWER METER MARKET, BY END-USER, 2021-2030 (USD THOUSAND)
TABLE 10 ASIA-PACIFIC TELECOMMUNICATION INDUSTRY IN OPTICAL POWER METER MARKET, BY TYPE, 2021-2030 (USD THOUSAND)
TABLE 11 ASIA-PACIFIC AUTOMOTIVE INDUSTRY IN OPTICAL POWER METER MARKET, BY TYPE, 2021-2030 (USD THOUSAND)
TABLE 12 ASIA-PACIFIC MILITARY & AEROSPACE INDUSTRY IN OPTICAL POWER METER MARKET, BY TYPE, 2021-2030 (USD THOUSAND)
TABLE 13 ASIA-PACIFIC ENERGY & UTILITIES INDUSTRY IN OPTICAL POWER METER MARKET, BY TYPE, 2021-2030 (USD THOUSAND)
TABLE 14 ASIA-PACIFIC ELECTRICAL & ELECTRONICS INDUSTRY IN OPTICAL POWER METER MARKET, BY TYPE, 2021-2030 (USD THOUSAND)
TABLE 15 ASIA-PACIFIC OPTICAL POWER METER MARKET, BY COUNTRY, 2021-2030 (USD THOUSAND)
TABLE 16 CHINA OPTICAL POWER METER MARKET, BY TYPE, 2021-2030 (USD THOUSAND)
TABLE 17 CHINA OPTICAL POWER METER MARKET, BY INSTRUMENT/PRODUCT TYPE, 2021-2030 (USD THOUSAND)
TABLE 18 CHINA HAND-HELD METER IN OPTICAL POWER METER MARKET, BY TYPE, 2021-2030 (USD THOUSAND)
TABLE 19 CHINA OPTICAL POWER METER MARKET, BY DETECTOR TYPE, 2021-2030 (USD THOUSAND)
TABLE 20 CHINA OPTICAL POWER METER MARKET, BY POWER RANGE, 2021-2030 (USD THOUSAND)
TABLE 21 CHINA OPTICAL POWER METER MARKET, BY WAVELENGTH, 2021-2030 (USD THOUSAND)
TABLE 22 CHINA OPTICAL POWER METER MARKET, BY LIGHT SOURCE, 2021-2030 (USD THOUSAND)
TABLE 23 CHINA OPTICAL POWER METER MARKET, BY APPLICATION, 2021-2030 (USD THOUSAND)
TABLE 24 CHINA OPTICAL POWER METER MARKET, BY END-USER 2021-2030 (USD THOUSAND)
TABLE 25 CHINA TELECOMMUNICATION INDUSTRY IN OPTICAL POWER METER MARKET, BY TYPE, 2021-2030 (USD THOUSAND)
TABLE 26 CHINA AUTOMOTIVE INDUSTRY IN OPTICAL POWER METER MARKET, BY TYPE, 2021-2030 (USD THOUSAND)
TABLE 27 CHINA MILITARY & AEROSPACE INDUSTRY IN OPTICAL POWER METER MARKET, BY TYPE, 2021-2030 (USD THOUSAND)
TABLE 28 CHINA ENERGY & UTILITIES INDUSTRY IN OPTICAL POWER METER MARKET, BY TYPE, 2021-2030 (USD THOUSAND)
TABLE 29 CHINA ELECTRICAL & ELECTRONICS INDUSTRY IN OPTICAL POWER METER MARKET, BY TYPE, 2021-2030 (USD THOUSAND)
TABLE 30 JAPAN OPTICAL POWER METER MARKET, BY TYPE, 2021-2030 (USD THOUSAND)
TABLE 31 JAPAN OPTICAL POWER METER MARKET, BY INSTRUMENT/PRODUCT TYPE, 2021-2030 (USD THOUSAND)
TABLE 32 JAPAN HAND-HELD METER IN OPTICAL POWER METER MARKET, BY TYPE, 2021-2030 (USD THOUSAND)
TABLE 33 JAPAN OPTICAL POWER METER MARKET, BY DETECTOR TYPE, 2021-2030 (USD THOUSAND)
TABLE 34 JAPAN OPTICAL POWER METER MARKET, BY POWER RANGE, 2021-2030 (USD THOUSAND)
TABLE 35 JAPAN OPTICAL POWER METER MARKET, BY WAVELENGTH, 2021-2030 (USD THOUSAND)
TABLE 36 JAPAN OPTICAL POWER METER MARKET, BY LIGHT SOURCE, 2021-2030 (USD THOUSAND)
TABLE 37 JAPAN OPTICAL POWER METER MARKET, BY APPLICATION, 2021-2030 (USD THOUSAND)
TABLE 38 JAPAN OPTICAL POWER METER MARKET, BY END-USER 2021-2030 (USD THOUSAND)
TABLE 39 JAPAN TELECOMMUNICATION INDUSTRY IN OPTICAL POWER METER MARKET, BY TYPE, 2021-2030 (USD THOUSAND)
TABLE 40 JAPAN AUTOMOTIVE INDUSTRY IN OPTICAL POWER METER MARKET, BY TYPE, 2021-2030 (USD THOUSAND)
TABLE 41 JAPAN MILITARY & AEROSPACE INDUSTRY IN OPTICAL POWER METER MARKET, BY TYPE, 2021-2030 (USD THOUSAND)
TABLE 42 JAPAN ENERGY & UTILITIES INDUSTRY IN OPTICAL POWER METER MARKET, BY TYPE, 2021-2030 (USD THOUSAND)
TABLE 43 JAPAN ELECTRICAL & ELECTRONICS INDUSTRY IN OPTICAL POWER METER MARKET, BY TYPE, 2021-2030 (USD THOUSAND)
TABLE 44 SOUTH KOREA OPTICAL POWER METER MARKET, BY TYPE, 2021-2030 (USD THOUSAND)
TABLE 45 SOUTH KOREA OPTICAL POWER METER MARKET, BY INSTRUMENT/PRODUCT TYPE, 2021-2030 (USD THOUSAND)
TABLE 46 SOUTH KOREA HAND-HELD METER IN OPTICAL POWER METER MARKET, BY TYPE, 2021-2030 (USD THOUSAND)
TABLE 47 SOUTH KOREA OPTICAL POWER METER MARKET, BY DETECTOR TYPE, 2021-2030 (USD THOUSAND)
TABLE 48 SOUTH KOREA OPTICAL POWER METER MARKET, BY POWER RANGE, 2021-2030 (USD THOUSAND)
TABLE 49 SOUTH KOREA OPTICAL POWER METER MARKET, BY WAVELENGTH, 2021-2030 (USD THOUSAND)
TABLE 50 SOUTH KOREA OPTICAL POWER METER MARKET, BY LIGHT SOURCE, 2021-2030 (USD THOUSAND)
TABLE 51 SOUTH KOREA OPTICAL POWER METER MARKET, BY APPLICATION, 2021-2030 (USD THOUSAND)
TABLE 52 SOUTH KOREA OPTICAL POWER METER MARKET, BY END-USER 2021-2030 (USD THOUSAND)
TABLE 53 SOUTH KOREA TELECOMMUNICATION INDUSTRY IN OPTICAL POWER METER MARKET, BY TYPE, 2021-2030 (USD THOUSAND)
TABLE 54 SOUTH KOREA AUTOMOTIVE INDUSTRY IN OPTICAL POWER METER MARKET, BY TYPE, 2021-2030 (USD THOUSAND)
TABLE 55 SOUTH KOREA MILITARY & AEROSPACE INDUSTRY IN OPTICAL POWER METER MARKET, BY TYPE, 2021-2030 (USD THOUSAND)
TABLE 56 SOUTH KOREA ENERGY & UTILITIES INDUSTRY IN OPTICAL POWER METER MARKET, BY TYPE, 2021-2030 (USD THOUSAND)
TABLE 57 SOUTH KOREA ELECTRICAL & ELECTRONICS INDUSTRY IN OPTICAL POWER METER MARKET, BY TYPE, 2021-2030 (USD THOUSAND)
TABLE 58 AUSTRALIA OPTICAL POWER METER MARKET, BY TYPE, 2021-2030 (USD THOUSAND)
TABLE 59 AUSTRALIA OPTICAL POWER METER MARKET, BY INSTRUMENT/PRODUCT TYPE, 2021-2030 (USD THOUSAND)
TABLE 60 AUSTRALIA HAND-HELD METER IN OPTICAL POWER METER MARKET, BY TYPE, 2021-2030 (USD THOUSAND)
TABLE 61 AUSTRALIA OPTICAL POWER METER MARKET, BY DETECTOR TYPE, 2021-2030 (USD THOUSAND)
TABLE 62 AUSTRALIA OPTICAL POWER METER MARKET, BY POWER RANGE, 2021-2030 (USD THOUSAND)
TABLE 63 AUSTRALIA OPTICAL POWER METER MARKET, BY WAVELENGTH, 2021-2030 (USD THOUSAND)
TABLE 64 AUSTRALIA OPTICAL POWER METER MARKET, BY LIGHT SOURCE, 2021-2030 (USD THOUSAND)
TABLE 65 AUSTRALIA OPTICAL POWER METER MARKET, BY APPLICATION, 2021-2030 (USD THOUSAND)
TABLE 66 AUSTRALIA OPTICAL POWER METER MARKET, BY END-USER 2021-2030 (USD THOUSAND)
TABLE 67 AUSTRALIA TELECOMMUNICATION INDUSTRY IN OPTICAL POWER METER MARKET, BY TYPE, 2021-2030 (USD THOUSAND)
TABLE 68 AUSTRALIA AUTOMOTIVE INDUSTRY IN OPTICAL POWER METER MARKET, BY TYPE, 2021-2030 (USD THOUSAND)
TABLE 69 AUSTRALIA MILITARY & AEROSPACE INDUSTRY IN OPTICAL POWER METER MARKET, BY TYPE, 2021-2030 (USD THOUSAND)
TABLE 70 AUSTRALIA ENERGY & UTILITIES INDUSTRY IN OPTICAL POWER METER MARKET, BY TYPE, 2021-2030 (USD THOUSAND)
TABLE 71 AUSTRALIA ELECTRICAL & ELECTRONICS INDUSTRY IN OPTICAL POWER METER MARKET, BY TYPE, 2021-2030 (USD THOUSAND)
TABLE 72 MALAYSIA OPTICAL POWER METER MARKET, BY TYPE, 2021-2030 (USD THOUSAND)
TABLE 73 MALAYSIA OPTICAL POWER METER MARKET, BY INSTRUMENT/PRODUCT TYPE, 2021-2030 (USD THOUSAND)
TABLE 74 MALAYSIA HAND-HELD METER IN OPTICAL POWER METER MARKET, BY TYPE, 2021-2030 (USD THOUSAND)
TABLE 75 MALAYSIA OPTICAL POWER METER MARKET, BY DETECTOR TYPE, 2021-2030 (USD THOUSAND)
TABLE 76 MALAYSIA OPTICAL POWER METER MARKET, BY POWER RANGE, 2021-2030 (USD THOUSAND)
TABLE 77 MALAYSIA OPTICAL POWER METER MARKET, BY WAVELENGTH, 2021-2030 (USD THOUSAND)
TABLE 78 MALAYSIA OPTICAL POWER METER MARKET, BY LIGHT SOURCE, 2021-2030 (USD THOUSAND)
TABLE 79 MALAYSIA OPTICAL POWER METER MARKET, BY APPLICATION, 2021-2030 (USD THOUSAND)
TABLE 80 MALAYSIA OPTICAL POWER METER MARKET, BY END-USER 2021-2030 (USD THOUSAND)
TABLE 81 MALAYSIA TELECOMMUNICATION INDUSTRY IN OPTICAL POWER METER MARKET, BY TYPE, 2021-2030 (USD THOUSAND)
TABLE 82 MALAYSIA AUTOMOTIVE INDUSTRY IN OPTICAL POWER METER MARKET, BY TYPE, 2021-2030 (USD THOUSAND)
TABLE 83 MALAYSIA MILITARY & AEROSPACE INDUSTRY IN OPTICAL POWER METER MARKET, BY TYPE, 2021-2030 (USD THOUSAND)
TABLE 84 MALAYSIA ENERGY & UTILITIES INDUSTRY IN OPTICAL POWER METER MARKET, BY TYPE, 2021-2030 (USD THOUSAND)
TABLE 85 MALAYSIA ELECTRICAL & ELECTRONICS INDUSTRY IN OPTICAL POWER METER MARKET, BY TYPE, 2021-2030 (USD THOUSAND)
TABLE 86 NEW ZEALAND OPTICAL POWER METER MARKET, BY TYPE, 2021-2030 (USD THOUSAND)
TABLE 87 NEW ZEALAND OPTICAL POWER METER MARKET, BY INSTRUMENT/PRODUCT TYPE, 2021-2030 (USD THOUSAND)
TABLE 88 NEW ZEALAND HAND-HELD METER IN OPTICAL POWER METER MARKET, BY TYPE, 2021-2030 (USD THOUSAND)
TABLE 89 NEW ZEALAND OPTICAL POWER METER MARKET, BY DETECTOR TYPE, 2021-2030 (USD THOUSAND)
TABLE 90 NEW ZEALAND OPTICAL POWER METER MARKET, BY POWER RANGE, 2021-2030 (USD THOUSAND)
TABLE 91 NEW ZEALAND OPTICAL POWER METER MARKET, BY WAVELENGTH, 2021-2030 (USD THOUSAND)
TABLE 92 NEW ZEALAND OPTICAL POWER METER MARKET, BY LIGHT SOURCE, 2021-2030 (USD THOUSAND)
TABLE 93 NEW ZEALAND OPTICAL POWER METER MARKET, BY APPLICATION, 2021-2030 (USD THOUSAND)
TABLE 94 NEW ZEALAND OPTICAL POWER METER MARKET, BY END-USER 2021-2030 (USD THOUSAND)
TABLE 95 NEW ZEALAND TELECOMMUNICATION INDUSTRY IN OPTICAL POWER METER MARKET, BY TYPE, 2021-2030 (USD THOUSAND)
TABLE 96 NEW ZEALAND AUTOMOTIVE INDUSTRY IN OPTICAL POWER METER MARKET, BY TYPE, 2021-2030 (USD THOUSAND)
TABLE 97 NEW ZEALAND MILITARY & AEROSPACE INDUSTRY IN OPTICAL POWER METER MARKET, BY TYPE, 2021-2030 (USD THOUSAND)
TABLE 98 NEW ZEALAND ENERGY & UTILITIES INDUSTRY IN OPTICAL POWER METER MARKET, BY TYPE, 2021-2030 (USD THOUSAND)
TABLE 99 NEW ZEALAND ELECTRICAL & ELECTRONICS INDUSTRY IN OPTICAL POWER METER MARKET, BY TYPE, 2021-2030 (USD THOUSAND)
TABLE 100 SINGAPORE OPTICAL POWER METER MARKET, BY TYPE, 2021-2030 (USD THOUSAND)
TABLE 101 SINGAPORE OPTICAL POWER METER MARKET, BY INSTRUMENT/PRODUCT TYPE, 2021-2030 (USD THOUSAND)
TABLE 102 SINGAPORE HAND-HELD METER IN OPTICAL POWER METER MARKET, BY TYPE, 2021-2030 (USD THOUSAND)
TABLE 103 SINGAPORE OPTICAL POWER METER MARKET, BY DETECTOR TYPE, 2021-2030 (USD THOUSAND)
TABLE 104 SINGAPORE OPTICAL POWER METER MARKET, BY POWER RANGE, 2021-2030 (USD THOUSAND)
TABLE 105 SINGAPORE OPTICAL POWER METER MARKET, BY WAVELENGTH, 2021-2030 (USD THOUSAND)
TABLE 106 SINGAPORE OPTICAL POWER METER MARKET, BY LIGHT SOURCE, 2021-2030 (USD THOUSAND)
TABLE 107 SINGAPORE OPTICAL POWER METER MARKET, BY APPLICATION, 2021-2030 (USD THOUSAND)
TABLE 108 SINGAPORE OPTICAL POWER METER MARKET, BY END-USER 2021-2030 (USD THOUSAND)
TABLE 109 SINGAPORE TELECOMMUNICATION INDUSTRY IN OPTICAL POWER METER MARKET, BY TYPE, 2021-2030 (USD THOUSAND)
TABLE 110 SINGAPORE AUTOMOTIVE INDUSTRY IN OPTICAL POWER METER MARKET, BY TYPE, 2021-2030 (USD THOUSAND)
TABLE 111 SINGAPORE MILITARY & AEROSPACE INDUSTRY IN OPTICAL POWER METER MARKET, BY TYPE, 2021-2030 (USD THOUSAND)
TABLE 112 SINGAPORE ENERGY & UTILITIES INDUSTRY IN OPTICAL POWER METER MARKET, BY TYPE, 2021-2030 (USD THOUSAND)
TABLE 113 SINGAPORE ELECTRICAL & ELECTRONICS INDUSTRY IN OPTICAL POWER METER MARKET, BY TYPE, 2021-2030 (USD THOUSAND)
TABLE 114 INDIA OPTICAL POWER METER MARKET, BY TYPE, 2021-2030 (USD THOUSAND)
TABLE 115 INDIA OPTICAL POWER METER MARKET, BY INSTRUMENT/PRODUCT TYPE, 2021-2030 (USD THOUSAND)
TABLE 116 INDIA HAND-HELD METER IN OPTICAL POWER METER MARKET, BY TYPE, 2021-2030 (USD THOUSAND)
TABLE 117 INDIA OPTICAL POWER METER MARKET, BY DETECTOR TYPE, 2021-2030 (USD THOUSAND)
TABLE 118 INDIA OPTICAL POWER METER MARKET, BY POWER RANGE, 2021-2030 (USD THOUSAND)
TABLE 119 INDIA OPTICAL POWER METER MARKET, BY WAVELENGTH, 2021-2030 (USD THOUSAND)
TABLE 120 INDIA OPTICAL POWER METER MARKET, BY LIGHT SOURCE, 2021-2030 (USD THOUSAND)
TABLE 121 INDIA OPTICAL POWER METER MARKET, BY APPLICATION, 2021-2030 (USD THOUSAND)
TABLE 122 INDIA OPTICAL POWER METER MARKET, BY END-USER 2021-2030 (USD THOUSAND)
TABLE 123 INDIA TELECOMMUNICATION INDUSTRY IN OPTICAL POWER METER MARKET, BY TYPE, 2021-2030 (USD THOUSAND)
TABLE 124 INDIA AUTOMOTIVE INDUSTRY IN OPTICAL POWER METER MARKET, BY TYPE, 2021-2030 (USD THOUSAND)
TABLE 125 INDIA MILITARY & AEROSPACE INDUSTRY IN OPTICAL POWER METER MARKET, BY TYPE, 2021-2030 (USD THOUSAND)
TABLE 126 INDIA ENERGY & UTILITIES INDUSTRY IN OPTICAL POWER METER MARKET, BY TYPE, 2021-2030 (USD THOUSAND)
TABLE 127 INDIA ELECTRICAL & ELECTRONICS INDUSTRY IN OPTICAL POWER METER MARKET, BY TYPE, 2021-2030 (USD THOUSAND)
TABLE 128 THAILAND OPTICAL POWER METER MARKET, BY TYPE, 2021-2030 (USD THOUSAND)
TABLE 129 THAILAND OPTICAL POWER METER MARKET, BY INSTRUMENT/PRODUCT TYPE, 2021-2030 (USD THOUSAND)
TABLE 130 THAILAND HAND-HELD METER IN OPTICAL POWER METER MARKET, BY TYPE, 2021-2030 (USD THOUSAND)
TABLE 131 THAILAND OPTICAL POWER METER MARKET, BY DETECTOR TYPE, 2021-2030 (USD THOUSAND)
TABLE 132 THAILAND OPTICAL POWER METER MARKET, BY POWER RANGE, 2021-2030 (USD THOUSAND)
TABLE 133 THAILAND OPTICAL POWER METER MARKET, BY WAVELENGTH, 2021-2030 (USD THOUSAND)
TABLE 134 THAILAND OPTICAL POWER METER MARKET, BY LIGHT SOURCE, 2021-2030 (USD THOUSAND)
TABLE 135 THAILAND OPTICAL POWER METER MARKET, BY APPLICATION, 2021-2030 (USD THOUSAND)
TABLE 136 THAILAND OPTICAL POWER METER MARKET, BY END-USER 2021-2030 (USD THOUSAND)
TABLE 137 THAILAND TELECOMMUNICATION INDUSTRY IN OPTICAL POWER METER MARKET, BY TYPE, 2021-2030 (USD THOUSAND)
TABLE 138 THAILAND AUTOMOTIVE INDUSTRY IN OPTICAL POWER METER MARKET, BY TYPE, 2021-2030 (USD THOUSAND)
TABLE 139 THAILAND MILITARY & AEROSPACE INDUSTRY IN OPTICAL POWER METER MARKET, BY TYPE, 2021-2030 (USD THOUSAND)
TABLE 140 THAILAND ENERGY & UTILITIES INDUSTRY IN OPTICAL POWER METER MARKET, BY TYPE, 2021-2030 (USD THOUSAND)
TABLE 141 THAILAND ELECTRICAL & ELECTRONICS INDUSTRY IN OPTICAL POWER METER MARKET, BY TYPE, 2021-2030 (USD THOUSAND)
TABLE 142 INDONESIA OPTICAL POWER METER MARKET, BY TYPE, 2021-2030 (USD THOUSAND)
TABLE 143 INDONESIA OPTICAL POWER METER MARKET, BY INSTRUMENT/PRODUCT TYPE, 2021-2030 (USD THOUSAND)
TABLE 144 INDONESIA HAND-HELD METER IN OPTICAL POWER METER MARKET, BY TYPE, 2021-2030 (USD THOUSAND)
TABLE 145 INDONESIA OPTICAL POWER METER MARKET, BY DETECTOR TYPE, 2021-2030 (USD THOUSAND)
TABLE 146 INDONESIA OPTICAL POWER METER MARKET, BY POWER RANGE, 2021-2030 (USD THOUSAND)
TABLE 147 INDONESIA OPTICAL POWER METER MARKET, BY WAVELENGTH, 2021-2030 (USD THOUSAND)
TABLE 148 INDONESIA OPTICAL POWER METER MARKET, BY LIGHT SOURCE, 2021-2030 (USD THOUSAND)
TABLE 149 INDONESIA OPTICAL POWER METER MARKET, BY APPLICATION, 2021-2030 (USD THOUSAND)
TABLE 150 INDONESIA OPTICAL POWER METER MARKET, BY END-USER 2021-2030 (USD THOUSAND)
TABLE 151 INDONESIA TELECOMMUNICATION INDUSTRY IN OPTICAL POWER METER MARKET, BY TYPE, 2021-2030 (USD THOUSAND)
TABLE 152 INDONESIA AUTOMOTIVE INDUSTRY IN OPTICAL POWER METER MARKET, BY TYPE, 2021-2030 (USD THOUSAND)
TABLE 153 INDONESIA MILITARY & AEROSPACE INDUSTRY IN OPTICAL POWER METER MARKET, BY TYPE, 2021-2030 (USD THOUSAND)
TABLE 154 INDONESIA ENERGY & UTILITIES INDUSTRY IN OPTICAL POWER METER MARKET, BY TYPE, 2021-2030 (USD THOUSAND)
TABLE 155 INDONESIA ELECTRICAL & ELECTRONICS INDUSTRY IN OPTICAL POWER METER MARKET, BY TYPE, 2021-2030 (USD THOUSAND)
TABLE 156 PHILIPPINES OPTICAL POWER METER MARKET, BY TYPE, 2021-2030 (USD THOUSAND)
TABLE 157 PHILIPPINES OPTICAL POWER METER MARKET, BY INSTRUMENT/PRODUCT TYPE, 2021-2030 (USD THOUSAND)
TABLE 158 PHILIPPINES HAND-HELD METER IN OPTICAL POWER METER MARKET, BY TYPE, 2021-2030 (USD THOUSAND)
TABLE 159 PHILIPPINES OPTICAL POWER METER MARKET, BY DETECTOR TYPE, 2021-2030 (USD THOUSAND)
TABLE 160 PHILIPPINES OPTICAL POWER METER MARKET, BY POWER RANGE, 2021-2030 (USD THOUSAND)
TABLE 161 PHILIPPINES OPTICAL POWER METER MARKET, BY WAVELENGTH, 2021-2030 (USD THOUSAND)
TABLE 162 PHILIPPINES OPTICAL POWER METER MARKET, BY LIGHT SOURCE, 2021-2030 (USD THOUSAND)
TABLE 163 PHILIPPINES OPTICAL POWER METER MARKET, BY APPLICATION, 2021-2030 (USD THOUSAND)
TABLE 164 PHILIPPINES OPTICAL POWER METER MARKET, BY END-USER 2021-2030 (USD THOUSAND)
TABLE 165 PHILIPPINES TELECOMMUNICATION INDUSTRY IN OPTICAL POWER METER MARKET, BY TYPE, 2021-2030 (USD THOUSAND)
TABLE 166 PHILIPPINES AUTOMOTIVE INDUSTRY IN OPTICAL POWER METER MARKET, BY TYPE, 2021-2030 (USD THOUSAND)
TABLE 167 PHILIPPINES MILITARY & AEROSPACE INDUSTRY IN OPTICAL POWER METER MARKET, BY TYPE, 2021-2030 (USD THOUSAND)
TABLE 168 PHILIPPINES ENERGY & UTILITIES INDUSTRY IN OPTICAL POWER METER MARKET, BY TYPE, 2021-2030 (USD THOUSAND)
TABLE 169 PHILIPPINES ELECTRICAL & ELECTRONICS INDUSTRY IN OPTICAL POWER METER MARKET, BY TYPE, 2021-2030 (USD THOUSAND)
TABLE 170 TAIWAN OPTICAL POWER METER MARKET, BY TYPE, 2021-2030 (USD THOUSAND)
TABLE 171 TAIWAN OPTICAL POWER METER MARKET, BY INSTRUMENT/PRODUCT TYPE, 2021-2030 (USD THOUSAND)
TABLE 172 TAIWAN HAND-HELD METER IN OPTICAL POWER METER MARKET, BY TYPE, 2021-2030 (USD THOUSAND)
TABLE 173 TAIWAN OPTICAL POWER METER MARKET, BY DETECTOR TYPE, 2021-2030 (USD THOUSAND)
TABLE 174 TAIWAN OPTICAL POWER METER MARKET, BY POWER RANGE, 2021-2030 (USD THOUSAND)
TABLE 175 TAIWAN OPTICAL POWER METER MARKET, BY WAVELENGTH, 2021-2030 (USD THOUSAND)
TABLE 176 TAIWAN OPTICAL POWER METER MARKET, BY LIGHT SOURCE, 2021-2030 (USD THOUSAND)
TABLE 177 TAIWAN OPTICAL POWER METER MARKET, BY APPLICATION, 2021-2030 (USD THOUSAND)
TABLE 178 TAIWAN OPTICAL POWER METER MARKET, BY END-USER 2021-2030 (USD THOUSAND)
TABLE 179 TAIWAN TELECOMMUNICATION INDUSTRY IN OPTICAL POWER METER MARKET, BY TYPE, 2021-2030 (USD THOUSAND)
TABLE 180 TAIWAN AUTOMOTIVE INDUSTRY IN OPTICAL POWER METER MARKET, BY TYPE, 2021-2030 (USD THOUSAND)
TABLE 181 TAIWAN MILITARY & AEROSPACE INDUSTRY IN OPTICAL POWER METER MARKET, BY TYPE, 2021-2030 (USD THOUSAND)
TABLE 182 TAIWAN ENERGY & UTILITIES INDUSTRY IN OPTICAL POWER METER MARKET, BY TYPE, 2021-2030 (USD THOUSAND)
TABLE 183 TAIWAN ELECTRICAL & ELECTRONICS INDUSTRY IN OPTICAL POWER METER MARKET, BY TYPE, 2021-2030 (USD THOUSAND)
TABLE 184 VIETNAM OPTICAL POWER METER MARKET, BY TYPE, 2021-2030 (USD THOUSAND)
TABLE 185 VIETNAM OPTICAL POWER METER MARKET, BY INSTRUMENT/PRODUCT TYPE, 2021-2030 (USD THOUSAND)
TABLE 186 VIETNAM HAND-HELD METER IN OPTICAL POWER METER MARKET, BY TYPE, 2021-2030 (USD THOUSAND)
TABLE 187 VIETNAM OPTICAL POWER METER MARKET, BY DETECTOR TYPE, 2021-2030 (USD THOUSAND)
TABLE 188 VIETNAM OPTICAL POWER METER MARKET, BY POWER RANGE, 2021-2030 (USD THOUSAND)
TABLE 189 VIETNAM OPTICAL POWER METER MARKET, BY WAVELENGTH, 2021-2030 (USD THOUSAND)
TABLE 190 VIETNAM OPTICAL POWER METER MARKET, BY LIGHT SOURCE, 2021-2030 (USD THOUSAND)
TABLE 191 VIETNAM OPTICAL POWER METER MARKET, BY APPLICATION, 2021-2030 (USD THOUSAND)
TABLE 192 VIETNAM OPTICAL POWER METER MARKET, BY END-USER 2021-2030 (USD THOUSAND)
TABLE 193 VIETNAM TELECOMMUNICATION INDUSTRY IN OPTICAL POWER METER MARKET, BY TYPE, 2021-2030 (USD THOUSAND)
TABLE 194 VIETNAM AUTOMOTIVE INDUSTRY IN OPTICAL POWER METER MARKET, BY TYPE, 2021-2030 (USD THOUSAND)
TABLE 195 VIETNAM MILITARY & AEROSPACE INDUSTRY IN OPTICAL POWER METER MARKET, BY TYPE, 2021-2030 (USD THOUSAND)
TABLE 196 VIETNAM ENERGY & UTILITIES INDUSTRY IN OPTICAL POWER METER MARKET, BY TYPE, 2021-2030 (USD THOUSAND)
TABLE 197 VIETNAM ELECTRICAL & ELECTRONICS INDUSTRY IN OPTICAL POWER METER MARKET, BY TYPE, 2021-2030 (USD THOUSAND)
TABLE 198 REST OF ASIA-PACIFIC OPTICAL POWER METER MARKET, BY TYPE, 2021-2030 (USD THOUSAND)
List of Figure
FIGURE 1 ASIA-PACIFIC OPTICAL POWER METER MARKET: SEGMENTATION
FIGURE 2 ASIA-PACIFIC OPTICAL POWER METER MARKET: DATA TRIANGULATION
FIGURE 3 ASIA-PACIFIC OPTICAL POWER METER MARKET: DROC ANALYSIS
FIGURE 4 ASIA-PACIFIC OPTICAL POWER METER MARKET: ASIA-PACIFIC VS. COUNTRY MARKET ANALYSIS
FIGURE 5 ASIA-PACIFIC OPTICAL POWER METER MARKET: INTERVIEW DEMOGRAPHICS
FIGURE 6 ASIA-PACIFIC OPTICAL POWER METER MARKET: DBMR MARKET POSITION GRID
FIGURE 7 ASIA-PACIFIC OPTICAL POWER METER MARKET: TYPE LIFE LINE CURVE
FIGURE 8 ASIA-PACIFIC OPTICAL POWER METER MARKET: MARKET APPLICATION COVERAGE GRID
FIGURE 9 ASIA-PACIFIC OPTICAL POWER METER MARKET: SEGMENTATION
FIGURE 10 INCREASING DEMAND FOR OPTICAL POWER METERS IN THE TELECOMMUNICATION INDUSTRY SEGMENT IS EXPECTED TO DRIVE THE GROWTH OF THE ASIA-PACIFIC OPTICAL POWER METER MARKET IN THE FORECAST PERIOD OF 2023 TO 2030
FIGURE 11 PHOTO DETECTORS SEGMENT IS EXPECTED TO ACCOUNT FOR THE LARGEST SHARE OF THE ASIA-PACIFIC OPTICAL POWER METER MARKET IN 2023 AND 2030
FIGURE 12 VALUE CHAIN ANALYSIS
FIGURE 13 DRIVERS, RESTRAINTS, OPPORTUNITIES, AND CHALLENGES OF THE ASIA-PACIFIC OPTICAL POWER METER MARKET
FIGURE 14 ASIA-PACIFIC OPTICAL POWER METER MARKET: BY TYPE, 2022
FIGURE 15 ASIA-PACIFIC OPTICAL POWER METER MARKET: BY INSTRUMENT/PRODUCT TYPE, 2022
FIGURE 16 ASIA-PACIFIC OPTICAL POWER METER MARKET: BY DETECTOR TYPE, 2022
FIGURE 17 ASIA-PACIFIC OPTICAL POWER METER MARKET: BY POWER RANGE, 2022
FIGURE 18 ASIA-PACIFIC OPTICAL POWER METER MARKET: BY WAVELENGTH, 2022
FIGURE 19 ASIA-PACIFIC OPTICAL POWER METER MARKET, BY LIGHT SOURCE, 2022
FIGURE 20 ASIA-PACIFIC OPTICAL POWER METER MARKET: BY APPLICATION, 2022
FIGURE 21 ASIA-PACIFIC OPTICAL POWER METER MARKET: BY END-USER, 2022
FIGURE 22 ASIA-PACIFIC OPTICAL POWER METER MARKET: SNAPSHOT (2022)
FIGURE 23 ASIA-PACIFIC OPTICAL POWER METER MARKET: BY COUNTRY (2022)
FIGURE 24 ASIA-PACIFIC OPTICAL POWER METER MARKET: BY COUNTRY (2023-2030)
FIGURE 25 ASIA-PACIFIC OPTICAL POWER METER MARKET: BY COUNTRY (2022-2030)
FIGURE 26 ASIA-PACIFIC OPTICAL POWER METER MARKET: BY TYPE (2023-2030)
FIGURE 27 ASIA-PACIFIC OPTICAL METER MARKET: COMPANY SHARE 2022 (%)
Asia Pacific Optical Power Meter Market, Supply Chain Analysis and Ecosystem Framework
To support market growth and help clients navigate the impact of geopolitical shifts, DBMR has integrated in-depth supply chain analysis into its Asia Pacific Optical Power Meter Market research reports. This addition empowers clients to respond effectively to global changes affecting their industries. The supply chain analysis section includes detailed insights such as Asia Pacific Optical Power Meter Market consumption and production by country, price trend analysis, the impact of tariffs and geopolitical developments, and import and export trends by country and HSN code. It also highlights major suppliers with data on production capacity and company profiles, as well as key importers and exporters. In addition to research, DBMR offers specialized supply chain consulting services backed by over a decade of experience, providing solutions like supplier discovery, supplier risk assessment, price trend analysis, impact evaluation of inflation and trade route changes, and comprehensive market trend analysis.
Data collection and base year analysis are done using data collection modules with large sample sizes. The stage includes obtaining market information or related data through various sources and strategies. It includes examining and planning all the data acquired from the past in advance. It likewise envelops the examination of information inconsistencies seen across different information sources. The market data is analysed and estimated using market statistical and coherent models. Also, market share analysis and key trend analysis are the major success factors in the market report. To know more, please request an analyst call or drop down your inquiry.
The key research methodology used by DBMR research team is data triangulation which involves data mining, analysis of the impact of data variables on the market and primary (industry expert) validation. Data models include Vendor Positioning Grid, Market Time Line Analysis, Market Overview and Guide, Company Positioning Grid, Patent Analysis, Pricing Analysis, Company Market Share Analysis, Standards of Measurement, Global versus Regional and Vendor Share Analysis. To know more about the research methodology, drop in an inquiry to speak to our industry experts.
Data Bridge Market Research is a leader in advanced formative research. We take pride in servicing our existing and new customers with data and analysis that match and suits their goal. The report can be customized to include price trend analysis of target brands understanding the market for additional countries (ask for the list of countries), clinical trial results data, literature review, refurbished market and product base analysis. Market analysis of target competitors can be analyzed from technology-based analysis to market portfolio strategies. We can add as many competitors that you require data about in the format and data style you are looking for. Our team of analysts can also provide you data in crude raw excel files pivot tables (Fact book) or can assist you in creating presentations from the data sets available in the report.


