
Asia Pacific Orthopedic Surgical Energy Devices Market
Market Size in USD Million
 USD
225.42 Million
USD
459.14 Million
2025
2033
USD
225.42 Million
USD
459.14 Million
2025
2033
| 2026 - 2033 | |
| USD 225.42 Million | |
| USD 459.14 Million | |
| % | |
|
Asia-Pacific Orthopedic Surgical Energy Devices Market Overview
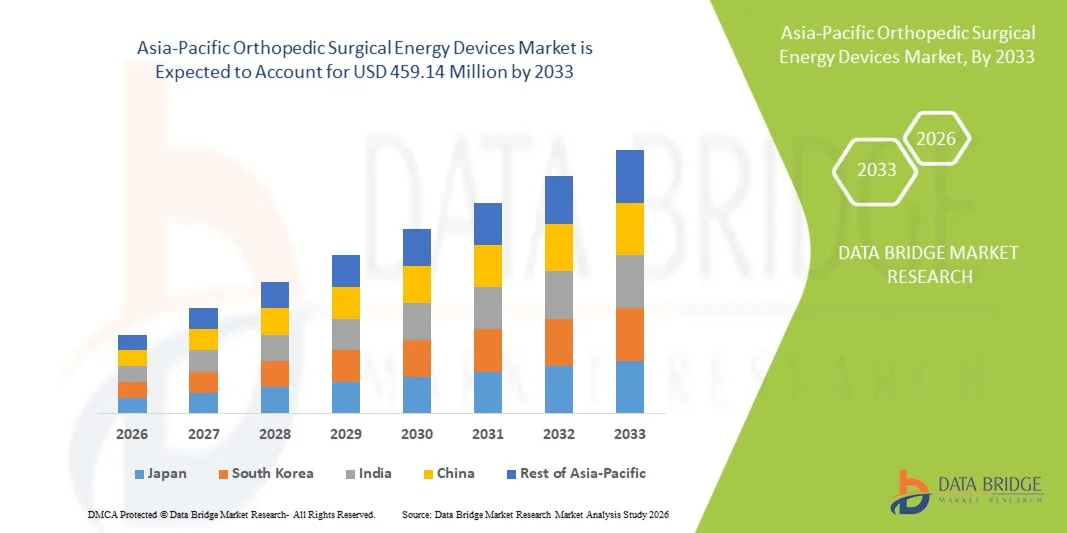
The Asia-Pacific orthopedic surgical energy devices market was valued at USD 225.42 million in 2025 and is projected to reach USD 459.14 million by 2033, growing at a CAGR of 9.30% from 2026 to 2033. The market is witnessing steady expansion driven by the rising prevalence of musculoskeletal disorders, increasing geriatric population, and growing adoption of minimally invasive orthopedic procedures across major economies such as China, Japan, India, and South Korea. Rapid improvements in healthcare infrastructure and expanding surgical volumes are further supporting market growth across both public and private hospital systems.
The increasing burden of sports injuries, trauma cases, and degenerative bone diseases is accelerating the demand for advanced orthopedic surgical energy devices, including ultrasonic, radiofrequency, and electrosurgical systems. In addition, the shift toward precision-based and minimally invasive orthopedic surgeries is encouraging surgeons to adopt technologies that enhance accuracy, reduce blood loss, and improve post-operative recovery times. Expanding investments in hospital modernization and the growing presence of global medical device manufacturers in the Asia-Pacific region are further strengthening market adoption and innovation.
Key Market Trends & Insights
- China dominated the Asia-Pacific orthopedic surgical energy devices market with the largest revenue share of 36.92% in 2025, supported by advanced hospital infrastructure, high orthopedic procedure volumes, and strong government investment in surgical modernization and minimally invasive technologies.
- The Handpieces segment led the market with a 42.18% share in 2025, driven by cost-effectiveness in clinical usage, ease of handling in surgical settings, and widespread adoption in complex orthopedic procedures.
- India is expected to be the fastest-growing country at a CAGR of 7.2% from 2026 to 2033, fueled by rising urbanization, increasing healthcare infrastructure investments, and growing adoption of advanced orthopedic surgical technologies.
- Ultrasound segment the fastest-growing technology segment, projected to register a CAGR of 7.1%, reflecting rising demand for precision-driven and minimally invasive surgical procedures.
- The Hip segment dominates the application category with a 44.07% revenue share in 2025, driven by increasing osteoarthritis prevalence, aging population, and growing hip replacement surgeries across major hospitals.
- Radiofrequency segment accounts for 59.68% of the market in 2025, preferred by large hospitals, surgical centers, and research institutions due to its high precision, reduced thermal tissue damage, and reliable low-latency performance in complex orthopedic surgical procedures.
- The Knee segment is the fastest-growing application category, with a CAGR of 6.9% from 2026 to 2033, driven by rising sports injuries, obesity rates, and increasing demand for arthroscopic knee procedures.
Market Size & Forecast
- Global Market Value (2025): USD 225.42 Million
- Expected Market Value (2033): USD 459.14 Million
- Forecast CAGR (2026–2033): 9.30%
- Leading Country in 2025: China
- Fastest Growing Country: India
Report Scope and Asia-Pacific Orthopedic Surgical Energy Devices Market Segmentation
|
Attributes |
Asia-Pacific Orthopedic Surgical Energy Devices Key Market Insights |
|
Segments Covered |
|
|
Countries Covered |
Asia-Pacific · China · Japan · India · South Korea · Singapore · Malaysia · Australia · Thailand · Indonesia · Philippines · Rest of Asia-Pacific |
|
Key Market Players |
· Stryker (U.S.) · Medtronic (Ireland) · Johnson & Johnson Services, Inc. (U.S.) · Smith & Nephew (U.K.) · Olympus Corporation (Japan) · B. Braun SE (Germany) · CONMED Corporation (U.S.) · Zimmer Biomet. (U.S.) · Boston Scientific Corporation (U.S.) · Karl Storz SE & Co. KG (Germany) · Erbe Elektromedizin GmbH (Germany) · KLS Martin Group (Germany) · Aesculap AG (Germany) · Applied Medical Resources Corporation (U.S.) · Integra LifeSciences Holdings Corporation (U.S.) · Richard Wolf GmbH (Germany) · Apyx Medical Corporation (U.S.) · BOWA-electronic GmbH & Co. KG (Germany) · Misonix, Inc. (Bioventus Inc.) (U.S.) · De Soutter Medical (U.K.) |
|
Market Opportunities |
· Rising demand for minimally invasive orthopedic procedures · Increasing adoption of hybrid energy platforms combining radiofrequency and ultrasound technologies · Expansion of ambulatory surgical centers (ASCs) is driving demand for compact, cost-efficient orthopedic surgical energy devices |
|
Value Added Data Infosets |
In addition to the insights on market scenarios such as market value, growth rate, segmentation, geographical coverage, and major players, the market reports curated by the Data Bridge Market Research also include in-depth expert analysis, patient epidemiology, pipeline analysis, pricing analysis, and regulatory framework. |
Asia-Pacific Orthopedic Surgical Energy Devices Market Trends
Trend: Expansion of Minimally Invasive Orthopedic Procedures and Energy-Based Surgery Adoption
Hospitals and orthopedic centers are increasingly shifting toward minimally invasive surgical techniques, driving demand for advanced energy-based devices such as radiofrequency, ultrasound, and electrosurgical systems. These technologies enable precise tissue cutting, reduced blood loss, and faster post-operative recovery. Surgeons are also adopting integrated energy platforms in arthroscopy and joint replacement procedures, supported by real-time visualization and improved surgical control, enhancing overall procedural efficiency and patient outcomes.
Asia-Pacific Orthopedic Surgical Energy Devices Market Dynamics
Key Market Driver: Rising Burden of Musculoskeletal Disorders and Orthopedic Surgeries
The increasing prevalence of osteoarthritis, sports injuries, and age-related joint degeneration is significantly boosting demand for orthopedic surgeries, thereby accelerating the adoption of surgical energy devices. Hospitals, ambulatory surgical centers, and specialty clinics are increasingly relying on energy-based systems to improve surgical precision, reduce operative time, and enhance patient recovery rates, particularly in hip and knee replacement procedures across emerging healthcare markets.
Key Restraint/Challenge: High Cost of Advanced Surgical Energy Systems & Training Requirements
A major restraint in the market is the high initial cost of advanced orthopedic surgical energy devices, along with ongoing maintenance and consumable expenses. In addition, the need for specialized surgical training and technical expertise limits adoption in smaller hospitals and resource-constrained healthcare facilities, particularly in emerging markets with limited reimbursement support. Limited reimbursement coverage in several emerging economies further restricts widespread adoption despite growing clinical demand.
For instance, the procurement and installation of advanced radiofrequency and ultrasound-based surgical platforms often involve high capital expenditure, along with additional costs for calibration, disposable accessories, and system upgrades. Moreover, hospitals must invest in structured surgeon training programs to ensure safe and effective usage, which further increases the overall cost burden and slows adoption in mid-sized orthopedic centers and rural healthcare facilities.
Key Market Opportunity: Integration of Smart Surgical Systems and AI-Assisted Orthopedic Procedures
The integration of artificial intelligence and smart surgical navigation systems presents a major opportunity in the orthopedic surgical energy devices market. AI-enabled platforms can assist surgeons in real-time decision-making, optimize energy delivery during procedures, and improve surgical accuracy. In addition, the development of connected operating rooms and data-driven surgical ecosystems is expected to enhance procedural efficiency and open new growth avenues across advanced and emerging healthcare markets.
Asia-Pacific Orthopedic Surgical Energy Devices Market Scope
The Asia-Pacific Orthopedic Surgical Energy Devices market is segmented on the basis of product, technology, application, end user, and distribution channel.
- By Product
On the basis of product, the orthopedic surgical energy devices market is segmented into handpieces and accessories. The Handpieces segment dominated the market with a 42.18% share in 2025, driven by its essential role in delivering controlled surgical energy across a wide range of orthopedic procedures including arthroscopy, trauma fixation, and joint reconstruction. These devices are widely preferred due to their precision handling, compatibility with multiple energy systems, and ability to improve surgical efficiency in complex procedures. Increasing adoption of minimally invasive techniques and rising orthopedic surgical volumes further strengthen segment dominance. Hospitals and surgical centers also favor handpieces due to their reliability and procedural consistency. Continuous technological advancements in ergonomic design and energy delivery systems are further enhancing their clinical utility.
The Accessories segment is projected to register the fastest growth at a CAGR of 7.4% from 2026 to 2033, driven by increasing demand for disposable components and procedure-specific attachments. Accessories play a critical role in improving precision, safety, and efficiency during orthopedic surgeries, particularly in minimally invasive procedures. Rising surgical volumes and repeat usage requirements are significantly boosting recurring demand for these products. Growth in ambulatory surgical centers and outpatient orthopedic procedures is further accelerating adoption. In addition, innovations in single-use surgical accessories are reducing infection risks and improving procedural outcomes.
- By Technology
On the basis of technology, the orthopedic surgical energy devices market is segmented into radiation, radiofrequency, ultrasound, microwave, and others. The Radiofrequency segment dominated the market with a 59.68% share in 2025, owing to its superior ability to provide precise tissue ablation with minimal thermal spread, making it highly suitable for delicate orthopedic procedures. It is widely used in arthroscopy, soft tissue management, and joint repair surgeries due to its controlled energy delivery and consistent clinical outcomes. Hospitals prefer radiofrequency devices because of their proven safety profile and procedural efficiency. Increasing prevalence of musculoskeletal disorders is further driving adoption. Strong integration with minimally invasive surgical techniques continues to reinforce its market leadership. Continuous improvements in RF generator systems are also enhancing performance and usability.
The Ultrasound segment is projected to register the fastest growth at a CAGR of 7.1% from 2026 to 2033, driven by its ability to enable highly selective tissue cutting with reduced damage to surrounding structures. Ultrasound-based devices are gaining traction in complex orthopedic procedures due to their precision and improved patient recovery outcomes. Surgeons are increasingly adopting these systems for minimally invasive surgeries requiring high accuracy. Technological advancements in ultrasonic blade efficiency and energy modulation are further supporting growth. Rising demand for bloodless surgical fields is also contributing to adoption. Expansion of advanced orthopedic centers globally is accelerating segment penetration.
- By Application
On the basis of application, the orthopedic surgical energy devices market is segmented into hip and knee. The Hip segment dominated the market with a 44.07% share in 2025, driven by a high incidence of osteoarthritis and age-related degenerative conditions requiring hip replacement surgeries. Energy devices are extensively used in hip procedures for precision cutting and soft tissue management, improving surgical outcomes. Increasing elderly population and rising awareness of advanced surgical treatments are further supporting demand. Hospitals are increasingly adopting energy-based tools to reduce operative time and improve recovery rates. Strong clinical preference for minimally invasive hip procedures continues to strengthen dominance. Growing orthopedic surgical volumes in both developed and emerging markets also contribute significantly.
The Knee segment is projected to register the fastest growth at a CAGR of 6.9% from 2026 to 2033, fueled by rising sports injuries, obesity-related joint disorders, and increasing ligament reconstruction surgeries. Demand for arthroscopic knee procedures is increasing due to faster recovery and reduced hospitalization time. Advancements in minimally invasive knee surgery techniques are further boosting adoption. Growing participation in sports and physical activities is increasing injury rates globally. Surgeons are increasingly using energy devices for precision in ligament and cartilage repair. Expanding healthcare infrastructure is also supporting rapid segment growth.
- By End User
On the basis of end user, the orthopedic surgical energy devices market is segmented into hospitals & clinics, ambulatory surgical centers (ASCs), and others. The Hospitals & Clinics segment dominated the market with a 61.85% share in 2025, driven by high patient inflow and availability of advanced surgical infrastructure. These facilities are equipped to handle complex orthopedic procedures requiring sophisticated energy-based devices. Presence of skilled orthopedic surgeons further strengthens segment dominance. Hospitals also benefit from strong procurement capacity and established surgical workflows. Increasing adoption of minimally invasive surgeries is further supporting usage. Continuous investment in advanced surgical technologies enhances their leadership position.
The Ambulatory Surgical Centers (ASCs) segment is projected to register the fastest growth at a CAGR of 7.3% from 2026 to 2033, driven by rising preference for outpatient orthopedic procedures and cost-effective treatment options. ASCs offer shorter recovery times and reduced hospital stays, making them attractive for patients. Increasing investments in small-scale surgical infrastructure are boosting adoption. Growing demand for minimally invasive procedures is further accelerating growth. Surgeons prefer ASCs for routine orthopedic interventions with lower complication risks. Expansion of private healthcare networks is also supporting segment development.
- By Distribution Channel
On the basis of distribution channel, the orthopedic surgical energy devices market is segmented into direct tender and third-party distributors. The Direct Tender segment dominated the market with a 59.12% share in 2025, driven by bulk procurement by hospitals, government healthcare systems, and large institutions. This channel ensures cost efficiency, standardized pricing, and long-term supply agreements with manufacturers. Hospitals prefer direct tenders for better negotiation power and reliable product availability. Strong adoption in public healthcare systems further reinforces dominance. Increasing demand for large-scale orthopedic procedures supports this procurement model. Streamlined regulatory approvals also facilitate direct purchasing.
The Third-Party Distributors segment is projected to register the fastest growth at a CAGR of 6.8% from 2026 to 2033, driven by expanding healthcare access in emerging markets and fragmented supply chains. Distributors help improve product availability in smaller hospitals and rural healthcare facilities. They also provide after-sales support and faster logistics solutions. Rising penetration of orthopedic devices in tier-2 and tier-3 cities is boosting demand. Manufacturers rely on distributors for market expansion in cost-sensitive regions. Increasing private healthcare growth is further accelerating this channel’s expansion.
Asia-Pacific Orthopedic Surgical Energy Devices Market Regional Analysis
China dominated the Asia-Pacific orthopedic surgical energy devices market with the largest revenue share of 36.92% in 2025, supported by advanced hospital infrastructure, high orthopedic procedure volumes, and strong government investment in surgical modernization and minimally invasive technologies. The region also benefits from rapid adoption of minimally invasive surgical technologies, expanding orthopedic care facilities, and increasing presence of global medical device manufacturers. Rising prevalence of osteoarthritis, sports injuries, and age-related bone disorders continues to drive demand for advanced energy-based surgical systems. Growing investments in surgical training, expanding medical tourism, and continuous technological upgrades in hospitals further strengthen China’s leadership position in the Asia-Pacific market.
The China Orthopedic Surgical Energy Devices Market Insight
The China orthopedic surgical energy devices market is witnessing strong growth due to rising orthopedic procedure volumes, rapid expansion of hospital infrastructure, and increasing adoption of minimally invasive surgical technologies. The country’s large patient pool suffering from osteoarthritis, sports injuries, and trauma-related conditions is driving demand for advanced energy-based surgical systems. In addition, growing investments in smart hospitals, increasing medical device manufacturing capabilities, and strong government support for healthcare modernization are accelerating market adoption across major urban centers. Continuous technological advancements in radiofrequency and ultrasound-based surgical platforms are further strengthening China’s leadership in the regional market.
Japan Orthopedic Surgical Energy Devices Market Insight
The Japan orthopedic surgical energy devices market remains highly advanced, supported by a rapidly aging population, high incidence of degenerative bone diseases, and strong focus on precision-based surgical care. The country’s well-established healthcare system and early adoption of minimally invasive orthopedic procedures are driving consistent demand for radiofrequency and ultrasound energy devices. Increasing integration of robotics and advanced imaging technologies in surgical procedures is further enhancing treatment accuracy. Moreover, strong emphasis on patient safety, reduced recovery time, and technological innovation continues to support steady market expansion across leading hospitals and orthopedic centers.
India Orthopedic Surgical Energy Devices Market Insight
The India orthopedic surgical energy devices market is expected to witness rapid growth due to rising prevalence of orthopedic disorders, increasing road accidents, and growing demand for joint replacement surgeries. Expanding healthcare infrastructure, rising investments in private hospitals, and improving access to advanced surgical technologies are significantly boosting adoption. The country is also experiencing increasing awareness of minimally invasive procedures that offer faster recovery and lower hospitalization costs. Furthermore, growing medical tourism and expansion of tier-2 and tier-3 city healthcare facilities are accelerating the penetration of advanced orthopedic surgical energy devices.
South Korea Orthopedic Surgical Energy Devices Market Insight
The South Korea orthopedic surgical energy devices market is witnessing steady growth due to increasing adoption of advanced minimally invasive orthopedic procedures and strong integration of digital surgical technologies in hospitals. The country’s highly developed healthcare system, combined with rapid uptake of radiofrequency and ultrasound-based surgical devices, is driving market expansion across major orthopedic centers. Rising cases of sports injuries, aging population-related joint disorders, and increasing demand for precision-based surgeries are further supporting growth. In addition, strong investments in smart hospitals, robotics-assisted surgery, and AI-enabled surgical platforms are enhancing procedural accuracy and accelerating the adoption of next-generation orthopedic surgical energy devices.
Asia-Pacific Orthopedic Surgical Energy Devices Market Share
The Asia-Pacific Orthopedic Surgical Energy Devices industry is primarily led by well-established companies, including:
- Stryker (U.S.)
- Medtronic (Ireland)
- Johnson & Johnson Services, Inc. (U.S.)
- Smith & Nephew (U.K.)
- Olympus Corporation (Japan)
- B. Braun SE (Germany)
- CONMED Corporation (U.S.)
- Zimmer Biomet. (U.S.)
- Boston Scientific Corporation (U.S.)
- Karl Storz SE & Co. KG (Germany)
- Erbe Elektromedizin GmbH (Germany)
- KLS Martin Group (Germany)
- Aesculap AG (Germany)
- Applied Medical Resources Corporation (U.S.)
- Integra LifeSciences Holdings Corporation (U.S.)
- Richard Wolf GmbH (Germany)
- Apyx Medical Corporation (U.S.)
- BOWA-electronic GmbH & Co. KG (Germany)
- Misonix, Inc. (Bioventus Inc.) (U.S.)
- De Soutter Medical (U.K.)
Latest Developments in Asia-Pacific Orthopedic Surgical Energy Devices Market
- In March 2025, Johnson & Johnson MedTech, a global healthcare technology company, announced the launch of the DUALTO Energy System, an advanced integrated surgical energy platform designed to combine monopolar, bipolar, ultrasonic, and advanced bipolar energy in a single system. The platform is designed to enhance operating room efficiency and reduce device switching during complex procedures, including orthopedic surgeries such as joint reconstruction and soft tissue management. The system supports both open and minimally invasive surgeries, aligning with the growing demand for precision-based orthopedic interventions across Asia-Pacific healthcare facilities. This launch highlights the industry’s shift toward multi-energy platforms improving surgical workflow and procedural accuracy
- In January 2025, Olympus Corporation, a global medical technology company, expanded its surgical energy portfolio by advancing its energy-based platforms for minimally invasive surgical applications. The company focused on enhancing precision energy delivery systems used in orthopedic and soft tissue procedures. These advancements aim to improve surgical control, reduce tissue damage, and support faster patient recovery outcomes. The innovation reflects increasing demand for high-performance energy devices in Japan and broader Asia-Pacific markets
- In August 2024, Stryker Corporation, a leading medical technology company, strengthened its surgical energy solutions portfolio by expanding its advanced energy device applications across orthopedic and surgical specialties. The development emphasized improved precision cutting and coagulation performance for minimally invasive procedures. These upgrades are widely applicable in orthopedic surgeries such as arthroscopy and joint repair. The expansion supports increasing adoption of energy-based surgical tools across hospitals in China, Japan, and South Korea
- In June 2023, B. Braun Melsungen AG, a global medical device company, expanded its electrosurgical and surgical energy solutions portfolio across Asia-Pacific healthcare markets. The company focused on improving safety, precision, and efficiency in energy-based surgical procedures. Its devices are widely used in orthopedic, trauma, and general surgical applications. This expansion strengthened accessibility of advanced surgical technologies in emerging Asian healthcare systems
- In April 2022, Smith+Nephew, a global medical technology company, enhanced its surgical energy and arthroscopic product portfolio with upgraded minimally invasive surgical systems. The development focused on improving soft tissue management and precision energy delivery in orthopedic procedures. These advancements are increasingly used in knee and hip surgeries across Asia-Pacific hospitals. The upgrade supports the growing trend of minimally invasive orthopedic surgery adoption in the region
SKU-

- Interactive Data Analysis Dashboard
- Company Analysis Dashboard for high growth potential opportunities
- Research Analyst Access for customization & queries
- Competitor Analysis with Interactive dashboard
- Latest News, Updates & Trend analysis
- Harness the Power of Benchmark Analysis for Comprehensive Competitor Tracking
Data collection and base year analysis are done using data collection modules with large sample sizes. The stage includes obtaining market information or related data through various sources and strategies. It includes examining and planning all the data acquired from the past in advance. It likewise envelops the examination of information inconsistencies seen across different information sources. The market data is analysed and estimated using market statistical and coherent models. Also, market share analysis and key trend analysis are the major success factors in the market report. To know more, please request an analyst call or drop down your inquiry.
The key research methodology used by DBMR research team is data triangulation which involves data mining, analysis of the impact of data variables on the market and primary (industry expert) validation. Data models include Vendor Positioning Grid, Market Time Line Analysis, Market Overview and Guide, Company Positioning Grid, Patent Analysis, Pricing Analysis, Company Market Share Analysis, Standards of Measurement, Global versus Regional and Vendor Share Analysis. To know more about the research methodology, drop in an inquiry to speak to our industry experts.
Data Bridge Market Research is a leader in advanced formative research. We take pride in servicing our existing and new customers with data and analysis that match and suits their goal. The report can be customized to include price trend analysis of target brands understanding the market for additional countries (ask for the list of countries), clinical trial results data, literature review, refurbished market and product base analysis. Market analysis of target competitors can be analyzed from technology-based analysis to market portfolio strategies. We can add as many competitors that you require data about in the format and data style you are looking for. Our team of analysts can also provide you data in crude raw excel files pivot tables (Fact book) or can assist you in creating presentations from the data sets available in the report.


