
Asia Pacific Padded Mailers Market
Market Size in USD Billion
 USD
2.34 Billion
USD
3.45 Billion
2025
2033
USD
2.34 Billion
USD
3.45 Billion
2025
2033
| 2026 - 2033 | |
| USD 2.34 Billion | |
| USD 3.45 Billion | |
| % | |
|
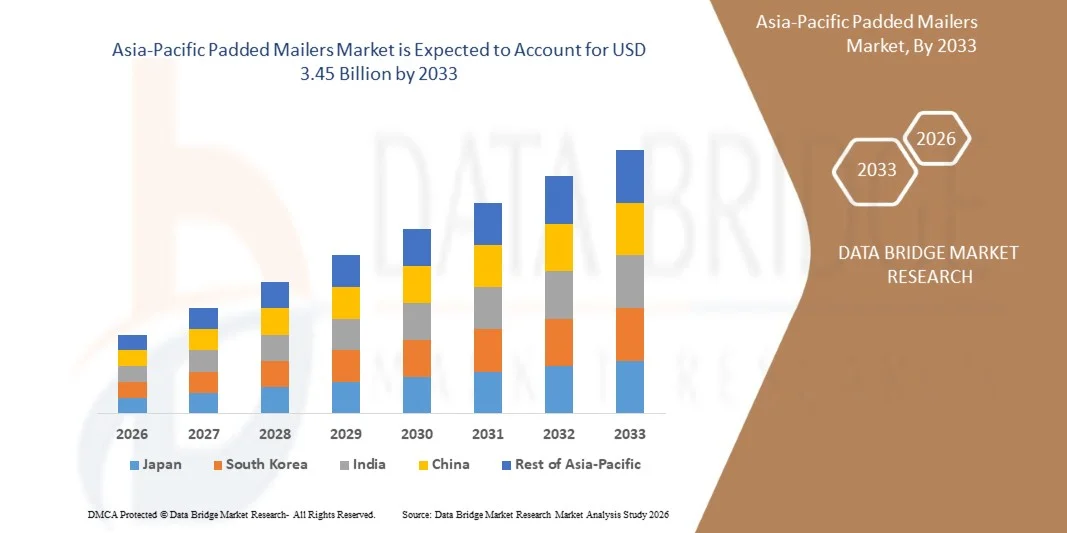
Asia-Pacific Padded Mailers Market Size
- The Asia-Pacific Padded Mailers Market size was valued at USD 2.34 billion in 2025 and is expected to reach USD 3.45 billion by 2033, at a CAGR of 5.0% during the forecast period
- The market growth is largely fueled by the rapid expansion of e-commerce and the rising demand for lightweight, cost-effective, and protective packaging solutions across various industries, including retail, electronics, and healthcare
- Furthermore, increasing environmental awareness and regulatory pressure are driving the shift toward sustainable packaging alternatives, prompting manufacturers to develop recyclable and fiber-based padded mailers that align with circular economy goals, thereby accelerating market penetration
Asia-Pacific Padded Mailers Market Analysis
- Padded mailers are cushioned packaging envelopes designed to protect products during shipment while keeping shipping costs low due to their lightweight structure. They are widely used for shipping small to medium-sized items such as books, electronics, jewelry, and pharmaceuticals across both B2C and B2B channels
- The escalating demand for padded mailers in the U.S. is primarily driven by the surge in online shopping, increasing focus on product safety during transit, and the growing preference for eco-friendly, paper-based mailers over traditional plastic-based alternatives
- China dominated the Asia-Pacific Padded Mailers Market in 2025, due to its strong manufacturing ecosystem, extensive export operations, and growing e-commerce penetration
- India is expected to be the fastest growing country in the Asia-Pacific Padded Mailers Market during the forecast period due to booming e-commerce activity, expanding retail infrastructure, and rising awareness of sustainable packaging alternatives
- Self-seal segment dominated the market with a market share of 63.9% in 2025, due toits convenience, efficiency, and strong adhesive strength that ensures secure packaging. Businesses across e-commerce and retail sectors prefer self-seal padded mailers as they reduce manual effort and packaging time while maintaining tamper-proof protection during transit. Their cost-effectiveness and compatibility with automated packaging systems also contribute to their widespread adoption across logistics and postal services
Report Scope and Asia-Pacific Padded Mailers Market Segmentation
|
Attributes |
Asia-Pacific Padded Mailers Key Market Insights |
|
Segments Covered |
|
|
Countries Covered |
Asia-Pacific
|
|
Key Market Players |
|
|
Market Opportunities |
|
|
Value Added Data Infosets |
In addition to the insights on market scenarios such as market value, growth rate, segmentation, geographical coverage, and major players, the market reports curated by the Data Bridge Market Research also include import export analysis, production capacity overview, production consumption analysis, price trend analysis, climate change scenario, supply chain analysis, value chain analysis, raw material/consumables overview, vendor selection criteria, PESTLE Analysis, Porter Analysis, and regulatory framework. |
Asia-Pacific Padded Mailers Market Trends
“Rising Expansion of E-Commerce and Sustainable Packaging Innovation”
- A key trend influencing the Asia-Pacific Padded Mailers Market is the accelerating expansion of e-commerce platforms coupled with growing innovation in sustainable packaging solutions. The rise in online retailing is driving substantial demand for lightweight, protective, and cost-efficient packaging formats suited for shipping small and delicate items securely
- For instance, Sealed Air Corporation introduced eco-designed bubble mailers incorporating recycled plastics and paper-based cushioning layers. These products reduce material usage while maintaining durability and product protection, aligning with global sustainability and e-commerce shipping requirements
- The increasing focus on environmental compliance and corporate sustainability goals is encouraging the shift toward compostable and recyclable padded mailers. Manufacturers are developing paper-based alternatives and bio-based polymers to minimize the environmental footprint while offering comparable tear resistance and cushioning performance
- Customization and branding trends are also reshaping the market as e-commerce companies seek to enhance brand appeal. Printed padded mailers with company logos and eco-certifications are being adopted to reinforce consumer trust and align packaging with sustainable brand values
- Advancements in material science and digital printing technologies are enabling production of high-quality padded mailers with improved recyclability, moisture resistance, and energy-efficient manufacturing. This innovation allows producers to address varying product protection needs while maintaining cost control and environmental balance
- The combined momentum of e-commerce growth and sustainable innovation indicates a transformative phase for the padded mailers industry. As logistics, branding, and environmental considerations converge, manufacturers are positioned to capitalize on rising consumer and corporate demand for eco-efficient protective mailers
Asia-Pacific Padded Mailers Market Dynamics
Driver
“Increasing Shipping of Individual Products”
- The growing volume of individual product shipments, primarily driven by online retail and direct-to-consumer models, is a major driver of the Asia-Pacific Padded Mailers Market. The need for compact, lightweight, and secure packaging solutions suitable for individual deliveries has strengthened the demand for protective mailers across multiple industries
- For instance, Amazon and Shopify merchants increasingly utilize bubble and paper-based mailers for shipping apparel, cosmetics, and electronics directly to consumers. These products offer reliable cushioning, reduced shipping weight, and cost efficiency compared with traditional corrugated packaging options
- The rise in small parcel logistics and the trend toward minimal packaging waste are encouraging businesses to adopt padded mailers as an environmentally responsible and cost-effective packaging alternative. This shift aligns with global carbon reduction goals while addressing last-mile delivery efficiency
- The growing consumer expectation for safe and undamaged product delivery is reinforcing the adoption of padded mailers with enhanced protection layers and tamper-evident closures. E-commerce brands are also prioritizing user-friendly and easy-to-recycle mailers to improve customer experience
- The expansion of online marketplaces, combined with increasing cross-border shipping and reliance on flexible packaging formats, is expected to sustain strong market growth for padded mailers. This demand surge highlights their essential role in modern distribution channels focused on small, frequent parcel delivery
Restraint/Challenge
“Volatility in Raw Material Prices and Recycling Infrastructure”
- Fluctuations in raw material prices and the lack of robust recycling infrastructure represent key challenges restraining the Asia-Pacific Padded Mailers Market. Variability in the cost of plastic resins, paper fibers, and adhesives directly impacts production expenses and pricing strategies for packaging manufacturers
- For instance, major packaging producers such as Storopack and Pregis have faced significant material cost fluctuations resulting from shifts in global crude oil markets and pulp supply shortages. These changes have influenced product pricing and affected profit margins for both suppliers and distributors
- The complex composition of mixed-material mailers, often combining paper and plastic films, creates barriers to efficient recycling. Limited processing capabilities at recycling facilities hinder the proper separation and reprocessing of such materials, leading to waste management inefficiencies
- The uneven availability of recycling infrastructure across regions, particularly in developing economies, slows down the circular economy transition. This limitation reduces the overall environmental effectiveness of sustainable mailer initiatives and increases producer responsibility costs
- To mitigate these challenges, companies are investing in mono-material solutions, local material sourcing, and extended producer responsibility programs. Strengthening recycling systems, standardizing material composition, and stabilizing raw material supply chains will be essential for achieving long-term growth and environmental resilience in the Asia-Pacific Padded Mailers Market
Asia-Pacific Padded Mailers Market Scope
The market is segmented on the basis of type, capacity, size, distribution channel, and application.
- By Type
On the basis of type, the Asia-Pacific Padded Mailers Market is segmented into self-seal and peel-and-seal. The self-seal segment dominated the market with the largest revenue share of 63.9% in 2025, primarily due to its convenience, efficiency, and strong adhesive strength that ensures secure packaging. Businesses across e-commerce and retail sectors prefer self-seal padded mailers as they reduce manual effort and packaging time while maintaining tamper-proof protection during transit. Their cost-effectiveness and compatibility with automated packaging systems also contribute to their widespread adoption across logistics and postal services.
The peel-and-seal segment is projected to witness the fastest growth rate from 2026 to 2033, driven by its superior user convenience and enhanced sealing integrity. Peel-and-seal padded mailers offer a quick, mess-free closure mechanism that appeals to both consumers and packaging professionals in industries such as cosmetics and electronics. The segment’s growth is also fueled by the increasing use of sustainable and recyclable peel-and-seal materials, meeting the rising demand for eco-friendly packaging alternatives.
- By Capacity
On the basis of capacity, the market is segmented into less than 300 g, 300 to 500 g, 500 to 1000 g, 1000 to 2000 g, and above 2000 g. The 300 to 500 g segment dominated the market in 2025, as this range is most commonly used for mailing medium-sized items such as books, apparel, and electronic accessories. This capacity offers an ideal balance between protection and cost-effectiveness, making it a preferred choice for e-commerce retailers and courier companies managing diverse shipment sizes.
The 500 to 1000 g segment is anticipated to witness the fastest CAGR from 2026 to 2033, supported by the growth in online retailing of heavier consumer goods. This category offers increased durability and cushioning, protecting fragile and valuable items such as gadgets and automotive parts. With the rising demand for premium protective packaging in global shipping, padded mailers with higher weight capacities are becoming a critical solution for secure and efficient logistics.
- By Size
On the basis of size, the Asia-Pacific Padded Mailers Market is segmented into 10 in. x 13 in., 9 in. x 12 in., and 6 in. x 9 in. The 10 in. x 13 in. segment dominated the market in 2025, primarily due to its versatility in accommodating larger documents, apparel, and medium-sized retail products. Businesses prefer this size for its balance of flexibility and protection, ensuring minimal product damage during long-distance transportation.
The 9 in. x 12 in. segment is expected to grow at the fastest rate from 2026 to 2033, owing to increasing adoption for mailing compact but valuable goods such as small electronics and books. This size is widely utilized by e-commerce platforms and publishers for lightweight yet protective packaging. The growing trend of personalized packaging solutions further accelerates demand for 9 in. x 12 in. padded mailers that combine efficient size optimization with eco-friendly materials.
- By Distribution Channel
On the basis of distribution channel, the Asia-Pacific Padded Mailers Market is segmented into supermarket/hypermarket, e-commerce, specialty store, and others. The e-commerce segment dominated the market in 2025, driven by the exponential growth of online retail and direct-to-consumer brands. E-commerce platforms prefer padded mailers due to their lightweight structure, which reduces shipping costs, and their ability to provide superior protection during multi-stage deliveries. The expansion of global logistics networks has further boosted the segment’s prominence.
The specialty store segment is anticipated to register the fastest growth from 2026 to 2033, owing to the increasing demand for customized and premium packaging solutions. Specialty stores often offer branded or decorative padded mailers tailored for specific product categories such as gifts or jewelry. Growing consumer inclination toward aesthetically appealing packaging and sustainable material use is enhancing the adoption of padded mailers in this segment.
- By Application
On the basis of application, the market is segmented into pharmaceuticals, electrical and electronics, automotive and allied industries, food and beverages, cosmetics and personal care, books & audio CDs, jewelry, gifts, frames, watches & novelties, videocassettes, and others. The e-commerce-driven electrical and electronics segment dominated the market in 2025 due to the rising shipment of compact electronic goods requiring padded protection. These mailers offer cushioning that safeguards sensitive devices from impact, moisture, and vibration, making them a preferred packaging solution for online retailers.
The cosmetics and personal care segment is projected to grow at the fastest rate from 2026 to 2033, propelled by the surge in global beauty product shipments. Padded mailers provide secure, lightweight, and visually appealing packaging options for fragile cosmetic containers and small skincare kits. As consumer awareness toward sustainable and branded packaging grows, cosmetics companies increasingly adopt recyclable padded mailers to enhance both product safety and environmental responsibility.
Asia-Pacific Padded Mailers Market Regional Analysis
- China dominated the Asia-Pacific Padded Mailers Market with the largest revenue share in 2025, driven by its strong manufacturing ecosystem, extensive export operations, and growing e-commerce penetration
- The country’s leadership is further reinforced by the availability of cost-effective raw materials and large-scale production facilities catering to domestic and international demand. Robust government policies promoting sustainable packaging solutions, along with the rapid adoption of recyclable paper-based mailers, continue to strengthen China’s dominance
- The presence of major manufacturers, ongoing investments in automated packaging technology, and collaborations with global logistics companies consolidate China’s leading position in the regional market
Japan Asia-Pacific Padded Mailers Market Insight
The Japan market is expected to grow steadily from 2026 to 2033, supported by its advanced packaging technology and strong focus on environmentally sustainable solutions. Japanese manufacturers are increasingly emphasizing recyclable and biodegradable padded mailers, aligning with national sustainability goals and consumer eco-consciousness. The growing popularity of high-quality packaging for electronics, cosmetics, and luxury goods further drives demand. Continuous innovation in lightweight materials, combined with Japan’s focus on precision, design, and performance, ensures consistent market expansion. Collaborations between local packaging firms and global e-commerce platforms further enhance market penetration across the country.
India Asia-Pacific Padded Mailers Market Insight
India is projected to register the fastest CAGR in the Asia-Pacific Padded Mailers Market during 2026–2033, fueled by booming e-commerce activity, expanding retail infrastructure, and rising awareness of sustainable packaging alternatives. The surge in online shopping and logistics services across tier I and II cities is propelling the use of protective mailers for small parcel deliveries. Demand for affordable, durable, and recyclable packaging materials is increasing among local retailers and courier firms. Government initiatives promoting sustainable manufacturing, along with growing participation from domestic paper and packaging producers, position India as the fastest-growing market in the region during the forecast period.
Asia-Pacific Padded Mailers Market Share
The padded mailers industry is primarily led by well-established companies, including:
- Vereinigte Papierwarenfabriken GmbH (Germany)
- Sealed Air (U.S.)
- Pregis LLC (U.S.)
- ProAmpac (U.S.)
- Intertape Polymer Group (Canada)
- Polycell Packaging Corp (Taiwan)
- PAC Worldwide Corporation. (U.S.)
- STOROPACK HANS REICHENECKER GMBH (Germany)
- abrisojiffy.com (Belgium)
- Bravo Pack Inc (U.S.)
- 3M (U.S.)
- LPS Industries. (U.S.)
- AP Packaging Corp. (U.S.)
- Sonoco ThermoSafe (U.S.)
- Smurfit Kappa (Ireland)
- DS Smith (U.K.)
Latest Developments in Asia-Pacific Padded Mailers Market
- In September 2024, Mondi, a global leader in sustainable packaging and paper, introduced its fully recyclable paper-based Protective Mailers in collaboration with Amazon. This innovation marked a major advancement in the Asia-Pacific Padded Mailers Market by accelerating the transition toward plastic-free, eco-friendly packaging. By eliminating the need for traditional plastic bubble wrap, Mondi’s paper mailers cater to the growing regulatory and consumer emphasis on sustainability, reinforcing the industry’s shift toward circular economy practices and environmentally responsible e-commerce solutions
- In 2023, CompanyBox advanced the sustainability landscape of the Asia-Pacific Padded Mailers Market with the launch of 100% recyclable and compostable paper mailers featuring eco-friendly water-based inks. This development strengthened the company’s positioning among environmentally conscious consumers and retailers, addressing the growing preference for green packaging alternatives. The move contributed to market momentum toward biodegradable solutions that balance durability with minimal environmental impact
- In 2021, Georgia-Pacific expanded its production capabilities to manufacture curbside recyclable paper padded mailers, a step that significantly boosted the availability of eco-friendly packaging options. This expansion aligned with the rising global demand for sustainable shipping materials and enhanced Georgia-Pacific’s role in meeting the packaging industry’s sustainability goals. The initiative also supported retailers in adopting recyclable solutions to reduce plastic waste and comply with evolving environmental standards
- In 2020, PREGIS LLC revolutionized productivity within the Asia-Pacific Padded Mailers Market by launching the MAX-PRO 24 poly bagging system. The system’s automated operations improved packaging efficiency and reduced labor costs, enabling faster order fulfillment for e-commerce and logistics companies. This development set a new benchmark for operational performance, positioning PREGIS as a key innovator in enhancing manufacturing speed and cost-effectiveness within the padded mailers sector
- In 2020, Intertape Polymer Group responded to shifting market needs by launching a new line of Social Distancing Tape designed for safety and reliability during the pandemic. This product introduction reflected the company’s adaptability in addressing pandemic-related challenges and maintaining supply chain continuity. By expanding its product portfolio to support safe and organized shipping environments, Intertape strengthened its presence and resilience in the Asia-Pacific Padded Mailers Market during a period of global disruption
SKU-

- Interactive Data Analysis Dashboard
- Company Analysis Dashboard for high growth potential opportunities
- Research Analyst Access for customization & queries
- Competitor Analysis with Interactive dashboard
- Latest News, Updates & Trend analysis
- Harness the Power of Benchmark Analysis for Comprehensive Competitor Tracking
Asia Pacific Padded Mailers Market, Supply Chain Analysis and Ecosystem Framework
To support market growth and help clients navigate the impact of geopolitical shifts, DBMR has integrated in-depth supply chain analysis into its Asia Pacific Padded Mailers Market research reports. This addition empowers clients to respond effectively to global changes affecting their industries. The supply chain analysis section includes detailed insights such as Asia Pacific Padded Mailers Market consumption and production by country, price trend analysis, the impact of tariffs and geopolitical developments, and import and export trends by country and HSN code. It also highlights major suppliers with data on production capacity and company profiles, as well as key importers and exporters. In addition to research, DBMR offers specialized supply chain consulting services backed by over a decade of experience, providing solutions like supplier discovery, supplier risk assessment, price trend analysis, impact evaluation of inflation and trade route changes, and comprehensive market trend analysis.
Data collection and base year analysis are done using data collection modules with large sample sizes. The stage includes obtaining market information or related data through various sources and strategies. It includes examining and planning all the data acquired from the past in advance. It likewise envelops the examination of information inconsistencies seen across different information sources. The market data is analysed and estimated using market statistical and coherent models. Also, market share analysis and key trend analysis are the major success factors in the market report. To know more, please request an analyst call or drop down your inquiry.
The key research methodology used by DBMR research team is data triangulation which involves data mining, analysis of the impact of data variables on the market and primary (industry expert) validation. Data models include Vendor Positioning Grid, Market Time Line Analysis, Market Overview and Guide, Company Positioning Grid, Patent Analysis, Pricing Analysis, Company Market Share Analysis, Standards of Measurement, Global versus Regional and Vendor Share Analysis. To know more about the research methodology, drop in an inquiry to speak to our industry experts.
Data Bridge Market Research is a leader in advanced formative research. We take pride in servicing our existing and new customers with data and analysis that match and suits their goal. The report can be customized to include price trend analysis of target brands understanding the market for additional countries (ask for the list of countries), clinical trial results data, literature review, refurbished market and product base analysis. Market analysis of target competitors can be analyzed from technology-based analysis to market portfolio strategies. We can add as many competitors that you require data about in the format and data style you are looking for. Our team of analysts can also provide you data in crude raw excel files pivot tables (Fact book) or can assist you in creating presentations from the data sets available in the report.


