
Asia Pacific Paper Cone Market
Market Size in USD Billion
 USD
3.42 Billion
USD
5.75 Billion
2024
2032
USD
3.42 Billion
USD
5.75 Billion
2024
2032
| 2025 - 2032 | |
| USD 3.42 Billion | |
| USD 5.75 Billion | |
| % | |
|
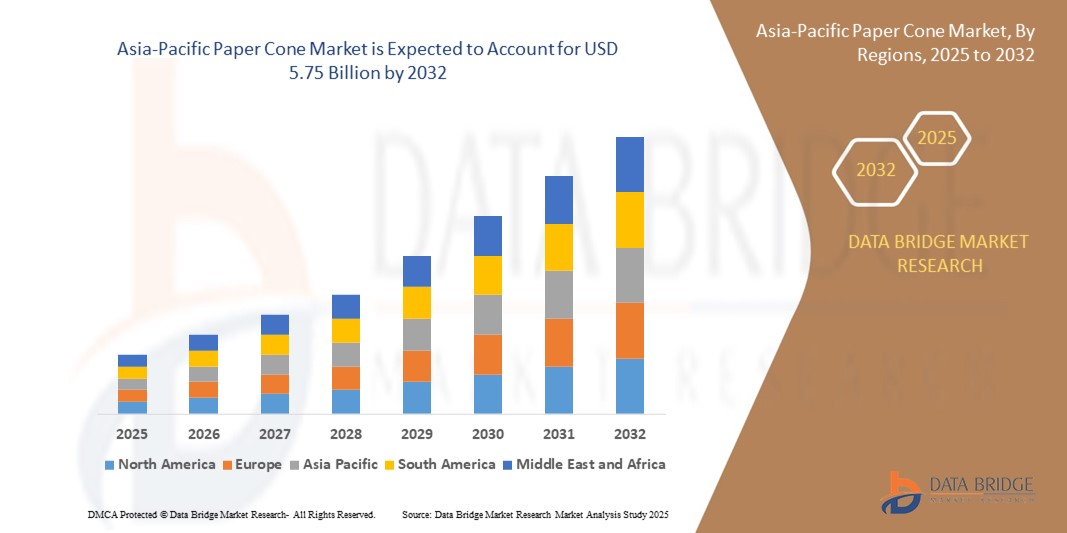
Asia-Pacific Paper Cone Market Size
- The Asia-Pacific paper cone market size was valued at USD 3.42 billion in 2024 and is expected to reach USD 5.75 billion by 2032, at a CAGR of 6.70% during the forecast period
- The market growth is largely fuelled by the expansion of the textile and yarn manufacturing industry, rising demand for eco-friendly and biodegradable packaging solutions, and government regulations promoting sustainable materials in place of plastic-based cones
- The presence of low-cost labor and raw material supports the growth of paper cone production, attracting domestic and international investments in the region
Asia-Pacific Paper Cone Market Analysis
- The growing preference for sustainable packaging materials is significantly shaping the paper cone market across Asia-Pacific, especially in textile-intensive countries such as India, Bangladesh, and Vietnam
- Increasing export demand for yarn and fabrics has driven the adoption of paper cones, which are essential for yarn winding, storage, and transportation
- China paper cone market held the largest revenue share in Asia-Pacific in 2024, supported by the country’s dominant position in the global textile industry and its rapidly growing domestic construction sector
- Japan is expected to witness the highest compound annual growth rate (CAGR) in the Asia-Pacific paper cone market due to rising demand for premium-quality, eco-friendly paper cones tailored for high-end textile applications
- The tight bong paper cone segment dominated the market with the largest market revenue share in 2024, driven by its wide usage in the textile industry for yarn winding and its cost-effectiveness. This type of cone is valued for its durability and ability to handle high-speed operations, making it a preferred choice in spinning mills across the region
Report Scope and Asia-Pacific Paper Cone Market Segmentation
|
Attributes |
Asia-Pacific Paper Cone Key Market Insights |
|
Segments Covered |
|
|
Countries Covered |
Asia-Pacific
|
|
Key Market Players |
|
|
Market Opportunities |
• Growing Textile Manufacturing Base in Emerging Economies • Adoption of Sustainable and Biodegradable Packaging Solutions |
|
Value Added Data Infosets |
In addition to the insights on market scenarios such as market value, growth rate, segmentation, geographical coverage, and major players, the market reports curated by the Data Bridge Market Research also include import export analysis, production capacity overview, production consumption analysis, price trend analysis, climate change scenario, supply chain analysis, value chain analysis, raw material/consumables overview, vendor selection criteria, PESTLE Analysis, Porter Analysis, and regulatory framework. |
Asia-Pacific Paper Cone Market Trends
“Surge in Demand for Sustainable and Biodegradable Packaging Solutions”
- Rising environmental awareness is encouraging manufacturers to adopt biodegradable paper cone packaging
- Government bans on single-use plastics are pushing industries toward eco-friendly alternatives
- Growing consumer preference for compostable and recyclable packaging across various sectors
- Businesses are replacing plastic yarn cones with kraft paper cones to reduce landfill waste
- Increased adoption of green packaging practices in food and textile industries
- For instance, A textile cluster in Tamil Nadu, India, shifted from plastic cones to recyclable paper cones to meet European buyers' sustainability criteria
Asia-Pacific Paper Cone Market Dynamics
Driver
“Expansion of the Textile Industry in Emerging Economies”
- Rapid growth in textile production in countries such as India, Vietnam, and Bangladesh boosts demand
- High yarn output drives large-scale adoption of paper cones for winding and transportation
- Paper cones are preferred over plastic for their cost-effectiveness and environmental compliance
- Global exports of yarns and fabrics require consistent and quality packaging materials
- Automation in spinning mills supports the need for dimensionally stable paper cones
- For instance, In India, several spinning mills adopted automated winding machines using kraft paper cones to enhance efficiency and reduce plastic use
Restraint/Challenge
“Volatility in Raw Material Prices”
- Kraft paper and adhesive prices fluctuate due to global supply chain imbalances
- Rising input costs compress profit margins, especially for small and medium manufacturers
- Shortage of high-grade recycled paper affects production consistency and quality
- Manufacturers face challenges in maintaining competitive pricing due to input cost hikes
- Supply disruptions hinder timely delivery and strain client relationships
- For instance, In Vietnam, local manufacturers faced difficulties sourcing kraft paper, forcing temporary shutdowns and delays in export orders
Asia-Pacific Paper Cone Market Scope
The market is segmented on the basis of type, number of piles, taper of the cone, size, distribution channel, and end-user.
• By Type
On the basis of type, the Asia-Pacific paper cone market is segmented into tight bong paper cone, jumbo paper cone, yarn paper cone, printed paper cone, bobbins, textile paper cone, wax paper cone, conical paper cone, construction cone, plain paper cone, and others. The tight bong paper cone segment dominated the market with the largest market revenue share in 2024, driven by its wide usage in the textile industry for yarn winding and its cost-effectiveness. This type of cone is valued for its durability and ability to handle high-speed operations, making it a preferred choice in spinning mills across the region.
The yarn paper cone segment is expected to witness the fastest growth rate from 2025 to 2032, supported by the rising demand for yarn packaging in textile production hubs such as India and Bangladesh. The segment's growth is further strengthened by increasing exports of yarn-based products, which necessitate reliable and efficient cone solutions.
• By Number of Piles
On the basis of number of piles, the Asia-Pacific paper cone market is segmented into single ply and multiple ply. The multiple ply segment held the largest market revenue share in 2024 due to its enhanced strength and structural integrity, making it suitable for heavy-duty applications.
The single ply segment is expected to witness the fastest growth rate from 2025 to 2032, owing to its cost-efficiency and rising usage in lightweight textile processes.
• By Taper of the Cone
On the basis of taper of the cone, the Asia-Pacific paper cone market is segmented into up to 30 taper, 30 to 50 taper, and above 50 taper. The 30 to 50 taper segment accounted for the largest revenue share in 2024, driven by its optimal balance between stability and yarn-holding capacity, making it a standard fit across various yarn processing units.
The above 50 taper segment is expected to witness the fastest growth rate from 2025 to 2032, fueled by its increasing use in specialized yarn applications that require higher winding speeds and greater precision. Manufacturers across the Asia-Pacific region are gradually adopting these cones for advanced textile machinery setups, particularly in high-end fabric production and export-oriented spinning operations.
• By Size
On the basis of size, the Asia-Pacific paper cone market is segmented into 1-degree 51-minutes cone, 3-degree 51-minutes cone, 5-degree 57-minutes cone, 3-degree 30-minutes cone, 6-degree 20-minutes cone, 9-degree 51-minutes cone, 9-degree 36-minutes cone, 7-degree 22-minutes cone, and others. The 5-degree 57-minutes cone segment held the dominant position in 2024 owing to its widespread adoption in the regional spinning and textile mills.
The 9-degree 36-minutes cone segment is expected to witness the fastest growth rate from 2025 to 2032, as manufacturers seek more specialized cone dimensions tailored for advanced textile applications.
• By Distribution Channel
On the basis of distribution channel, the Asia-Pacific paper cone market is segmented into direct sales/B2B, specialist retailers, convenience stores, supermarkets/hypermarkets, e-commerce, and others. The direct sales/B2B segment led the market in 2024, as large-scale textile manufacturers prefer direct procurement to ensure consistent supply and cost efficiency.
The e-commerce segment is expected to witness the fastest growth rate from 2025 to 2032, propelled by increasing digitalization and preference for online sourcing of industrial supplies.
• By End-User
On the basis of end-user, the Asia-Pacific paper cone market is segmented into textile, construction, and others. The textile segment dominated the market with the largest revenue share in 2024 due to the region's strong presence in textile manufacturing and export.
The construction segment is expected to witness the fastest growth rate from 2025 to 2032, driven by increasing usage of paper cones in civil and infrastructure projects for purposes such as marking and lightweight material applications.
Asia-Pacific Paper Cone Market Regional Analysis
- The China paper cone market held the largest revenue share in Asia-Pacific in 2024, supported by the country’s dominant position in the global textile industry and its rapidly growing domestic construction sector
- The surge in garment and yarn production, combined with extensive use of textile cones and bobbins, is a key growth driver
- In addition, China’s ongoing efforts to improve sustainable packaging practices are fostering the adoption of biodegradable and recyclable paper cones across various industries
Japan Paper Cone Market Insight
The Japan paper cone market is expected to experience steady growth, led by a focus on high-quality, precision-engineered cones for industrial and specialty textile applications. Japanese manufacturers prioritize product consistency, recyclable material use, and compact design—key preferences in the domestic market. The integration of automated cone winding machinery and advancements in cone customization are also supporting market expansion.
Asia-Pacific Paper Cone Market Share
The Asia-Pacific Paper Cone industry is primarily led by well-established companies, including:
- Conitex Sonoco (India)
- Saroja Texcone (India)
- Pacific Cones (India)
- Savio Texcone Private Limited (India)
- Sunnytexcone India (P) Ltd (India)
- Bharath Paper Conversions (India)
- JTS Group of Companies (India)
- Mandahar Group of Companies (India)
- NEW TOYO (VIETNAM)
- Royal Paper (India)
SKU-

- Interactive Data Analysis Dashboard
- Company Analysis Dashboard for high growth potential opportunities
- Research Analyst Access for customization & queries
- Competitor Analysis with Interactive dashboard
- Latest News, Updates & Trend analysis
- Harness the Power of Benchmark Analysis for Comprehensive Competitor Tracking
Asia Pacific Paper Cone Market, Supply Chain Analysis and Ecosystem Framework
To support market growth and help clients navigate the impact of geopolitical shifts, DBMR has integrated in-depth supply chain analysis into its Asia Pacific Paper Cone Market research reports. This addition empowers clients to respond effectively to global changes affecting their industries. The supply chain analysis section includes detailed insights such as Asia Pacific Paper Cone Market consumption and production by country, price trend analysis, the impact of tariffs and geopolitical developments, and import and export trends by country and HSN code. It also highlights major suppliers with data on production capacity and company profiles, as well as key importers and exporters. In addition to research, DBMR offers specialized supply chain consulting services backed by over a decade of experience, providing solutions like supplier discovery, supplier risk assessment, price trend analysis, impact evaluation of inflation and trade route changes, and comprehensive market trend analysis.
Data collection and base year analysis are done using data collection modules with large sample sizes. The stage includes obtaining market information or related data through various sources and strategies. It includes examining and planning all the data acquired from the past in advance. It likewise envelops the examination of information inconsistencies seen across different information sources. The market data is analysed and estimated using market statistical and coherent models. Also, market share analysis and key trend analysis are the major success factors in the market report. To know more, please request an analyst call or drop down your inquiry.
The key research methodology used by DBMR research team is data triangulation which involves data mining, analysis of the impact of data variables on the market and primary (industry expert) validation. Data models include Vendor Positioning Grid, Market Time Line Analysis, Market Overview and Guide, Company Positioning Grid, Patent Analysis, Pricing Analysis, Company Market Share Analysis, Standards of Measurement, Global versus Regional and Vendor Share Analysis. To know more about the research methodology, drop in an inquiry to speak to our industry experts.
Data Bridge Market Research is a leader in advanced formative research. We take pride in servicing our existing and new customers with data and analysis that match and suits their goal. The report can be customized to include price trend analysis of target brands understanding the market for additional countries (ask for the list of countries), clinical trial results data, literature review, refurbished market and product base analysis. Market analysis of target competitors can be analyzed from technology-based analysis to market portfolio strategies. We can add as many competitors that you require data about in the format and data style you are looking for. Our team of analysts can also provide you data in crude raw excel files pivot tables (Fact book) or can assist you in creating presentations from the data sets available in the report.


