
Market Analysis and Size
Plasticized polyvinyl chloride (PVC) compounds are adhesives used in manufacturing different types of flexible PVCs with different applications in different industry sectors. Majorly, plasticized polyvinyl chloride (PVC) compound producing technologies are used in the manufacturing of finished end-products such as pipes, hoses, bags, and others which are used in building and construction, piping and insulation, healthcare, automobile, and wire and cable.
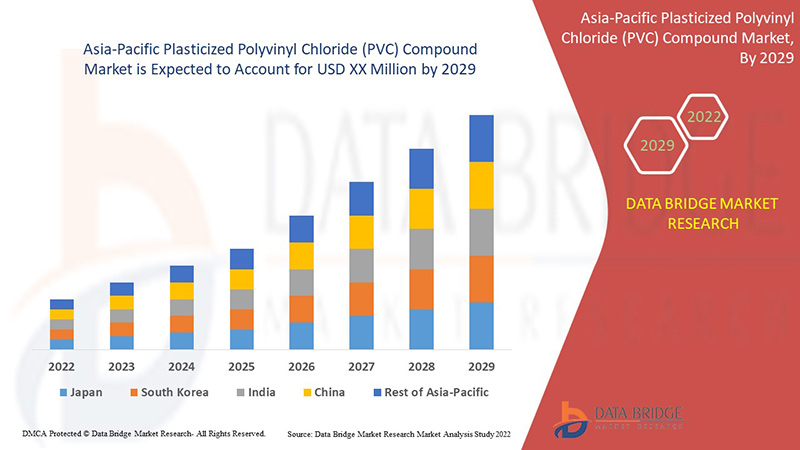
These plasticized polyvinyl chlorides (PVC) compounds are manufactured by two different processes, injection molding and extrusion. They are extracted from salts and crude oil. Data Bridge Market Research analyses that the plasticized polyvinyl chloride (PVC) compound market is expected to grow at a CAGR of 4.7% during the forecast period. " Film and Sheet" accounts for the most prominent application segment in the respective market owing to the rise in plasticized polyvinyl chloride (PVC) compounds. The market report curated by the Data Bridge Market Research team includes in-depth expert analysis, import/export analysis, pricing analysis, production consumption analysis, and climate chain scenario.
|
Report Metric |
Details |
|
Forecast Period |
2022 to 2029 |
|
Base Year |
2021 |
|
Historic Years |
2020 (Customizable to 2019 - 2014) |
|
Quantitative Units |
Revenue in USD Million, Volume in Kilo Tons, Pricing in USD |
|
Segments Covered |
Form (Dry and Wet), Manufacturing Process (Injection Molding, Extrusion, Others), Application (Film and Sheet, Wire and Cabling, Pipe and Fitting, Profiles and Tubes and Others), End Use (Medical, Building and Construction, Packaging, Automotive, Consumer Goods, Electrical and Electronics, Others) |
|
Countries Covered |
Japan, China, India, South Korea, Australia, Singapore, Malaysia, Thailand, Indonesia, Philippines, Rest of the Asia-Pacific |
|
Market Players Covered |
INEOS, Westlake Corporation, Formosa Plastics Corporation, Ercros SA, Teknor Apex, BENVIC, Zhonglian Chemical |
Market Definition
The PVC compound is based on the combination of polymers that give a formulation for the finished products necessary as per the requirement of the end-user. It is manufactured by mixing different ingredients of PVC raw materials, which are then converted into a jelly-like substance useful for manufacturing finished goods. Several types of raw materials are used in manufacturing the PVC compound, such as plasticizers, stabilizers, lubricants, fillers, and alloying polymers. Plasticized polyvinyl chloride (PVC) compound contains plasticizers and softening agents, which give a rubber-like property. Flexible PVC compounds provide flexibility to the products. Plasticized polyvinyl chloride (PVC) compounds are mostly used to manufacture the medical tubing, automotive body, electrical wiring, and others. These products need flexibility, so plasticized polyvinyl chloride (PVC) compounds are used in their manufacturing.
Regulatory Framework
- According regulations by environmental protection agency (EPA) imposed by environmental protection agency (EPA), it regulates the manufacturing of polyvinyl chloride (PVC). This regulation helps to reduce PVC factory emissions of air toxins.
COVID-19 had a Minimal Impact on Asia-Pacific Plasticized Polyvinyl Chloride (PVC) Compound Market
COVID-19 impacted various manufacturing industries in the year 2020-2021 as it led to the closure of workplaces, disruption of supply chains, and restrictions on transportation. However, no significant impact was noticed on their plasticized polyvinyl chloride (PVC) compound in Asia-Pacific operations and supply chain, as the import and export of vaccines and essential goods led to the increasing demand for plasticized polyvinyl chloride (PVC) compound. This growing awareness and governmental push for the research and development and new plasticized polyvinyl chloride (PVC) compounds increase the growth of plasticized polyvinyl chloride (PVC) compound market.
The Market Dynamics of the Asia-Pacific Plasticized Polyvinyl Chloride (PVC) Compound Market Include:
Drivers/Opportunities faced by the Asia-Pacific Plasticized Polyvinyl Chloride (PVC) Compound Market
- Growing building and construction activities in developing countries
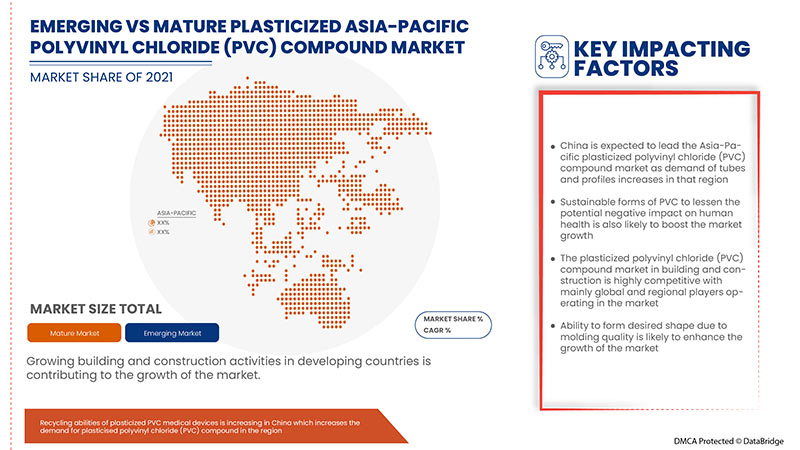
The countries are investing a huge sum of money in construction activities, moving toward the path of development. So, the increasing building and construction activities in developing countries have increased the usage of plasticized PVC compound products, which is expected to drive the growth of the Asia-Pacific plasticized PVC compound market.
- Increasing demand for tubes and profiles
Increasing urbanization has increased the demand for plasticized PVC tubes and fittings. According to an article of World's Top Exports by Daniel Workman published in 2020, the Asia-Pacific sales for exported items made from plastic from all countries were worth a total of USD 85.3 billion in 2020, which is higher by an average of 26.3% from all exporting countries since 2016. So, the increasing demand for tubes and profiles in various sectors has increased the usage of plasticized PVC compounds in the production of molding tubes and profiles. Hence, the growing demand for tubes and profiles is expected to drive market growth.
- Ability to form desired shape due to molding quality
Plasticized PVC compounds have a variety of applications due to their low cost and mechanical and physical properties. In the medical sector, it is commonly used in blood collection bags as it is flexible and unbreakable, which are preferred in modern blood banks as it is crucial in healthcare. The softness of the flexible plasticized PVC compound ensures comfortable medical devices. Also, it has various other applications and benefits in packaging, households and construction activities. So, the molding quality that helps to get any desired shape increases the demand for plasticized PVC compound manufactured products in the market. This leads to increased demand for plasticized PVC compounds, acting as a driver in the plasticized PVC compound market.
- Recycling abilities of Plasticized PVC medical devices
The plasticized PVC medical devices are recyclable and can be reformed into various new products. So, instead of wasting money on disposing of waste material and spending money on producing new material, the best way is to recycle the products. Sometimes, commodity prices of plasticized PVC compounds rise and provide financial incentive to utilize recycled PVC in manufacturing, encouraging the manufacturing units to use recycled PVC compounds. The recycling nature of the plasticized PVC compound products has increased its demand in the production of secondary products which are used in the medical sector. Hence, the recycling properties of plasticized PVC medical devices are expected to drive the plasticized PVC compound market growth.
Restraints/Challenges faced by the Asia-Pacific Plasticized Polyvinyl Chloride (PVC) Compound Market
- Temperature effect on plasticized PVC compound
Plasticized PVC compounds are used to manufacture the finished goods used in different atmospheric conditions. When plasticized PVC compounds are exposed to dynamic atmospheric conditions, various factors affect plasticized PVC compounds, such as UV radiations and temperature change which leads to the fissure of bonds within the plasticized PVC compound, separation of hydrogen chloride and formation of new bonds in plasticized PVC compound. Thus, from the above statements, it can be stated that high temperature has a bad effect on the plasticized PVC compound, which leads to a shorter life span of plasticized PVC finished goods
- Phasing out plasticized PVC in hospitals
The health care industry is concerned about plasticized PVC products as several government bodies have issued warnings about products manufactured from PVC. The patients, particularly infants, are at risk of health from products containing plasticized PVC compound due to its serious side effects. Researchers found that sick infants treated in neonatal intensive care units had higher exposure to toxicants in their bodies. Thus, it can be concluded from the above statements that medical products and equipment manufactured through plasticized PVC compounds are infectious to infants, due to which, the demand for the plasticized PVC compound in the medical industry may fall in the near future.
Recent Developments
- In January 2022, Westlake launched GreenVin Polyvinyl Chloride (PVC), a lower-carbon alternative PVC. It is launched by one of its subsidiaries, Vinnolit subsidiary in Germany. It is mostly used in the construction, automotive and medical sectors. This will help the company to increase its product portfolio.
- In September 2018, INEOS Company expanded its business by setting up a production plant in Belgium to produce PVC. This development will help the company gain more market share in the PVC compound market.
Asia-Pacific Plasticized Polyvinyl Chloride (PVC) Compound Market Scope
The Asia-Pacific plasticized polyvinyl chloride (PVC) compound market is segmented on the basis of form, manufacturing process, application, and end use. The growth amongst these segments will help you analyze meagre growth segments in the industries and provide the users with a valuable market overview and market insights to help them make strategic decisions for identifying core market applications.
Form
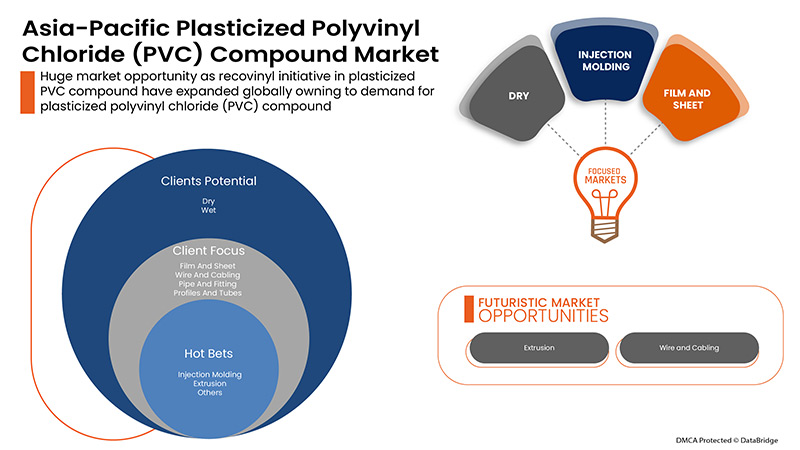
- Dry
- Wet
On the basis of form, the Asia-Pacific plasticized polyvinyl chloride (PVC) compound market is segmented into dry and wet.
Manufacturing Process
- Injection Molding
- Extrusion
- Others
On the basis of the manufacturing process, the Asia-Pacific plasticized polyvinyl chloride (PVC) compound market is segmented into injection molding, extrusion, and others.
Application
- Film And Sheet
- Wire And Cabling
- Pipe And Fitting,
- Profiles And Tubes
- Others
On the basis of application, the Asia-Pacific plasticized polyvinyl chloride (PVC) compound market is segmented into film and sheet, wire and cabling, pipe and fitting, profiles and tubes, others.
End Use
- Medical
- Building And Construction
- Packaging
- Automotive
- Consumer Goods
- Electrical And Electronics
- Others
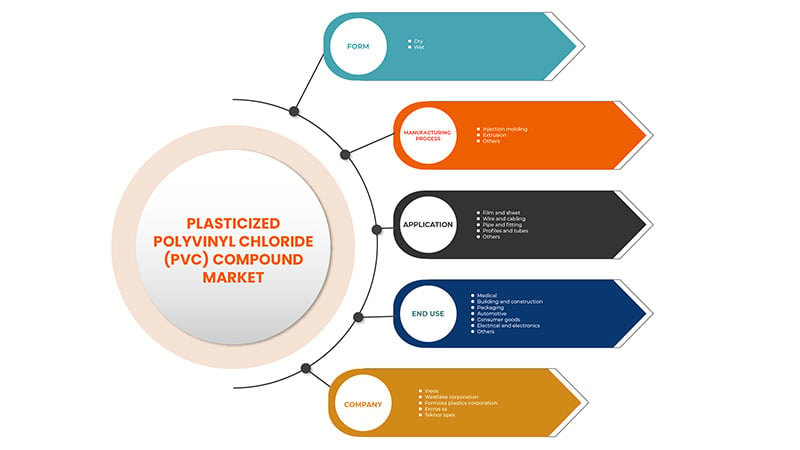
On the basis of end use, the Asia-Pacific plasticized polyvinyl chloride (PVC) compound market is segmented into medical, building and construction, packaging, automotive, consumer goods, electrical and electronics, others.
Asia-Pacific Plasticized Polyvinyl Chloride (PVC) Compound Market Regional Analysis/Insights
The Asia-Pacific plasticized polyvinyl chloride (PVC) compound market is analyzed, and market size insights and trends are provided by country, form, manufacturing process, application, and end use, as referenced above.
The countries covered in the Asia-Pacific plasticized polyvinyl chloride (PVC) compound market report are Japan, China, India, South Korea, Australia, Singapore, Malaysia, Thailand, Indonesia, Philippines, Rest of Asia-Pacific.
China is dominating the market due to the recycling abilities of plasticized PVC medical devices and growing building and construction activities in developing countries. Due to the recovinyl initiative in plasticized PVC compounds in the region and the plasticized polyvinyl chloride (PVC) compound, manufacturers are engaged in developing new plasticized polyvinyl chloride (PVC) compounds products in the region is propelling the region's demand for plasticized polyvinyl chloride (PVC) compound.
The country section of the report also provides individual market impacting factors and changes in market regulation that impact the current and future trends of the market. Data points such as downstream and upstream value chain analysis, technical trends, porter's five forces analysis, and case studies are some of the pointers used to forecast the market scenario for individual countries. Also, the presence and availability of Asia-Pacific brands and their challenges faced due to large or scarce competition from local and domestic brands, the impact of domestic tariffs and trade routes are considered while providing forecast analysis of the country data.
Competitive Landscape and Asia-Pacific Plasticized Polyvinyl Chloride (PVC) Compound Market Share Analysis
The Asia-Pacific plasticized polyvinyl chloride (PVC) compound market competitive landscape provides competitors' details. Details included are company overview, company financials, revenue generated, market potential, investment in research and development, new market initiatives, Asia-Pacific presence, production sites and facilities, production capacities, company strengths and weaknesses, product launch, product width and breadth, application dominance. The above data points provided are only related to the companies' focus related to Asia-Pacific plasticized polyvinyl chloride (PVC) compound market.
Some major players operating in the plasticized polyvinyl chloride (PVC) compound market are INEOS, Westlake Corporation, Formosa Plastics Corporation, Ercros SA, Teknor Apex, BENVIC, Zhonglian Chemical, among others.
SKU-

- Interactive Data Analysis Dashboard
- Company Analysis Dashboard for high growth potential opportunities
- Research Analyst Access for customization & queries
- Competitor Analysis with Interactive dashboard
- Latest News, Updates & Trend analysis
- Harness the Power of Benchmark Analysis for Comprehensive Competitor Tracking
Table of Content
1 INTRODUCTION
1.1 OBJECTIVES OF THE STUDY
1.2 MARKET DEFINITION
1.3 OVERVIEW OF ASIA PACIFIC PLASTICISED POLYVINYL CHLORIDE (PVC) COMPOUND MARKET
1.4 LIMITATION
1.5 MARKETS COVERED
2 MARKET SEGMENTATION
2.1 MARKETS COVERED
2.2 GEOGRAPHICAL SCOPE
2.3 YEARS CONSIDERED FOR THE STUDY
2.4 CURRENCY AND PRICING
2.5 DBMR TRIPOD DATA VALIDATION MODEL
2.6 FORM LIFELINE CURVE
2.7 MULTIVARIATE MODELING
2.8 PRIMARY INTERVIEWS WITH KEY OPINION LEADERS
2.9 DBMR MARKET POSITION GRID
2.1 MARKET CONSUMER CATEGORY COVERAGE GRID
2.11 DBMR MARKET CHALLENGE MATRIX
2.12 DBMR VENDOR SHARE ANALYSIS
2.13 IMPORT-EXPORT DATA
2.14 SECONDARY SOURCES
2.15 ASSUMPTIONS
3 EXECUTIVE SUMMARY
4 PREMIUM INSIGHTS
4.1 OVERVIEW: PLASTICIZERS’ USE IN ASIA PACIFIC PLASTICISED POLYVINYL CHLORIDE (PVC) COMPOUND INDUSTRY
4.2 PESTLE ANALYSIS
4.2.1 POLITICAL FACTORS:
4.2.2 ECONOMIC FACTORS:
4.2.3 SOCIAL FACTORS:
4.2.4 TECHNOLOGICAL FACTORS:
4.2.5 LEGAL FACTORS:
4.2.6 ENVIRONMENTAL FACTORS:
4.3 PORTER’S FIVE FORCES:
4.3.1 THREAT OF NEW ENTRANTS:
4.3.2 THREAT OF SUBSTITUTES:
4.3.3 CUSTOMER BARGAINING POWER:
4.3.4 SUPPLIER BARGAINING POWER:
4.3.5 INTERNAL COMPETITION (RIVALRY):
4.4 SUPPLY CHAIN ANALYSIS
4.4.1 OVERVIEW
4.4.2 LOGISTIC COST SCENARIO
4.4.3 IMPORTANCE OF LOGISTICS SERVICE PROVIDERS
4.5 VENDOR SELECTION CRITERIA
4.6 ASIA PACIFIC PLASTICISED POLYVINYL CHLORIDE (PVC) COMPOUND MARKET, TECHNOLOGICAL ADVANCEMENTS BY MANUFACTURERS
4.6.1 TECHNOLOGICAL ADVANCEMENTS BY MANUFACTURERS
4.7 RAW MATERIAL PRODUCTION COVERAGE
4.8 PRODUCTION AND CONSUMPTION ANALYSIS
4.9 ASIA PACIFIC PLASTICISED POLYVINYL CHLORIDE (PVC) COMPOUND MARKET, IMPACT OF REGULATIONS
4.9.1 REGULATORY FRAMWORK
5 IMPORT EXPORT SCENARIO
6 CLIMATE CHANGE SCENARIO
7 MARKET OVERVIEW
7.1 DRIVERS
7.1.1 GROWING BUILDING AND CONSTRUCTION ACTIVITIES IN DEVELOPING COUNTRIES
7.1.2 INCREASING DEMAND FOR TUBES AND PROFILES
7.1.3 ABILITY TO FORM DESIRED SHAPE DUE TO MOLDING QUALITY
7.1.4 RECYCLING ABILITIES OF PLASTICISED PVC MEDICAL DEVICES
7.2 RESTRAINTS
7.2.1 TEMPERATURE EFFECT ON PLASTICISED PVC COMPOUND
7.2.2 PHASING OUT PLASTICISED PVC IN HOSPITALS
7.3 OPPORTUNITIES
7.3.1 RECOVINYL INITIATIVE IN PVC COMPOUND
7.3.2 SUSTAINABLE FORMS OF PVC TO LESSEN THE POTENTIAL NEGATIVE IMPACT ON HUMAN HEALTH
7.4 CHALLENGES
7.4.1 PLASTISED PVC COMPOUND CAUSES ENVIRONMENT AND HEALTH CONCERNS IN MANUFACTURING UNITS
7.4.2 DIFFICULTY IN WASTE MANAGEMENT OF PVC COMPOUND
8 ASIA PACIFIC PLASTICISED POLYVINYL CHLORIDE (PVC) COMPOUND MARKET, BY FORM
8.1 OVERVIEW
8.2 DRY
8.3 WET
9 ASIA PACIFIC PLASTICISED POLYVINYL CHLORIDE (PVC) COMPOUND MARKET, BY MANUFACTURING PROCESS
9.1 OVERVIEW
9.2 INJECTION MOLDING
9.3 EXTRUSION
9.4 OTHERS
10 ASIA PACIFIC PLASTICISED POLYVINYL CHLORIDE (PVC) COMPOUND MARKET, BY APPLICATION
10.1 OVERVIEW
10.2 FILM AND SHEET
10.2.1 DRY
10.2.2 WET
10.3 WIRE AND CABLING
10.3.1 DRY
10.3.2 WET
10.4 PIPE AND FITTING
10.4.1 DRY
10.4.2 WET
10.5 PROFILES AND TUBES
10.5.1 DRY
10.5.2 WET
10.6 OTHERS
10.6.1 DRY
10.6.2 WET
11 ASIA PACIFIC PLASTICISED POLYVINYL CHLORIDE (PVC) COMPOUND MARKET, BY END USE
11.1 OVERVIEW
11.2 ELECTRICAL AND ELECTRONICS
11.2.1 DRY
11.2.2 WET
11.3 AUTOMOTIVE
11.3.1 DRY
11.3.2 WET
11.4 MEDICAL
11.4.1 DRY
11.4.2 WET
11.5 CONSUMER GOODS
11.5.1 DRY
11.5.2 WET
11.6 PACKAGING
11.6.1 DRY
11.6.2 WET
11.7 BUILDING AND CONSTRUCTION
11.7.1 DRY
11.7.2 WET
11.8 OTHERS
11.8.1 DRY
11.8.2 WET
12 ASIA PACIFIC PLASTICISED POLYVINYL CHLORIDE (PVC) COMPOUND MARKET, BY REGION
12.1 ASIA-PACIFIC
12.1.1 CHINA
12.1.2 INDIA
12.1.3 JAPAN
12.1.4 SOUTH KOREA
12.1.5 AUSTRALIA
12.1.6 SINGAPORE
12.1.7 INDONESIA
12.1.8 THAILAND
12.1.9 MALAYSIA
12.1.10 PHILIPPINES
12.1.11 REST OF ASIA-PACIFIC
13 ASIA PACIFIC PLASTICISED POLYVINYL CHLORIDE (PVC) COMPOUND MARKET, COMPANY LANDSCAPE
13.1 COMPANY SHARE ANALYSIS: ASIA PACIFIC
13.1.1 MERGERS & ACQUISITIONS
13.1.2 NEW PRODUCT DEVELOPMENTS
14 SWOT ANALYSIS
15 COMPANY PROFILES
15.1 INEOS
15.1.1 COMPANY SNAPSHOT
15.1.2 REVENUE ANALYSIS
15.1.3 COMPANY SHARE ANALYSIS
15.1.4 PRODUCT PORTFOLIO
15.1.5 RECENT DEVELOPMENT
15.2 WESTLAKE CHEMICAL CORPORATION
15.2.1 COMPANY SNAPSHOT
15.2.2 REVENUE ANALYSIS
15.2.3 COMPANY SHARE ANALYSIS
15.2.4 PRODUCT PORTFOLIO
15.2.5 RECENT DEVELOPMENT
15.3 FORMOSA PLASTICS CORPORATION
15.3.1 COMPANY SNAPSHOT
15.3.2 COMPANY SHARE ANALYSIS
15.3.3 PRODUCT PORTFOLIO
15.3.4 RECENT DEVELOPMENT
15.4 AURORA PLASTICS LLC
15.4.1 COMPANY SNAPSHOT
15.4.2 PRODUCT PORTFOLIO
15.4.3 RECENT DEVELOPMENTS
15.5 BENVIC
15.5.1 COMPANY SNAPSHOT
15.5.2 PRODUCT PORTFOLIO
15.5.3 RECENT DEVELOPMENTS
15.6 ERCROS S.A.
15.6.1 COMPANY SNAPSHOT
15.6.2 REVENUE ANALYSIS
15.6.3 PRODUCT PORTFOLIO
15.6.4 RECENT DEVELOPMENT
15.7 PKN ORLEN
15.7.1 COMPANY SNAPSHOT
15.7.2 REVENUE ANALYSIS
15.7.3 COMPANY SHARE ANALYSIS
15.7.4 PRODUCT PORTFOLIO
15.7.5 RECENT DEVELOPMENT
15.8 RAINMAKER POLYMERS LLC
15.8.1 COMPANY SNAPSHOT
15.8.2 PRODUCT PORTFOLIO
15.8.3 RECENT DEVELOPMENT
15.9 ROSCOM INC.
15.9.1 COMPANY SNAPSHOT
15.9.2 PRODUCT PORTFOLIO
15.9.3 RECENT DEVELOPMENT
15.1 TEKNOR APEX
15.10.1 COMPANY SNAPSHOT
15.10.2 COMPANY SHARE ANALYSIS
15.10.3 PRODUCT PORTFOLIO
15.10.4 RECENT DEVELOPMENTS
15.11 ZHONGLIAN CHEMICAL
15.11.1 COMPANY SNAPSHOT
15.11.2 PRODUCT PORTFOLIO
15.11.3 RECENT DEVELOPMENT
16 QUESTIONNAIRE
17 RELATED REPORTS
List of Table
TABLE 1 IMPORT DATA OF PLASTICISED POLY""VINYL CHLORIDE"", IN PRIMARY FORMS, MIXED WITH OTHER SUBSTANCE; HS CODE - 390422 (USD MILLION)
TABLE 2 EXPORT DATA OF PLASTICISED POLY""VINYL CHLORIDE"", IN PRIMARY FORMS, MIXED WITH OTHER SUBSTANCE; HS CODE – 390422 (USD MILLION)
TABLE 3 ASIA PACIFIC PLASTICISED POLYVINYL CHLORIDE (PVC) COMPOUND MARKET, BY FORM, 2020-2029 (USD MILLION)
TABLE 4 ASIA PACIFIC PLASTICISED POLYVINYL CHLORIDE (PVC) COMPOUND MARKET, BY FORM, 2020-2029 (KILO TONS)
TABLE 5 ASIA PACIFIC DRY IN PLASTICISED POLYVINYL CHLORIDE (PVC) COMPOUND MARKET, BY REGION, 2020-2029 (USD MILLION)
TABLE 6 ASIA PACIFIC DRY IN PLASTICISED POLYVINYL CHLORIDE (PVC) COMPOUND MARKET, BY REGION, 2020-2029 (KILO TONS)
TABLE 7 ASIA PACIFIC WET IN PLASTICISED POLYVINYL CHLORIDE (PVC) COMPOUND MARKET, BY REGION, 2020-2029 (USD MILLION)
TABLE 8 ASIA PACIFIC WET IN PLASTICISED POLYVINYL CHLORIDE (PVC) COMPOUND MARKET, BY REGION, 2020-2029 (KILO TONS)
TABLE 9 ASIA PACIFIC PLASTICISED POLYVINYL CHLORIDE (PVC) COMPOUND MARKET, BY MANUFACTURING PROCESS, 2020-2029 (USD MILLION)
TABLE 10 ASIA PACIFIC PLASTICISED POLYVINYL CHLORIDE (PVC) COMPOUND MARKET, BY MANUFACTURING PROCESS, 2020-2029 (KILO TONS)
TABLE 11 ASIA PACIFIC INJECTION MOLDING IN PLASTICISED POLYVINYL CHLORIDE (PVC) COMPOUND MARKET, BY REGION, 2020-2029 (USD MILLION)
TABLE 12 ASIA PACIFIC INJECTION MOLDING IN PLASTICISED POLYVINYL CHLORIDE (PVC) COMPOUND MARKET, BY REGION, 2020-2029 (KILO TONS)
TABLE 13 ASIA PACIFIC EXTRUSION IN PLASTICISED POLYVINYL CHLORIDE (PVC) COMPOUND MARKET, BY REGION, 2020-2029 (USD MILLION)
TABLE 14 ASIA PACIFIC EXTRUSION IN PLASTICISED POLYVINYL CHLORIDE (PVC) COMPOUND MARKET, BY REGION, 2020-2029 (KILO TONS)
TABLE 15 ASIA PACIFIC OTHERS IN PLASTICISED POLYVINYL CHLORIDE (PVC) COMPOUND MARKET, BY REGION, 2020-2029 (USD MILLION)
TABLE 16 ASIA PACIFIC OTHERS IN PLASTICISED POLYVINYL CHLORIDE (PVC) COMPOUND MARKET, BY REGION, 2020-2029 (KILO TONS)
TABLE 17 ASIA PACIFIC PLASTICISED POLYVINYL CHLORIDE (PVC) COMPOUND MARKET, BY APPLICATION, 2020-2029 (USD MILLION)
TABLE 18 ASIA PACIFIC PLASTICISED POLYVINYL CHLORIDE (PVC) COMPOUND MARKET, BY APPLICATION, 2020-2029 (KILO TONS)
TABLE 19 ASIA PACIFIC FILM AND SHEET IN PLASTICISED POLYVINYL CHLORIDE (PVC) COMPOUND MARKET, BY REGION, 2020-2029 (USD MILLION)
TABLE 20 ASIA PACIFIC FILM AND SHEET IN PLASTICISED POLYVINYL CHLORIDE (PVC) COMPOUND MARKET, BY REGION, 2020-2029 (KILO TONS)
TABLE 21 ASIA PACIFIC FILM AND SHEET IN PLASTICISED POLYVINYL CHLORIDE (PVC) COMPOUND MARKET, BY FORM, 2020-2029 (USD MILLION)
TABLE 22 ASIA PACIFIC FILM AND SHEET IN PLASTICISED POLYVINYL CHLORIDE (PVC) COMPOUND MARKET, BY FORM, 2020-2029 (KILO TONS)
TABLE 23 ASIA PACIFIC WIRE AND CABLING IN PLASTICISED POLYVINYL CHLORIDE (PVC) COMPOUND MARKET, BY REGION, 2020-2029 (USD MILLION)
TABLE 24 ASIA PACIFIC WIRE AND CABLING IN PLASTICISED POLYVINYL CHLORIDE (PVC) COMPOUND MARKET, BY REGION, 2020-2029 (KILO TONS)
TABLE 25 ASIA PACIFIC WIRE AND CABLING IN PLASTICISED POLYVINYL CHLORIDE (PVC) COMPOUND MARKET, BY FORM, 2020-2029 (USD MILLION)
TABLE 26 ASIA PACIFIC WIRE AND CABLING IN PLASTICISED POLYVINYL CHLORIDE (PVC) COMPOUND MARKET, BY FORM, 2020-2029 (KILO TONS)
TABLE 27 ASIA PACIFIC PIPE AND FITTING IN PLASTICISED POLYVINYL CHLORIDE (PVC) COMPOUND MARKET, BY REGION, 2020-2029 (USD MILLION)
TABLE 28 ASIA PACIFIC PIPE AND FITTING IN PLASTICISED POLYVINYL CHLORIDE (PVC) COMPOUND MARKET, BY REGION, 2020-2029 (KILO TONS)
TABLE 29 ASIA PACIFIC PIPE AND FITTING IN PLASTICISED POLYVINYL CHLORIDE (PVC) COMPOUND MARKET, BY FORM, 2020-2029 (USD MILLION)
TABLE 30 ASIA PACIFIC PIPE AND FITTING IN PLASTICISED POLYVINYL CHLORIDE (PVC) COMPOUND MARKET, BY FORM, 2020-2029 (KILO TONS)
TABLE 31 ASIA PACIFIC PROFILES AND TUBES IN PLASTICISED POLYVINYL CHLORIDE (PVC) COMPOUND MARKET, BY REGION, 2020-2029 (USD MILLION)
TABLE 32 ASIA PACIFIC PROFILES AND TUBES IN PLASTICISED POLYVINYL CHLORIDE (PVC) COMPOUND MARKET, BY REGION, 2020-2029 (KILO TONS)
TABLE 33 ASIA PACIFIC PROFILES AND TUBES IN PLASTICISED POLYVINYL CHLORIDE (PVC) COMPOUND MARKET, BY FORM, 2020-2029 (USD MILLION)
TABLE 34 ASIA PACIFIC PROFILES AND TUBES IN PLASTICISED POLYVINYL CHLORIDE (PVC) COMPOUND MARKET, BY FORM, 2020-2029 (KILO TONS)
TABLE 35 ASIA PACIFIC OTHERS IN PLASTICISED POLYVINYL CHLORIDE (PVC) COMPOUND MARKET, BY REGION, 2020-2029 (USD MILLION)
TABLE 36 ASIA PACIFIC OTHERS IN PLASTICISED POLYVINYL CHLORIDE (PVC) COMPOUND MARKET, BY REGION, 2020-2029 (KILO TONS)
TABLE 37 ASIA PACIFIC OTHERS IN PLASTICISED POLYVINYL CHLORIDE (PVC) COMPOUND MARKET, BY FORM, 2020-2029 (USD MILLION)
TABLE 38 ASIA PACIFIC OTHERS IN PLASTICISED POLYVINYL CHLORIDE (PVC) COMPOUND MARKET, BY FORM, 2020-2029 (KILO TONS)
TABLE 39 ASIA PACIFIC PLASTICISED POLYVINYL CHLORIDE (PVC) COMPOUND MARKET, BY END USE, 2020-2029 (USD MILLION)
TABLE 40 ASIA PACIFIC PLASTICISED POLYVINYL CHLORIDE (PVC) COMPOUND MARKET, BY END USE, 2020-2029 (KILO TONS)
TABLE 41 ASIA PACIFIC ELECTRICAL AND ELECTRONICS IN PLASTICISED POLYVINYL CHLORIDE (PVC) COMPOUND MARKET, BY REGION, 2020-2029 (USD MILLION)
TABLE 42 ASIA PACIFIC ELECTRICAL AND ELECTRONICS IN PLASTICISED POLYVINYL CHLORIDE (PVC) COMPOUND MARKET, BY REGION, 2020-2029 (KILO TONS)
TABLE 43 ASIA PACIFIC ELECTRICAL AND ELECTRONICS IN PLASTICISED POLYVINYL CHLORIDE (PVC) COMPOUND MARKET, BY FORM, 2020-2029 (USD MILLION)
TABLE 44 ASIA PACIFIC ELECTRICAL AND ELECTRONICS IN PLASTICISED POLYVINYL CHLORIDE (PVC) COMPOUND MARKET, BY FORM, 2020-2029 (KILO TONS)
TABLE 45 ASIA PACIFIC AUTOMOTIVE IN PLASTICISED POLYVINYL CHLORIDE (PVC) COMPOUND MARKET, BY REGION, 2020-2029 (USD MILLION)
TABLE 46 ASIA PACIFIC AUTOMOTIVE IN PLASTICISED POLYVINYL CHLORIDE (PVC) COMPOUND MARKET, BY REGION, 2020-2029 (KILO TONS)
TABLE 47 ASIA PACIFIC AUTOMOTIVE IN PLASTICISED POLYVINYL CHLORIDE (PVC) COMPOUND MARKET, BY FORM, 2020-2029 (USD MILLION)
TABLE 48 ASIA PACIFIC AUTOMOTIVE IN PLASTICISED POLYVINYL CHLORIDE (PVC) COMPOUND MARKET, BY FORM, 2020-2029 (KILO TONS)
TABLE 49 ASIA PACIFIC MEDICAL IN PLASTICISED POLYVINYL CHLORIDE (PVC) COMPOUND MARKET, BY REGION, 2020-2029 (USD MILLION)
TABLE 50 ASIA PACIFIC MEDICAL IN PLASTICISED POLYVINYL CHLORIDE (PVC) COMPOUND MARKET, BY REGION, 2020-2029 (KILO TONS)
TABLE 51 ASIA PACIFIC MEDICAL IN PLASTICISED POLYVINYL CHLORIDE (PVC) COMPOUND MARKET, BY FORM, 2020-2029 (USD MILLION)
TABLE 52 ASIA PACIFIC MEDICAL IN PLASTICISED POLYVINYL CHLORIDE (PVC) COMPOUND MARKET, BY FORM, 2020-2029 (KILO TONS)
TABLE 53 ASIA PACIFIC CONSUMER GOODS IN PLASTICISED POLYVINYL CHLORIDE (PVC) COMPOUND MARKET, BY REGION, 2020-2029 (USD MILLION)
TABLE 54 ASIA PACIFIC CONSUMER GOODS IN PLASTICISED POLYVINYL CHLORIDE (PVC) COMPOUND MARKET, BY REGION, 2020-2029 (KILO TONS)
TABLE 55 ASIA PACIFIC CONSUMER GOODS IN PLASTICISED POLYVINYL CHLORIDE (PVC) COMPOUND MARKET, BY FORM, 2020-2029 (USD MILLION)
TABLE 56 ASIA PACIFIC CONSUMER GOODS IN PLASTICISED POLYVINYL CHLORIDE (PVC) COMPOUND MARKET, BY FORM, 2020-2029 (KILO TONS)
TABLE 57 ASIA PACIFIC PACKAGING IN PLASTICISED POLYVINYL CHLORIDE (PVC) COMPOUND MARKET, BY REGION, 2020-2029 (USD MILLION)
TABLE 58 ASIA PACIFIC PACKAGING IN PLASTICISED POLYVINYL CHLORIDE (PVC) COMPOUND MARKET, BY REGION, 2020-2029 (KILO TONS)
TABLE 59 ASIA PACIFIC PACKAGING IN PLASTICISED POLYVINYL CHLORIDE (PVC) COMPOUND MARKET, BY FORM, 2020-2029 (USD MILLION)
TABLE 60 ASIA PACIFIC PACKAGING IN PLASTICISED POLYVINYL CHLORIDE (PVC) COMPOUND MARKET, BY FORM, 2020-2029 (KILO TONS)
TABLE 61 ASIA PACIFIC BUILDING AND CONSTRUCTION IN PLASTICISED POLYVINYL CHLORIDE (PVC) COMPOUND MARKET, BY REGION, 2020-2029 (USD MILLION)
TABLE 62 ASIA PACIFIC BUILDING AND CONSTRUCTION IN PLASTICISED POLYVINYL CHLORIDE (PVC) COMPOUND MARKET, BY REGION, 2020-2029 (KILO TONS)
TABLE 63 ASIA PACIFIC BUILDING AND CONSTRUCTION IN PLASTICISED POLYVINYL CHLORIDE (PVC) COMPOUND MARKET, BY FORM, 2020-2029 (USD MILLION)
TABLE 64 ASIA PACIFIC BUILDING AND CONSTRUCTION IN PLASTICISED POLYVINYL CHLORIDE (PVC) COMPOUND MARKET, BY FORM, 2020-2029 (KILO TONS)
TABLE 65 ASIA PACIFIC OTHERS IN PLASTICISED POLYVINYL CHLORIDE (PVC) COMPOUND MARKET, BY REGION, 2020-2029 (USD MILLION)
TABLE 66 ASIA PACIFIC OTHERS IN PLASTICISED POLYVINYL CHLORIDE (PVC) COMPOUND MARKET, BY REGION, 2020-2029 (KILO TONS)
TABLE 67 ASIA PACIFIC OTHERS IN PLASTICISED POLYVINYL CHLORIDE (PVC) COMPOUND MARKET, BY FORM, 2020-2029 (USD MILLION)
TABLE 68 ASIA PACIFIC OTHERS IN PLASTICISED POLYVINYL CHLORIDE (PVC) COMPOUND MARKET, BY FORM, 2020-2029 (KILO TONS)
TABLE 69 ASIA-PACIFIC PLASTICISED POLYVINYL CHLORIDE (PVC) COMPOUND MARKET, BY COUNTRY, 2020-2029 (USD MILLION)
TABLE 70 ASIA-PACIFIC PLASTICISED POLYVINYL CHLORIDE (PVC) COMPOUND MARKET, BY COUNTRY, 2020-2029 (KILO TONS)
TABLE 71 ASIA-PACIFIC PLASTICISED POLYVINYL CHLORIDE (PVC) COMPOUND MARKET, BY FORM, 2020-2029 (USD MILLION)
TABLE 72 ASIA-PACIFIC PLASTICISED POLYVINYL CHLORIDE (PVC) COMPOUND MARKET, BY FORM, 2020-2029 (KILO TONS)
TABLE 73 ASIA-PACIFIC PLASTICISED POLYVINYL CHLORIDE (PVC) COMPOUND MARKET, BY MANUFACTURING PROCESS, 2020-2029 (USD MILLION)
TABLE 74 ASIA-PACIFIC PLASTICISED POLYVINYL CHLORIDE (PVC) COMPOUND MARKET, BY MANUFACTURING PROCESS, 2020-2029 (KILO TONS)
TABLE 75 ASIA-PACIFIC PLASTICISED POLYVINYL CHLORIDE (PVC) COMPOUND MARKET, BY APPLICATION, 2020-2029 (USD MILLION)
TABLE 76 ASIA-PACIFIC PLASTICISED POLYVINYL CHLORIDE (PVC) COMPOUND MARKET, BY APPLICATION, 2020-2029 (KILO TONS)
TABLE 77 ASIA-PACIFIC FILM AND SHEET IN PLASTICISED POLYVINYL CHLORIDE (PVC) COMPOUND MARKET, BY FORM, 2020-2029 (USD MILLION)
TABLE 78 ASIA-PACIFIC FILM AND SHEET IN PLASTICISED POLYVINYL CHLORIDE (PVC) COMPOUND MARKET, BY FORM, 2020-2029 (KILO TONS)
TABLE 79 ASIA-PACIFIC WIRE AND CABLING IN PLASTICISED POLYVINYL CHLORIDE (PVC) COMPOUND MARKET, BY FORM, 2020-2029 (USD MILLION)
TABLE 80 ASIA-PACIFIC WIRE AND CABLING IN PLASTICISED POLYVINYL CHLORIDE (PVC) COMPOUND MARKET, BY FORM, 2020-2029 (KILO TONS)
TABLE 81 ASIA-PACIFIC PIPE AND FITTING IN PLASTICISED POLYVINYL CHLORIDE (PVC) COMPOUND MARKET, BY FORM, 2020-2029 (USD MILLION)
TABLE 82 ASIA-PACIFIC PIPE AND FITTING IN PLASTICISED POLYVINYL CHLORIDE (PVC) COMPOUND MARKET, BY FORM, 2020-2029 (KILO TONS)
TABLE 83 ASIA-PACIFIC PROFILES AND TUBES IN PLASTICISED POLYVINYL CHLORIDE (PVC) COMPOUND MARKET, BY FORM, 2020-2029 (USD MILLION)
TABLE 84 ASIA-PACIFIC PROFILES AND TUBES IN PLASTICISED POLYVINYL CHLORIDE (PVC) COMPOUND MARKET, BY FORM, 2020-2029 (KILO TONS)
TABLE 85 ASIA-PACIFIC OTHERS IN PLASTICISED POLYVINYL CHLORIDE (PVC) COMPOUND MARKET, BY FORM, 2020-2029 (USD MILLION)
TABLE 86 ASIA-PACIFIC OTHERS IN PLASTICISED POLYVINYL CHLORIDE (PVC) COMPOUND MARKET, BY FORM, 2020-2029 (KILO TONS)
TABLE 87 ASIA-PACIFIC PLASTICISED POLYVINYL CHLORIDE (PVC) COMPOUND MARKET, BY END USE, 2020-2029 (USD MILLION)
TABLE 88 ASIA-PACIFIC PLASTICISED POLYVINYL CHLORIDE (PVC) COMPOUND MARKET, BY END USE, 2020-2029 (KILO TONS)
TABLE 89 ASIA-PACIFIC ELECTRICAL AND ELECTRONIC IN PLASTICISED POLYVINYL CHLORIDE (PVC) COMPOUND MARKET, BY FORM, 2020-2029 (USD MILLION)
TABLE 90 ASIA-PACIFIC ELECTRICAL AND ELECTRONIC IN PLASTICISED POLYVINYL CHLORIDE (PVC) COMPOUND MARKET, BY FORM, 2020-2029 (KILO TONS)
TABLE 91 ASIA-PACIFIC AUTOMOTIVE IN PLASTICISED POLYVINYL CHLORIDE (PVC) COMPOUND MARKET, BY FORM, 2020-2029 (USD MILLION)
TABLE 92 ASIA-PACIFIC AUTOMOTIVE IN PLASTICISED POLYVINYL CHLORIDE (PVC) COMPOUND MARKET, BY FORM, 2020-2029 (KILO TONS)
TABLE 93 ASIA-PACIFIC MEDICAL IN PLASTICISED POLYVINYL CHLORIDE (PVC) COMPOUND MARKET, BY FORM, 2020-2029 (USD MILLION)
TABLE 94 ASIA-PACIFIC MEDICAL IN PLASTICISED POLYVINYL CHLORIDE (PVC) COMPOUND MARKET, BY FORM, 2020-2029 (KILO TONS)
TABLE 95 ASIA-PACIFIC CONSUMER GOODS IN PLASTICISED POLYVINYL CHLORIDE (PVC) COMPOUND MARKET, BY FORM, 2020-2029 (USD MILLION)
TABLE 96 ASIA-PACIFIC CONSUMER GOODS IN PLASTICISED POLYVINYL CHLORIDE (PVC) COMPOUND MARKET, BY FORM, 2020-2029 (KILO TONS)
TABLE 97 ASIA-PACIFIC PACKAGING IN PLASTICISED POLYVINYL CHLORIDE (PVC) COMPOUND MARKET, BY FORM, 2020-2029 (USD MILLION)
TABLE 98 ASIA-PACIFIC PACKAGING IN PLASTICISED POLYVINYL CHLORIDE (PVC) COMPOUND MARKET, BY FORM, 2020-2029 (KILO TONS)
TABLE 99 ASIA-PACIFIC BUILDING AND CONSTRUCTION IN PLASTICISED POLYVINYL CHLORIDE (PVC) COMPOUND MARKET, BY FORM, 2020-2029 (USD MILLION)
TABLE 100 ASIA-PACIFIC BUILDING AND CONSTRUCTION IN PLASTICISED POLYVINYL CHLORIDE (PVC) COMPOUND MARKET, BY FORM, 2020-2029 (KILO TONS)
TABLE 101 ASIA-PACIFIC OTHERS IN PLASTICISED POLYVINYL CHLORIDE (PVC) COMPOUND MARKET, BY FORM, 2020-2029 (USD MILLION)
TABLE 102 ASIA-PACIFIC OTHERS IN PLASTICISED POLYVINYL CHLORIDE (PVC) COMPOUND MARKET, BY FORM, 2020-2029 (KILO TONS)
TABLE 103 CHINA PLASTICISED POLYVINYL CHLORIDE (PVC) COMPOUND MARKET, BY FORM, 2020-2029 (USD MILLION)
TABLE 104 CHINA PLASTICISED POLYVINYL CHLORIDE (PVC) COMPOUND MARKET, BY FORM, 2020-2029 (KILO TONS)
TABLE 105 CHINA PLASTICISED POLYVINYL CHLORIDE (PVC) COMPOUND MARKET, BY MANUFACTURING PROCESS, 2020-2029 (USD MILLION)
TABLE 106 CHINA PLASTICISED POLYVINYL CHLORIDE (PVC) COMPOUND MARKET, BY MANUFACTURING PROCESS, 2020-2029 (KILO TONS)
TABLE 107 CHINA PLASTICISED POLYVINYL CHLORIDE (PVC) COMPOUND MARKET, BY APPLICATION, 2020-2029 (USD MILLION)
TABLE 108 CHINA PLASTICISED POLYVINYL CHLORIDE (PVC) COMPOUND MARKET, BY APPLICATION, 2020-2029 (KILO TONS)
TABLE 109 CHINA FILM AND SHEET IN PLASTICISED POLYVINYL CHLORIDE (PVC) COMPOUND MARKET, BY FORM, 2020-2029 (USD MILLION)
TABLE 110 CHINA FILM AND SHEET IN PLASTICISED POLYVINYL CHLORIDE (PVC) COMPOUND MARKET, BY FORM, 2020-2029 (KILO TONS)
TABLE 111 CHINA WIRE AND CABLING IN PLASTICISED POLYVINYL CHLORIDE (PVC) COMPOUND MARKET, BY FORM, 2020-2029 (USD MILLION)
TABLE 112 CHINA WIRE AND CABLING IN PLASTICISED POLYVINYL CHLORIDE (PVC) COMPOUND MARKET, BY FORM, 2020-2029 (KILO TONS)
TABLE 113 CHINA PIPE AND FITTING IN PLASTICISED POLYVINYL CHLORIDE (PVC) COMPOUND MARKET, BY FORM, 2020-2029 (USD MILLION)
TABLE 114 CHINA PIPE AND FITTING IN PLASTICISED POLYVINYL CHLORIDE (PVC) COMPOUND MARKET, BY FORM, 2020-2029 (KILO TONS)
TABLE 115 CHINA PROFILES AND TUBES IN PLASTICISED POLYVINYL CHLORIDE (PVC) COMPOUND MARKET, BY FORM, 2020-2029 (USD MILLION)
TABLE 116 CHINA PROFILES AND TUBES IN PLASTICISED POLYVINYL CHLORIDE (PVC) COMPOUND MARKET, BY FORM, 2020-2029 (KILO TONS)
TABLE 117 CHINA OTHERS IN PLASTICISED POLYVINYL CHLORIDE (PVC) COMPOUND MARKET, BY FORM, 2020-2029 (USD MILLION)
TABLE 118 CHINA OTHERS IN PLASTICISED POLYVINYL CHLORIDE (PVC) COMPOUND MARKET, BY FORM, 2020-2029 (KILO TONS)
TABLE 119 CHINA PLASTICISED POLYVINYL CHLORIDE (PVC) COMPOUND MARKET, BY END USE, 2020-2029 (USD MILLION)
TABLE 120 CHINA PLASTICISED POLYVINYL CHLORIDE (PVC) COMPOUND MARKET, BY END USE, 2020-2029 (KILO TONS)
TABLE 121 CHINA ELECTRICAL AND ELECTRONIC IN PLASTICISED POLYVINYL CHLORIDE (PVC) COMPOUND MARKET, BY FORM, 2020-2029 (USD MILLION)
TABLE 122 CHINA ELECTRICAL AND ELECTRONIC IN PLASTICISED POLYVINYL CHLORIDE (PVC) COMPOUND MARKET, BY FORM, 2020-2029 (KILO TONS)
TABLE 123 CHINA AUTOMOTIVE IN PLASTICISED POLYVINYL CHLORIDE (PVC) COMPOUND MARKET, BY FORM, 2020-2029 (USD MILLION)
TABLE 124 CHINA AUTOMOTIVE IN PLASTICISED POLYVINYL CHLORIDE (PVC) COMPOUND MARKET, BY FORM, 2020-2029 (KILO TONS)
TABLE 125 CHINA MEDICAL IN PLASTICISED POLYVINYL CHLORIDE (PVC) COMPOUND MARKET, BY FORM, 2020-2029 (USD MILLION)
TABLE 126 CHINA MEDICAL IN PLASTICISED POLYVINYL CHLORIDE (PVC) COMPOUND MARKET, BY FORM, 2020-2029 (KILO TONS)
TABLE 127 CHINA CONSUMER GOODS IN PLASTICISED POLYVINYL CHLORIDE (PVC) COMPOUND MARKET, BY FORM, 2020-2029 (USD MILLION)
TABLE 128 CHINA CONSUMER GOODS IN PLASTICISED POLYVINYL CHLORIDE (PVC) COMPOUND MARKET, BY FORM, 2020-2029 (KILO TONS)
TABLE 129 CHINA PACKAGING IN PLASTICISED POLYVINYL CHLORIDE (PVC) COMPOUND MARKET, BY FORM, 2020-2029 (USD MILLION)
TABLE 130 CHINA PACKAGING IN PLASTICISED POLYVINYL CHLORIDE (PVC) COMPOUND MARKET, BY FORM, 2020-2029 (KILO TONS)
TABLE 131 CHINA BUILDING AND CONSTRUCTION IN PLASTICISED POLYVINYL CHLORIDE (PVC) COMPOUND MARKET, BY FORM, 2020-2029 (USD MILLION)
TABLE 132 CHINA BUILDING AND CONSTRUCTION IN PLASTICISED POLYVINYL CHLORIDE (PVC) COMPOUND MARKET, BY FORM, 2020-2029 (KILO TONS)
TABLE 133 CHINA OTHERS IN PLASTICISED POLYVINYL CHLORIDE (PVC) COMPOUND MARKET, BY FORM, 2020-2029 (USD MILLION)
TABLE 134 CHINA OTHERS IN PLASTICISED POLYVINYL CHLORIDE (PVC) COMPOUND MARKET, BY FORM, 2020-2029 (KILO TONS)
TABLE 135 INDIA PLASTICISED POLYVINYL CHLORIDE (PVC) COMPOUND MARKET, BY FORM, 2020-2029 (USD MILLION)
TABLE 136 INDIA PLASTICISED POLYVINYL CHLORIDE (PVC) COMPOUND MARKET, BY FORM, 2020-2029 (KILO TONS)
TABLE 137 INDIA PLASTICISED POLYVINYL CHLORIDE (PVC) COMPOUND MARKET, BY MANUFACTURING PROCESS, 2020-2029 (USD MILLION)
TABLE 138 INDIA PLASTICISED POLYVINYL CHLORIDE (PVC) COMPOUND MARKET, BY MANUFACTURING PROCESS, 2020-2029 (KILO TONS)
TABLE 139 INDIA PLASTICISED POLYVINYL CHLORIDE (PVC) COMPOUND MARKET, BY APPLICATION, 2020-2029 (USD MILLION)
TABLE 140 INDIA PLASTICISED POLYVINYL CHLORIDE (PVC) COMPOUND MARKET, BY APPLICATION, 2020-2029 (KILO TONS)
TABLE 141 INDIA FILM AND SHEET IN PLASTICISED POLYVINYL CHLORIDE (PVC) COMPOUND MARKET, BY FORM, 2020-2029 (USD MILLION)
TABLE 142 INDIA FILM AND SHEET IN PLASTICISED POLYVINYL CHLORIDE (PVC) COMPOUND MARKET, BY FORM, 2020-2029 (KILO TONS)
TABLE 143 INDIA WIRE AND CABLING IN PLASTICISED POLYVINYL CHLORIDE (PVC) COMPOUND MARKET, BY FORM, 2020-2029 (USD MILLION)
TABLE 144 INDIA WIRE AND CABLING IN PLASTICISED POLYVINYL CHLORIDE (PVC) COMPOUND MARKET, BY FORM, 2020-2029 (KILO TONS)
TABLE 145 INDIA PIPE AND FITTING IN PLASTICISED POLYVINYL CHLORIDE (PVC) COMPOUND MARKET, BY FORM, 2020-2029 (USD MILLION)
TABLE 146 INDIA PIPE AND FITTING IN PLASTICISED POLYVINYL CHLORIDE (PVC) COMPOUND MARKET, BY FORM, 2020-2029 (KILO TONS)
TABLE 147 INDIA PROFILES AND TUBES IN PLASTICISED POLYVINYL CHLORIDE (PVC) COMPOUND MARKET, BY FORM, 2020-2029 (USD MILLION)
TABLE 148 INDIA PROFILES AND TUBES IN PLASTICISED POLYVINYL CHLORIDE (PVC) COMPOUND MARKET, BY FORM, 2020-2029 (KILO TONS)
TABLE 149 INDIA OTHERS IN PLASTICISED POLYVINYL CHLORIDE (PVC) COMPOUND MARKET, BY FORM, 2020-2029 (USD MILLION)
TABLE 150 INDIA OTHERS IN PLASTICISED POLYVINYL CHLORIDE (PVC) COMPOUND MARKET, BY FORM, 2020-2029 (KILO TONS)
TABLE 151 INDIA PLASTICISED POLYVINYL CHLORIDE (PVC) COMPOUND MARKET, BY END USE, 2020-2029 (USD MILLION)
TABLE 152 INDIA PLASTICISED POLYVINYL CHLORIDE (PVC) COMPOUND MARKET, BY END USE, 2020-2029 (KILO TONS)
TABLE 153 INDIA ELECTRICAL AND ELECTRONIC IN PLASTICISED POLYVINYL CHLORIDE (PVC) COMPOUND MARKET, BY FORM, 2020-2029 (USD MILLION)
TABLE 154 INDIA ELECTRICAL AND ELECTRONIC IN PLASTICISED POLYVINYL CHLORIDE (PVC) COMPOUND MARKET, BY FORM, 2020-2029 (KILO TONS)
TABLE 155 INDIA AUTOMOTIVE IN PLASTICISED POLYVINYL CHLORIDE (PVC) COMPOUND MARKET, BY FORM, 2020-2029 (USD MILLION)
TABLE 156 INDIA AUTOMOTIVE IN PLASTICISED POLYVINYL CHLORIDE (PVC) COMPOUND MARKET, BY FORM, 2020-2029 (KILO TONS)
TABLE 157 INDIA MEDICAL IN PLASTICISED POLYVINYL CHLORIDE (PVC) COMPOUND MARKET, BY FORM, 2020-2029 (USD MILLION)
TABLE 158 INDIA MEDICAL IN PLASTICISED POLYVINYL CHLORIDE (PVC) COMPOUND MARKET, BY FORM, 2020-2029 (KILO TONS)
TABLE 159 INDIA CONSUMER GOODS IN PLASTICISED POLYVINYL CHLORIDE (PVC) COMPOUND MARKET, BY FORM, 2020-2029 (USD MILLION)
TABLE 160 INDIA CONSUMER GOODS IN PLASTICISED POLYVINYL CHLORIDE (PVC) COMPOUND MARKET, BY FORM, 2020-2029 (KILO TONS)
TABLE 161 INDIA PACKAGING IN PLASTICISED POLYVINYL CHLORIDE (PVC) COMPOUND MARKET, BY FORM, 2020-2029 (USD MILLION)
TABLE 162 INDIA PACKAGING IN PLASTICISED POLYVINYL CHLORIDE (PVC) COMPOUND MARKET, BY FORM, 2020-2029 (KILO TONS)
TABLE 163 INDIA BUILDING AND CONSTRUCTION IN PLASTICISED POLYVINYL CHLORIDE (PVC) COMPOUND MARKET, BY FORM, 2020-2029 (USD MILLION)
TABLE 164 INDIA BUILDING AND CONSTRUCTION IN PLASTICISED POLYVINYL CHLORIDE (PVC) COMPOUND MARKET, BY FORM, 2020-2029 (KILO TONS)
TABLE 165 INDIA OTHERS IN PLASTICISED POLYVINYL CHLORIDE (PVC) COMPOUND MARKET, BY FORM, 2020-2029 (USD MILLION)
TABLE 166 INDIA OTHERS IN PLASTICISED POLYVINYL CHLORIDE (PVC) COMPOUND MARKET, BY FORM, 2020-2029 (KILO TONS)
TABLE 167 JAPAN PLASTICISED POLYVINYL CHLORIDE (PVC) COMPOUND MARKET, BY FORM, 2020-2029 (USD MILLION)
TABLE 168 JAPAN PLASTICISED POLYVINYL CHLORIDE (PVC) COMPOUND MARKET, BY FORM, 2020-2029 (KILO TONS)
TABLE 169 JAPAN PLASTICISED POLYVINYL CHLORIDE (PVC) COMPOUND MARKET, BY MANUFACTURING PROCESS, 2020-2029 (USD MILLION)
TABLE 170 JAPAN PLASTICISED POLYVINYL CHLORIDE (PVC) COMPOUND MARKET, BY MANUFACTURING PROCESS, 2020-2029 (KILO TONS)
TABLE 171 JAPAN PLASTICISED POLYVINYL CHLORIDE (PVC) COMPOUND MARKET, BY APPLICATION, 2020-2029 (USD MILLION)
TABLE 172 JAPAN PLASTICISED POLYVINYL CHLORIDE (PVC) COMPOUND MARKET, BY APPLICATION, 2020-2029 (KILO TONS)
TABLE 173 JAPAN FILM AND SHEET IN PLASTICISED POLYVINYL CHLORIDE (PVC) COMPOUND MARKET, BY FORM, 2020-2029 (USD MILLION)
TABLE 174 JAPAN FILM AND SHEET IN PLASTICISED POLYVINYL CHLORIDE (PVC) COMPOUND MARKET, BY FORM, 2020-2029 (KILO TONS)
TABLE 175 JAPAN WIRE AND CABLING IN PLASTICISED POLYVINYL CHLORIDE (PVC) COMPOUND MARKET, BY FORM, 2020-2029 (USD MILLION)
TABLE 176 JAPAN WIRE AND CABLING IN PLASTICISED POLYVINYL CHLORIDE (PVC) COMPOUND MARKET, BY FORM, 2020-2029 (KILO TONS)
TABLE 177 JAPAN PIPE AND FITTING IN PLASTICISED POLYVINYL CHLORIDE (PVC) COMPOUND MARKET, BY FORM, 2020-2029 (USD MILLION)
TABLE 178 JAPAN PIPE AND FITTING IN PLASTICISED POLYVINYL CHLORIDE (PVC) COMPOUND MARKET, BY FORM, 2020-2029 (KILO TONS)
TABLE 179 JAPAN PROFILES AND TUBES IN PLASTICISED POLYVINYL CHLORIDE (PVC) COMPOUND MARKET, BY FORM, 2020-2029 (USD MILLION)
TABLE 180 JAPAN PROFILES AND TUBES IN PLASTICISED POLYVINYL CHLORIDE (PVC) COMPOUND MARKET, BY FORM, 2020-2029 (KILO TONS)
TABLE 181 JAPAN OTHERS IN PLASTICISED POLYVINYL CHLORIDE (PVC) COMPOUND MARKET, BY FORM, 2020-2029 (USD MILLION)
TABLE 182 JAPAN OTHERS IN PLASTICISED POLYVINYL CHLORIDE (PVC) COMPOUND MARKET, BY FORM, 2020-2029 (KILO TONS)
TABLE 183 JAPAN PLASTICISED POLYVINYL CHLORIDE (PVC) COMPOUND MARKET, BY END USE, 2020-2029 (USD MILLION)
TABLE 184 JAPAN PLASTICISED POLYVINYL CHLORIDE (PVC) COMPOUND MARKET, BY END USE, 2020-2029 (KILO TONS)
TABLE 185 JAPAN ELECTRICAL AND ELECTRONIC IN PLASTICISED POLYVINYL CHLORIDE (PVC) COMPOUND MARKET, BY FORM, 2020-2029 (USD MILLION)
TABLE 186 JAPAN ELECTRICAL AND ELECTRONIC IN PLASTICISED POLYVINYL CHLORIDE (PVC) COMPOUND MARKET, BY FORM, 2020-2029 (KILO TONS)
TABLE 187 JAPAN AUTOMOTIVE IN PLASTICISED POLYVINYL CHLORIDE (PVC) COMPOUND MARKET, BY FORM, 2020-2029 (USD MILLION)
TABLE 188 JAPAN AUTOMOTIVE IN PLASTICISED POLYVINYL CHLORIDE (PVC) COMPOUND MARKET, BY FORM, 2020-2029 (KILO TONS)
TABLE 189 JAPAN MEDICAL IN PLASTICISED POLYVINYL CHLORIDE (PVC) COMPOUND MARKET, BY FORM, 2020-2029 (USD MILLION)
TABLE 190 JAPAN MEDICAL IN PLASTICISED POLYVINYL CHLORIDE (PVC) COMPOUND MARKET, BY FORM, 2020-2029 (KILO TONS)
TABLE 191 JAPAN CONSUMER GOODS IN PLASTICISED POLYVINYL CHLORIDE (PVC) COMPOUND MARKET, BY FORM, 2020-2029 (USD MILLION)
TABLE 192 JAPAN CONSUMER GOODS IN PLASTICISED POLYVINYL CHLORIDE (PVC) COMPOUND MARKET, BY FORM, 2020-2029 (KILO TONS)
TABLE 193 JAPAN PACKAGING IN PLASTICISED POLYVINYL CHLORIDE (PVC) COMPOUND MARKET, BY FORM, 2020-2029 (USD MILLION)
TABLE 194 JAPAN PACKAGING IN PLASTICISED POLYVINYL CHLORIDE (PVC) COMPOUND MARKET, BY FORM, 2020-2029 (KILO TONS)
TABLE 195 JAPAN BUILDING AND CONSTRUCTION IN PLASTICISED POLYVINYL CHLORIDE (PVC) COMPOUND MARKET, BY FORM, 2020-2029 (USD MILLION)
TABLE 196 JAPAN BUILDING AND CONSTRUCTION IN PLASTICISED POLYVINYL CHLORIDE (PVC) COMPOUND MARKET, BY FORM, 2020-2029 (KILO TONS)
TABLE 197 JAPAN OTHERS IN PLASTICISED POLYVINYL CHLORIDE (PVC) COMPOUND MARKET, BY FORM, 2020-2029 (USD MILLION)
TABLE 198 JAPAN OTHERS IN PLASTICISED POLYVINYL CHLORIDE (PVC) COMPOUND MARKET, BY FORM, 2020-2029 (KILO TONS)
TABLE 199 SOUTH KOREA PLASTICISED POLYVINYL CHLORIDE (PVC) COMPOUND MARKET, BY FORM, 2020-2029 (USD MILLION)
TABLE 200 SOUTH KOREA PLASTICISED POLYVINYL CHLORIDE (PVC) COMPOUND MARKET, BY FORM, 2020-2029 (KILO TONS)
TABLE 201 SOUTH KOREA PLASTICISED POLYVINYL CHLORIDE (PVC) COMPOUND MARKET, BY MANUFACTURING PROCESS, 2020-2029 (USD MILLION)
TABLE 202 SOUTH KOREA PLASTICISED POLYVINYL CHLORIDE (PVC) COMPOUND MARKET, BY MANUFACTURING PROCESS, 2020-2029 (KILO TONS)
TABLE 203 SOUTH KOREA PLASTICISED POLYVINYL CHLORIDE (PVC) COMPOUND MARKET, BY APPLICATION, 2020-2029 (USD MILLION)
TABLE 204 SOUTH KOREA PLASTICISED POLYVINYL CHLORIDE (PVC) COMPOUND MARKET, BY APPLICATION, 2020-2029 (KILO TONS)
TABLE 205 SOUTH KOREA FILM AND SHEET IN PLASTICISED POLYVINYL CHLORIDE (PVC) COMPOUND MARKET, BY FORM, 2020-2029 (USD MILLION)
TABLE 206 SOUTH KOREA FILM AND SHEET IN PLASTICISED POLYVINYL CHLORIDE (PVC) COMPOUND MARKET, BY FORM, 2020-2029 (KILO TONS)
TABLE 207 SOUTH KOREA WIRE AND CABLING IN PLASTICISED POLYVINYL CHLORIDE (PVC) COMPOUND MARKET, BY FORM, 2020-2029 (USD MILLION)
TABLE 208 SOUTH KOREA WIRE AND CABLING IN PLASTICISED POLYVINYL CHLORIDE (PVC) COMPOUND MARKET, BY FORM, 2020-2029 (KILO TONS)
TABLE 209 SOUTH KOREA PIPE AND FITTING IN PLASTICISED POLYVINYL CHLORIDE (PVC) COMPOUND MARKET, BY FORM, 2020-2029 (USD MILLION)
TABLE 210 SOUTH KOREA PIPE AND FITTING IN PLASTICISED POLYVINYL CHLORIDE (PVC) COMPOUND MARKET, BY FORM, 2020-2029 (KILO TONS)
TABLE 211 SOUTH KOREA PROFILES AND TUBES IN PLASTICISED POLYVINYL CHLORIDE (PVC) COMPOUND MARKET, BY FORM, 2020-2029 (USD MILLION)
TABLE 212 SOUTH KOREA PROFILES AND TUBES IN PLASTICISED POLYVINYL CHLORIDE (PVC) COMPOUND MARKET, BY FORM, 2020-2029 (KILO TONS)
TABLE 213 SOUTH KOREA OTHERS IN PLASTICISED POLYVINYL CHLORIDE (PVC) COMPOUND MARKET, BY FORM, 2020-2029 (USD MILLION)
TABLE 214 SOUTH KOREA OTHERS IN PLASTICISED POLYVINYL CHLORIDE (PVC) COMPOUND MARKET, BY FORM, 2020-2029 (KILO TONS)
TABLE 215 SOUTH KOREA PLASTICISED POLYVINYL CHLORIDE (PVC) COMPOUND MARKET, BY END USE, 2020-2029 (USD MILLION)
TABLE 216 SOUTH KOREA PLASTICISED POLYVINYL CHLORIDE (PVC) COMPOUND MARKET, BY END USE, 2020-2029 (KILO TONS)
TABLE 217 SOUTH KOREA ELECTRICAL AND ELECTRONIC IN PLASTICISED POLYVINYL CHLORIDE (PVC) COMPOUND MARKET, BY FORM, 2020-2029 (USD MILLION)
TABLE 218 SOUTH KOREA ELECTRICAL AND ELECTRONIC IN PLASTICISED POLYVINYL CHLORIDE (PVC) COMPOUND MARKET, BY FORM, 2020-2029 (KILO TONS)
TABLE 219 SOUTH KOREA AUTOMOTIVE IN PLASTICISED POLYVINYL CHLORIDE (PVC) COMPOUND MARKET, BY FORM, 2020-2029 (USD MILLION)
TABLE 220 SOUTH KOREA AUTOMOTIVE IN PLASTICISED POLYVINYL CHLORIDE (PVC) COMPOUND MARKET, BY FORM, 2020-2029 (KILO TONS)
TABLE 221 SOUTH KOREA MEDICAL IN PLASTICISED POLYVINYL CHLORIDE (PVC) COMPOUND MARKET, BY FORM, 2020-2029 (USD MILLION)
TABLE 222 SOUTH KOREA MEDICAL IN PLASTICISED POLYVINYL CHLORIDE (PVC) COMPOUND MARKET, BY FORM, 2020-2029 (KILO TONS)
TABLE 223 SOUTH KOREA CONSUMER GOODS IN PLASTICISED POLYVINYL CHLORIDE (PVC) COMPOUND MARKET, BY FORM, 2020-2029 (USD MILLION)
TABLE 224 SOUTH KOREA CONSUMER GOODS IN PLASTICISED POLYVINYL CHLORIDE (PVC) COMPOUND MARKET, BY FORM, 2020-2029 (KILO TONS)
TABLE 225 SOUTH KOREA PACKAGING IN PLASTICISED POLYVINYL CHLORIDE (PVC) COMPOUND MARKET, BY FORM, 2020-2029 (USD MILLION)
TABLE 226 SOUTH KOREA PACKAGING IN PLASTICISED POLYVINYL CHLORIDE (PVC) COMPOUND MARKET, BY FORM, 2020-2029 (KILO TONS)
TABLE 227 SOUTH KOREA BUILDING AND CONSTRUCTION IN PLASTICISED POLYVINYL CHLORIDE (PVC) COMPOUND MARKET, BY FORM, 2020-2029 (USD MILLION)
TABLE 228 SOUTH KOREA BUILDING AND CONSTRUCTION IN PLASTICISED POLYVINYL CHLORIDE (PVC) COMPOUND MARKET, BY FORM, 2020-2029 (KILO TONS)
TABLE 229 SOUTH KOREA OTHERS IN PLASTICISED POLYVINYL CHLORIDE (PVC) COMPOUND MARKET, BY FORM, 2020-2029 (USD MILLION)
TABLE 230 SOUTH KOREA OTHERS IN PLASTICISED POLYVINYL CHLORIDE (PVC) COMPOUND MARKET, BY FORM, 2020-2029 (KILO TONS)
TABLE 231 AUSTRALIA PLASTICISED POLYVINYL CHLORIDE (PVC) COMPOUND MARKET, BY FORM, 2020-2029 (USD MILLION)
TABLE 232 AUSTRALIA PLASTICISED POLYVINYL CHLORIDE (PVC) COMPOUND MARKET, BY FORM, 2020-2029 (KILO TONS)
TABLE 233 AUSTRALIA PLASTICISED POLYVINYL CHLORIDE (PVC) COMPOUND MARKET, BY MANUFACTURING PROCESS, 2020-2029 (USD MILLION)
TABLE 234 AUSTRALIA PLASTICISED POLYVINYL CHLORIDE (PVC) COMPOUND MARKET, BY MANUFACTURING PROCESS, 2020-2029 (KILO TONS)
TABLE 235 AUSTRALIA PLASTICISED POLYVINYL CHLORIDE (PVC) COMPOUND MARKET, BY APPLICATION, 2020-2029 (USD MILLION)
TABLE 236 AUSTRALIA PLASTICISED POLYVINYL CHLORIDE (PVC) COMPOUND MARKET, BY APPLICATION, 2020-2029 (KILO TONS)
TABLE 237 AUSTRALIA FILM AND SHEET IN PLASTICISED POLYVINYL CHLORIDE (PVC) COMPOUND MARKET, BY FORM, 2020-2029 (USD MILLION)
TABLE 238 AUSTRALIA FILM AND SHEET IN PLASTICISED POLYVINYL CHLORIDE (PVC) COMPOUND MARKET, BY FORM, 2020-2029 (KILO TONS)
TABLE 239 AUSTRALIA WIRE AND CABLING IN PLASTICISED POLYVINYL CHLORIDE (PVC) COMPOUND MARKET, BY FORM, 2020-2029 (USD MILLION)
TABLE 240 AUSTRALIA WIRE AND CABLING IN PLASTICISED POLYVINYL CHLORIDE (PVC) COMPOUND MARKET, BY FORM, 2020-2029 (KILO TONS)
TABLE 241 AUSTRALIA PIPE AND FITTING IN PLASTICISED POLYVINYL CHLORIDE (PVC) COMPOUND MARKET, BY FORM, 2020-2029 (USD MILLION)
TABLE 242 AUSTRALIA PIPE AND FITTING IN PLASTICISED POLYVINYL CHLORIDE (PVC) COMPOUND MARKET, BY FORM, 2020-2029 (KILO TONS)
TABLE 243 AUSTRALIA PROFILES AND TUBES IN PLASTICISED POLYVINYL CHLORIDE (PVC) COMPOUND MARKET, BY FORM, 2020-2029 (USD MILLION)
TABLE 244 AUSTRALIA PROFILES AND TUBES IN PLASTICISED POLYVINYL CHLORIDE (PVC) COMPOUND MARKET, BY FORM, 2020-2029 (KILO TONS)
TABLE 245 AUSTRALIA OTHERS IN PLASTICISED POLYVINYL CHLORIDE (PVC) COMPOUND MARKET, BY FORM, 2020-2029 (USD MILLION)
TABLE 246 AUSTRALIA OTHERS IN PLASTICISED POLYVINYL CHLORIDE (PVC) COMPOUND MARKET, BY FORM, 2020-2029 (KILO TONS)
TABLE 247 AUSTRALIA PLASTICISED POLYVINYL CHLORIDE (PVC) COMPOUND MARKET, BY END USE, 2020-2029 (USD MILLION)
TABLE 248 AUSTRALIA PLASTICISED POLYVINYL CHLORIDE (PVC) COMPOUND MARKET, BY END USE, 2020-2029 (KILO TONS)
TABLE 249 AUSTRALIA ELECTRICAL AND ELECTRONIC IN PLASTICISED POLYVINYL CHLORIDE (PVC) COMPOUND MARKET, BY FORM, 2020-2029 (USD MILLION)
TABLE 250 AUSTRALIA ELECTRICAL AND ELECTRONIC IN PLASTICISED POLYVINYL CHLORIDE (PVC) COMPOUND MARKET, BY FORM, 2020-2029 (KILO TONS)
TABLE 251 AUSTRALIA AUTOMOTIVE IN PLASTICISED POLYVINYL CHLORIDE (PVC) COMPOUND MARKET, BY FORM, 2020-2029 (USD MILLION)
TABLE 252 AUSTRALIA AUTOMOTIVE IN PLASTICISED POLYVINYL CHLORIDE (PVC) COMPOUND MARKET, BY FORM, 2020-2029 (KILO TONS)
TABLE 253 AUSTRALIA MEDICAL IN PLASTICISED POLYVINYL CHLORIDE (PVC) COMPOUND MARKET, BY FORM, 2020-2029 (USD MILLION)
TABLE 254 AUSTRALIA MEDICAL IN PLASTICISED POLYVINYL CHLORIDE (PVC) COMPOUND MARKET, BY FORM, 2020-2029 (KILO TONS)
TABLE 255 AUSTRALIA CONSUMER GOODS IN PLASTICISED POLYVINYL CHLORIDE (PVC) COMPOUND MARKET, BY FORM, 2020-2029 (USD MILLION)
TABLE 256 AUSTRALIA CONSUMER GOODS IN PLASTICISED POLYVINYL CHLORIDE (PVC) COMPOUND MARKET, BY FORM, 2020-2029 (KILO TONS)
TABLE 257 AUSTRALIA PACKAGING IN PLASTICISED POLYVINYL CHLORIDE (PVC) COMPOUND MARKET, BY FORM, 2020-2029 (USD MILLION)
TABLE 258 AUSTRALIA PACKAGING IN PLASTICISED POLYVINYL CHLORIDE (PVC) COMPOUND MARKET, BY FORM, 2020-2029 (KILO TONS)
TABLE 259 AUSTRALIA BUILDING AND CONSTRUCTION IN PLASTICISED POLYVINYL CHLORIDE (PVC) COMPOUND MARKET, BY FORM, 2020-2029 (USD MILLION)
TABLE 260 AUSTRALIA BUILDING AND CONSTRUCTION IN PLASTICISED POLYVINYL CHLORIDE (PVC) COMPOUND MARKET, BY FORM, 2020-2029 (KILO TONS)
TABLE 261 AUSTRALIA OTHERS IN PLASTICISED POLYVINYL CHLORIDE (PVC) COMPOUND MARKET, BY FORM, 2020-2029 (USD MILLION)
TABLE 262 AUSTRALIA OTHERS IN PLASTICISED POLYVINYL CHLORIDE (PVC) COMPOUND MARKET, BY FORM, 2020-2029 (KILO TONS)
TABLE 263 SINGAPORE PLASTICISED POLYVINYL CHLORIDE (PVC) COMPOUND MARKET, BY FORM, 2020-2029 (USD MILLION)
TABLE 264 SINGAPORE PLASTICISED POLYVINYL CHLORIDE (PVC) COMPOUND MARKET, BY FORM, 2020-2029 (KILO TONS)
TABLE 265 SINGAPORE PLASTICISED POLYVINYL CHLORIDE (PVC) COMPOUND MARKET, BY MANUFACTURING PROCESS, 2020-2029 (USD MILLION)
TABLE 266 SINGAPORE PLASTICISED POLYVINYL CHLORIDE (PVC) COMPOUND MARKET, BY MANUFACTURING PROCESS, 2020-2029 (KILO TONS)
TABLE 267 SINGAPORE PLASTICISED POLYVINYL CHLORIDE (PVC) COMPOUND MARKET, BY APPLICATION, 2020-2029 (USD MILLION)
TABLE 268 SINGAPORE PLASTICISED POLYVINYL CHLORIDE (PVC) COMPOUND MARKET, BY APPLICATION, 2020-2029 (KILO TONS)
TABLE 269 SINGAPORE FILM AND SHEET IN PLASTICISED POLYVINYL CHLORIDE (PVC) COMPOUND MARKET, BY FORM, 2020-2029 (USD MILLION)
TABLE 270 SINGAPORE FILM AND SHEET IN PLASTICISED POLYVINYL CHLORIDE (PVC) COMPOUND MARKET, BY FORM, 2020-2029 (KILO TONS)
TABLE 271 SINGAPORE WIRE AND CABLING IN PLASTICISED POLYVINYL CHLORIDE (PVC) COMPOUND MARKET, BY FORM, 2020-2029 (USD MILLION)
TABLE 272 SINGAPORE WIRE AND CABLING IN PLASTICISED POLYVINYL CHLORIDE (PVC) COMPOUND MARKET, BY FORM, 2020-2029 (KILO TONS)
TABLE 273 SINGAPORE PIPE AND FITTING IN PLASTICISED POLYVINYL CHLORIDE (PVC) COMPOUND MARKET, BY FORM, 2020-2029 (USD MILLION)
TABLE 274 SINGAPORE PIPE AND FITTING IN PLASTICISED POLYVINYL CHLORIDE (PVC) COMPOUND MARKET, BY FORM, 2020-2029 (KILO TONS)
TABLE 275 SINGAPORE PROFILES AND TUBES IN PLASTICISED POLYVINYL CHLORIDE (PVC) COMPOUND MARKET, BY FORM, 2020-2029 (USD MILLION)
TABLE 276 SINGAPORE PROFILES AND TUBES IN PLASTICISED POLYVINYL CHLORIDE (PVC) COMPOUND MARKET, BY FORM, 2020-2029 (KILO TONS)
TABLE 277 SINGAPORE OTHERS IN PLASTICISED POLYVINYL CHLORIDE (PVC) COMPOUND MARKET, BY FORM, 2020-2029 (USD MILLION)
TABLE 278 SINGAPORE OTHERS IN PLASTICISED POLYVINYL CHLORIDE (PVC) COMPOUND MARKET, BY FORM, 2020-2029 (KILO TONS)
TABLE 279 SINGAPORE PLASTICISED POLYVINYL CHLORIDE (PVC) COMPOUND MARKET, BY END USE, 2020-2029 (USD MILLION)
TABLE 280 SINGAPORE PLASTICISED POLYVINYL CHLORIDE (PVC) COMPOUND MARKET, BY END USE, 2020-2029 (KILO TONS)
TABLE 281 SINGAPORE ELECTRICAL AND ELECTRONIC IN PLASTICISED POLYVINYL CHLORIDE (PVC) COMPOUND MARKET, BY FORM, 2020-2029 (USD MILLION)
TABLE 282 SINGAPORE ELECTRICAL AND ELECTRONIC IN PLASTICISED POLYVINYL CHLORIDE (PVC) COMPOUND MARKET, BY FORM, 2020-2029 (KILO TONS)
TABLE 283 SINGAPORE AUTOMOTIVE IN PLASTICISED POLYVINYL CHLORIDE (PVC) COMPOUND MARKET, BY FORM, 2020-2029 (USD MILLION)
TABLE 284 SINGAPORE AUTOMOTIVE IN PLASTICISED POLYVINYL CHLORIDE (PVC) COMPOUND MARKET, BY FORM, 2020-2029 (KILO TONS)
TABLE 285 SINGAPORE MEDICAL IN PLASTICISED POLYVINYL CHLORIDE (PVC) COMPOUND MARKET, BY FORM, 2020-2029 (USD MILLION)
TABLE 286 SINGAPORE MEDICAL IN PLASTICISED POLYVINYL CHLORIDE (PVC) COMPOUND MARKET, BY FORM, 2020-2029 (KILO TONS)
TABLE 287 SINGAPORE CONSUMER GOODS IN PLASTICISED POLYVINYL CHLORIDE (PVC) COMPOUND MARKET, BY FORM, 2020-2029 (USD MILLION)
TABLE 288 SINGAPORE CONSUMER GOODS IN PLASTICISED POLYVINYL CHLORIDE (PVC) COMPOUND MARKET, BY FORM, 2020-2029 (KILO TONS)
TABLE 289 SINGAPORE PACKAGING IN PLASTICISED POLYVINYL CHLORIDE (PVC) COMPOUND MARKET, BY FORM, 2020-2029 (USD MILLION)
TABLE 290 SINGAPORE PACKAGING IN PLASTICISED POLYVINYL CHLORIDE (PVC) COMPOUND MARKET, BY FORM, 2020-2029 (KILO TONS)
TABLE 291 SINGAPORE BUILDING AND CONSTRUCTION IN PLASTICISED POLYVINYL CHLORIDE (PVC) COMPOUND MARKET, BY FORM, 2020-2029 (USD MILLION)
TABLE 292 SINGAPORE BUILDING AND CONSTRUCTION IN PLASTICISED POLYVINYL CHLORIDE (PVC) COMPOUND MARKET, BY FORM, 2020-2029 (KILO TONS)
TABLE 293 SINGAPORE OTHERS IN PLASTICISED POLYVINYL CHLORIDE (PVC) COMPOUND MARKET, BY FORM, 2020-2029 (USD MILLION)
TABLE 294 SINGAPORE OTHERS IN PLASTICISED POLYVINYL CHLORIDE (PVC) COMPOUND MARKET, BY FORM, 2020-2029 (KILO TONS)
TABLE 295 INDONESIA PLASTICISED POLYVINYL CHLORIDE (PVC) COMPOUND MARKET, BY FORM, 2020-2029 (USD MILLION)
TABLE 296 INDONESIA PLASTICISED POLYVINYL CHLORIDE (PVC) COMPOUND MARKET, BY FORM, 2020-2029 (KILO TONS)
TABLE 297 INDONESIA PLASTICISED POLYVINYL CHLORIDE (PVC) COMPOUND MARKET, BY MANUFACTURING PROCESS, 2020-2029 (USD MILLION)
TABLE 298 INDONESIA PLASTICISED POLYVINYL CHLORIDE (PVC) COMPOUND MARKET, BY MANUFACTURING PROCESS, 2020-2029 (KILO TONS)
TABLE 299 INDONESIA PLASTICISED POLYVINYL CHLORIDE (PVC) COMPOUND MARKET, BY APPLICATION, 2020-2029 (USD MILLION)
TABLE 300 INDONESIA PLASTICISED POLYVINYL CHLORIDE (PVC) COMPOUND MARKET, BY APPLICATION, 2020-2029 (KILO TONS)
TABLE 301 INDONESIA FILM AND SHEET IN PLASTICISED POLYVINYL CHLORIDE (PVC) COMPOUND MARKET, BY FORM, 2020-2029 (USD MILLION)
TABLE 302 INDONESIA FILM AND SHEET IN PLASTICISED POLYVINYL CHLORIDE (PVC) COMPOUND MARKET, BY FORM, 2020-2029 (KILO TONS)
TABLE 303 INDONESIA WIRE AND CABLING IN PLASTICISED POLYVINYL CHLORIDE (PVC) COMPOUND MARKET, BY FORM, 2020-2029 (USD MILLION)
TABLE 304 INDONESIA WIRE AND CABLING IN PLASTICISED POLYVINYL CHLORIDE (PVC) COMPOUND MARKET, BY FORM, 2020-2029 (KILO TONS)
TABLE 305 INDONESIA PIPE AND FITTING IN PLASTICISED POLYVINYL CHLORIDE (PVC) COMPOUND MARKET, BY FORM, 2020-2029 (USD MILLION)
TABLE 306 INDONESIA PIPE AND FITTING IN PLASTICISED POLYVINYL CHLORIDE (PVC) COMPOUND MARKET, BY FORM, 2020-2029 (KILO TONS)
TABLE 307 INDONESIA PROFILES AND TUBES IN PLASTICISED POLYVINYL CHLORIDE (PVC) COMPOUND MARKET, BY FORM, 2020-2029 (USD MILLION)
TABLE 308 INDONESIA PROFILES AND TUBES IN PLASTICISED POLYVINYL CHLORIDE (PVC) COMPOUND MARKET, BY FORM, 2020-2029 (KILO TONS)
TABLE 309 INDONESIA OTHERS IN PLASTICISED POLYVINYL CHLORIDE (PVC) COMPOUND MARKET, BY FORM, 2020-2029 (USD MILLION)
TABLE 310 INDONESIA OTHERS IN PLASTICISED POLYVINYL CHLORIDE (PVC) COMPOUND MARKET, BY FORM, 2020-2029 (KILO TONS)
TABLE 311 INDONESIA PLASTICISED POLYVINYL CHLORIDE (PVC) COMPOUND MARKET, BY END USE, 2020-2029 (USD MILLION)
TABLE 312 INDONESIA PLASTICISED POLYVINYL CHLORIDE (PVC) COMPOUND MARKET, BY END USE, 2020-2029 (KILO TONS)
TABLE 313 INDONESIA ELECTRICAL AND ELECTRONIC IN PLASTICISED POLYVINYL CHLORIDE (PVC) COMPOUND MARKET, BY FORM, 2020-2029 (USD MILLION)
TABLE 314 INDONESIA ELECTRICAL AND ELECTRONIC IN PLASTICISED POLYVINYL CHLORIDE (PVC) COMPOUND MARKET, BY FORM, 2020-2029 (KILO TONS)
TABLE 315 INDONESIA AUTOMOTIVE IN PLASTICISED POLYVINYL CHLORIDE (PVC) COMPOUND MARKET, BY FORM, 2020-2029 (USD MILLION)
TABLE 316 INDONESIA AUTOMOTIVE IN PLASTICISED POLYVINYL CHLORIDE (PVC) COMPOUND MARKET, BY FORM, 2020-2029 (KILO TONS)
TABLE 317 INDONESIA MEDICAL IN PLASTICISED POLYVINYL CHLORIDE (PVC) COMPOUND MARKET, BY FORM, 2020-2029 (USD MILLION)
TABLE 318 INDONESIA MEDICAL IN PLASTICISED POLYVINYL CHLORIDE (PVC) COMPOUND MARKET, BY FORM, 2020-2029 (KILO TONS)
TABLE 319 INDONESIA CONSUMER GOODS IN PLASTICISED POLYVINYL CHLORIDE (PVC) COMPOUND MARKET, BY FORM, 2020-2029 (USD MILLION)
TABLE 320 INDONESIA CONSUMER GOODS IN PLASTICISED POLYVINYL CHLORIDE (PVC) COMPOUND MARKET, BY FORM, 2020-2029 (KILO TONS)
TABLE 321 INDONESIA PACKAGING IN PLASTICISED POLYVINYL CHLORIDE (PVC) COMPOUND MARKET, BY FORM, 2020-2029 (USD MILLION)
TABLE 322 INDONESIA PACKAGING IN PLASTICISED POLYVINYL CHLORIDE (PVC) COMPOUND MARKET, BY FORM, 2020-2029 (KILO TONS)
TABLE 323 INDONESIA BUILDING AND CONSTRUCTION IN PLASTICISED POLYVINYL CHLORIDE (PVC) COMPOUND MARKET, BY FORM, 2020-2029 (USD MILLION)
TABLE 324 INDONESIA BUILDING AND CONSTRUCTION IN PLASTICISED POLYVINYL CHLORIDE (PVC) COMPOUND MARKET, BY FORM, 2020-2029 (KILO TONS)
TABLE 325 INDONESIA OTHERS IN PLASTICISED POLYVINYL CHLORIDE (PVC) COMPOUND MARKET, BY FORM, 2020-2029 (USD MILLION)
TABLE 326 INDONESIA OTHERS IN PLASTICISED POLYVINYL CHLORIDE (PVC) COMPOUND MARKET, BY FORM, 2020-2029 (KILO TONS)
TABLE 327 THAILAND PLASTICISED POLYVINYL CHLORIDE (PVC) COMPOUND MARKET, BY FORM, 2020-2029 (USD MILLION)
TABLE 328 THAILAND PLASTICISED POLYVINYL CHLORIDE (PVC) COMPOUND MARKET, BY FORM, 2020-2029 (KILO TONS)
TABLE 329 THAILAND PLASTICISED POLYVINYL CHLORIDE (PVC) COMPOUND MARKET, BY MANUFACTURING PROCESS, 2020-2029 (USD MILLION)
TABLE 330 THAILAND PLASTICISED POLYVINYL CHLORIDE (PVC) COMPOUND MARKET, BY MANUFACTURING PROCESS, 2020-2029 (KILO TONS)
TABLE 331 THAILAND PLASTICISED POLYVINYL CHLORIDE (PVC) COMPOUND MARKET, BY APPLICATION, 2020-2029 (USD MILLION)
TABLE 332 THAILAND PLASTICISED POLYVINYL CHLORIDE (PVC) COMPOUND MARKET, BY APPLICATION, 2020-2029 (KILO TONS)
TABLE 333 THAILAND FILM AND SHEET IN PLASTICISED POLYVINYL CHLORIDE (PVC) COMPOUND MARKET, BY FORM, 2020-2029 (USD MILLION)
TABLE 334 THAILAND FILM AND SHEET IN PLASTICISED POLYVINYL CHLORIDE (PVC) COMPOUND MARKET, BY FORM, 2020-2029 (KILO TONS)
TABLE 335 THAILAND WIRE AND CABLING IN PLASTICISED POLYVINYL CHLORIDE (PVC) COMPOUND MARKET, BY FORM, 2020-2029 (USD MILLION)
TABLE 336 THAILAND WIRE AND CABLING IN PLASTICISED POLYVINYL CHLORIDE (PVC) COMPOUND MARKET, BY FORM, 2020-2029 (KILO TONS)
TABLE 337 THAILAND PIPE AND FITTING IN PLASTICISED POLYVINYL CHLORIDE (PVC) COMPOUND MARKET, BY FORM, 2020-2029 (USD MILLION)
TABLE 338 THAILAND PIPE AND FITTING IN PLASTICISED POLYVINYL CHLORIDE (PVC) COMPOUND MARKET, BY FORM, 2020-2029 (KILO TONS)
TABLE 339 THAILAND PROFILES AND TUBES IN PLASTICISED POLYVINYL CHLORIDE (PVC) COMPOUND MARKET, BY FORM, 2020-2029 (USD MILLION)
TABLE 340 THAILAND PROFILES AND TUBES IN PLASTICISED POLYVINYL CHLORIDE (PVC) COMPOUND MARKET, BY FORM, 2020-2029 (KILO TONS)
TABLE 341 THAILAND OTHERS IN PLASTICISED POLYVINYL CHLORIDE (PVC) COMPOUND MARKET, BY FORM, 2020-2029 (USD MILLION)
TABLE 342 THAILAND OTHERS IN PLASTICISED POLYVINYL CHLORIDE (PVC) COMPOUND MARKET, BY FORM, 2020-2029 (KILO TONS)
TABLE 343 THAILAND PLASTICISED POLYVINYL CHLORIDE (PVC) COMPOUND MARKET, BY END USE, 2020-2029 (USD MILLION)
TABLE 344 THAILAND PLASTICISED POLYVINYL CHLORIDE (PVC) COMPOUND MARKET, BY END USE, 2020-2029 (KILO TONS)
TABLE 345 THAILAND ELECTRICAL AND ELECTRONIC IN PLASTICISED POLYVINYL CHLORIDE (PVC) COMPOUND MARKET, BY FORM, 2020-2029 (USD MILLION)
TABLE 346 THAILAND ELECTRICAL AND ELECTRONIC IN PLASTICISED POLYVINYL CHLORIDE (PVC) COMPOUND MARKET, BY FORM, 2020-2029 (KILO TONS)
TABLE 347 THAILAND AUTOMOTIVE IN PLASTICISED POLYVINYL CHLORIDE (PVC) COMPOUND MARKET, BY FORM, 2020-2029 (USD MILLION)
TABLE 348 THAILAND AUTOMOTIVE IN PLASTICISED POLYVINYL CHLORIDE (PVC) COMPOUND MARKET, BY FORM, 2020-2029 (KILO TONS)
TABLE 349 THAILAND MEDICAL IN PLASTICISED POLYVINYL CHLORIDE (PVC) COMPOUND MARKET, BY FORM, 2020-2029 (USD MILLION)
TABLE 350 THAILAND MEDICAL IN PLASTICISED POLYVINYL CHLORIDE (PVC) COMPOUND MARKET, BY FORM, 2020-2029 (KILO TONS)
TABLE 351 THAILAND CONSUMER GOODS IN PLASTICISED POLYVINYL CHLORIDE (PVC) COMPOUND MARKET, BY FORM, 2020-2029 (USD MILLION)
TABLE 352 THAILAND CONSUMER GOODS IN PLASTICISED POLYVINYL CHLORIDE (PVC) COMPOUND MARKET, BY FORM, 2020-2029 (KILO TONS)
TABLE 353 THAILAND PACKAGING IN PLASTICISED POLYVINYL CHLORIDE (PVC) COMPOUND MARKET, BY FORM, 2020-2029 (USD MILLION)
TABLE 354 THAILAND PACKAGING IN PLASTICISED POLYVINYL CHLORIDE (PVC) COMPOUND MARKET, BY FORM, 2020-2029 (KILO TONS)
TABLE 355 THAILAND BUILDING AND CONSTRUCTION IN PLASTICISED POLYVINYL CHLORIDE (PVC) COMPOUND MARKET, BY FORM, 2020-2029 (USD MILLION)
TABLE 356 THAILAND BUILDING AND CONSTRUCTION IN PLASTICISED POLYVINYL CHLORIDE (PVC) COMPOUND MARKET, BY FORM, 2020-2029 (KILO TONS)
TABLE 357 THAILAND OTHERS IN PLASTICISED POLYVINYL CHLORIDE (PVC) COMPOUND MARKET, BY FORM, 2020-2029 (USD MILLION)
TABLE 358 THAILAND OTHERS IN PLASTICISED POLYVINYL CHLORIDE (PVC) COMPOUND MARKET, BY FORM, 2020-2029 (KILO TONS)
TABLE 359 MALAYSIA PLASTICISED POLYVINYL CHLORIDE (PVC) COMPOUND MARKET, BY FORM, 2020-2029 (USD MILLION)
TABLE 360 MALAYSIA PLASTICISED POLYVINYL CHLORIDE (PVC) COMPOUND MARKET, BY FORM, 2020-2029 (KILO TONS)
TABLE 361 MALAYSIA PLASTICISED POLYVINYL CHLORIDE (PVC) COMPOUND MARKET, BY MANUFACTURING PROCESS, 2020-2029 (USD MILLION)
TABLE 362 MALAYSIA PLASTICISED POLYVINYL CHLORIDE (PVC) COMPOUND MARKET, BY MANUFACTURING PROCESS, 2020-2029 (KILO TONS)
TABLE 363 MALAYSIA PLASTICISED POLYVINYL CHLORIDE (PVC) COMPOUND MARKET, BY APPLICATION, 2020-2029 (USD MILLION)
TABLE 364 MALAYSIA PLASTICISED POLYVINYL CHLORIDE (PVC) COMPOUND MARKET, BY APPLICATION, 2020-2029 (KILO TONS)
TABLE 365 MALAYSIA FILM AND SHEET IN PLASTICISED POLYVINYL CHLORIDE (PVC) COMPOUND MARKET, BY FORM, 2020-2029 (USD MILLION)
TABLE 366 MALAYSIA FILM AND SHEET IN PLASTICISED POLYVINYL CHLORIDE (PVC) COMPOUND MARKET, BY FORM, 2020-2029 (KILO TONS)
TABLE 367 MALAYSIA WIRE AND CABLING IN PLASTICISED POLYVINYL CHLORIDE (PVC) COMPOUND MARKET, BY FORM, 2020-2029 (USD MILLION)
TABLE 368 MALAYSIA WIRE AND CABLING IN PLASTICISED POLYVINYL CHLORIDE (PVC) COMPOUND MARKET, BY FORM, 2020-2029 (KILO TONS)
TABLE 369 MALAYSIA PIPE AND FITTING IN PLASTICISED POLYVINYL CHLORIDE (PVC) COMPOUND MARKET, BY FORM, 2020-2029 (USD MILLION)
TABLE 370 MALAYSIA PIPE AND FITTING IN PLASTICISED POLYVINYL CHLORIDE (PVC) COMPOUND MARKET, BY FORM, 2020-2029 (KILO TONS)
TABLE 371 MALAYSIA PROFILES AND TUBES IN PLASTICISED POLYVINYL CHLORIDE (PVC) COMPOUND MARKET, BY FORM, 2020-2029 (USD MILLION)
TABLE 372 MALAYSIA PROFILES AND TUBES IN PLASTICISED POLYVINYL CHLORIDE (PVC) COMPOUND MARKET, BY FORM, 2020-2029 (KILO TONS)
TABLE 373 MALAYSIA OTHERS IN PLASTICISED POLYVINYL CHLORIDE (PVC) COMPOUND MARKET, BY FORM, 2020-2029 (USD MILLION)
TABLE 374 MALAYSIA OTHERS IN PLASTICISED POLYVINYL CHLORIDE (PVC) COMPOUND MARKET, BY FORM, 2020-2029 (KILO TONS)
TABLE 375 MALAYSIA PLASTICISED POLYVINYL CHLORIDE (PVC) COMPOUND MARKET, BY END USE, 2020-2029 (USD MILLION)
TABLE 376 MALAYSIA PLASTICISED POLYVINYL CHLORIDE (PVC) COMPOUND MARKET, BY END USE, 2020-2029 (KILO TONS)
TABLE 377 MALAYSIA ELECTRICAL AND ELECTRONIC IN PLASTICISED POLYVINYL CHLORIDE (PVC) COMPOUND MARKET, BY FORM, 2020-2029 (USD MILLION)
TABLE 378 MALAYSIA ELECTRICAL AND ELECTRONIC IN PLASTICISED POLYVINYL CHLORIDE (PVC) COMPOUND MARKET, BY FORM, 2020-2029 (KILO TONS)
TABLE 379 MALAYSIA AUTOMOTIVE IN PLASTICISED POLYVINYL CHLORIDE (PVC) COMPOUND MARKET, BY FORM, 2020-2029 (USD MILLION)
TABLE 380 MALAYSIA AUTOMOTIVE IN PLASTICISED POLYVINYL CHLORIDE (PVC) COMPOUND MARKET, BY FORM, 2020-2029 (KILO TONS)
TABLE 381 MALAYSIA MEDICAL IN PLASTICISED POLYVINYL CHLORIDE (PVC) COMPOUND MARKET, BY FORM, 2020-2029 (USD MILLION)
TABLE 382 MALAYSIA MEDICAL IN PLASTICISED POLYVINYL CHLORIDE (PVC) COMPOUND MARKET, BY FORM, 2020-2029 (KILO TONS)
TABLE 383 MALAYSIA CONSUMER GOODS IN PLASTICISED POLYVINYL CHLORIDE (PVC) COMPOUND MARKET, BY FORM, 2020-2029 (USD MILLION)
TABLE 384 MALAYSIA CONSUMER GOODS IN PLASTICISED POLYVINYL CHLORIDE (PVC) COMPOUND MARKET, BY FORM, 2020-2029 (KILO TONS)
TABLE 385 MALAYSIA PACKAGING IN PLASTICISED POLYVINYL CHLORIDE (PVC) COMPOUND MARKET, BY FORM, 2020-2029 (USD MILLION)
TABLE 386 MALAYSIA PACKAGING IN PLASTICISED POLYVINYL CHLORIDE (PVC) COMPOUND MARKET, BY FORM, 2020-2029 (KILO TONS)
TABLE 387 MALAYSIA BUILDING AND CONSTRUCTION IN PLASTICISED POLYVINYL CHLORIDE (PVC) COMPOUND MARKET, BY FORM, 2020-2029 (USD MILLION)
TABLE 388 MALAYSIA BUILDING AND CONSTRUCTION IN PLASTICISED POLYVINYL CHLORIDE (PVC) COMPOUND MARKET, BY FORM, 2020-2029 (KILO TONS)
TABLE 389 MALAYSIA OTHERS IN PLASTICISED POLYVINYL CHLORIDE (PVC) COMPOUND MARKET, BY FORM, 2020-2029 (USD MILLION)
TABLE 390 MALAYSIA OTHERS IN PLASTICISED POLYVINYL CHLORIDE (PVC) COMPOUND MARKET, BY FORM, 2020-2029 (KILO TONS)
TABLE 391 PHILIPPINES PLASTICISED POLYVINYL CHLORIDE (PVC) COMPOUND MARKET, BY FORM, 2020-2029 (USD MILLION)
TABLE 392 PHILIPPINES PLASTICISED POLYVINYL CHLORIDE (PVC) COMPOUND MARKET, BY FORM, 2020-2029 (KILO TONS)
TABLE 393 PHILIPPINES PLASTICISED POLYVINYL CHLORIDE (PVC) COMPOUND MARKET, BY MANUFACTURING PROCESS, 2020-2029 (USD MILLION)
TABLE 394 PHILIPPINES PLASTICISED POLYVINYL CHLORIDE (PVC) COMPOUND MARKET, BY MANUFACTURING PROCESS, 2020-2029 (KILO TONS)
TABLE 395 PHILIPPINES PLASTICISED POLYVINYL CHLORIDE (PVC) COMPOUND MARKET, BY APPLICATION, 2020-2029 (USD MILLION)
TABLE 396 PHILIPPINES PLASTICISED POLYVINYL CHLORIDE (PVC) COMPOUND MARKET, BY APPLICATION, 2020-2029 (KILO TONS)
TABLE 397 PHILIPPINES FILM AND SHEET IN PLASTICISED POLYVINYL CHLORIDE (PVC) COMPOUND MARKET, BY FORM, 2020-2029 (USD MILLION)
TABLE 398 PHILIPPINES FILM AND SHEET IN PLASTICISED POLYVINYL CHLORIDE (PVC) COMPOUND MARKET, BY FORM, 2020-2029 (KILO TONS)
TABLE 399 PHILIPPINES WIRE AND CABLING IN PLASTICISED POLYVINYL CHLORIDE (PVC) COMPOUND MARKET, BY FORM, 2020-2029 (USD MILLION)
TABLE 400 PHILIPPINES WIRE AND CABLING IN PLASTICISED POLYVINYL CHLORIDE (PVC) COMPOUND MARKET, BY FORM, 2020-2029 (KILO TONS)
TABLE 401 PHILIPPINES PIPE AND FITTING IN PLASTICISED POLYVINYL CHLORIDE (PVC) COMPOUND MARKET, BY FORM, 2020-2029 (USD MILLION)
TABLE 402 PHILIPPINES PIPE AND FITTING IN PLASTICISED POLYVINYL CHLORIDE (PVC) COMPOUND MARKET, BY FORM, 2020-2029 (KILO TONS)
TABLE 403 PHILIPPINES PROFILES AND TUBES IN PLASTICISED POLYVINYL CHLORIDE (PVC) COMPOUND MARKET, BY FORM, 2020-2029 (USD MILLION)
TABLE 404 PHILIPPINES PROFILES AND TUBES IN PLASTICISED POLYVINYL CHLORIDE (PVC) COMPOUND MARKET, BY FORM, 2020-2029 (KILO TONS)
TABLE 405 PHILIPPINES OTHERS IN PLASTICISED POLYVINYL CHLORIDE (PVC) COMPOUND MARKET, BY FORM, 2020-2029 (USD MILLION)
TABLE 406 PHILIPPINES OTHERS IN PLASTICISED POLYVINYL CHLORIDE (PVC) COMPOUND MARKET, BY FORM, 2020-2029 (KILO TONS)
TABLE 407 PHILIPPINES PLASTICISED POLYVINYL CHLORIDE (PVC) COMPOUND MARKET, BY END USE, 2020-2029 (USD MILLION)
TABLE 408 PHILIPPINES PLASTICISED POLYVINYL CHLORIDE (PVC) COMPOUND MARKET, BY END USE, 2020-2029 (KILO TONS)
TABLE 409 PHILIPPINES ELECTRICAL AND ELECTRONIC IN PLASTICISED POLYVINYL CHLORIDE (PVC) COMPOUND MARKET, BY FORM, 2020-2029 (USD MILLION)
TABLE 410 PHILIPPINES ELECTRICAL AND ELECTRONIC IN PLASTICISED POLYVINYL CHLORIDE (PVC) COMPOUND MARKET, BY FORM, 2020-2029 (KILO TONS)
TABLE 411 PHILIPPINES AUTOMOTIVE IN PLASTICISED POLYVINYL CHLORIDE (PVC) COMPOUND MARKET, BY FORM, 2020-2029 (USD MILLION)
TABLE 412 PHILIPPINES AUTOMOTIVE IN PLASTICISED POLYVINYL CHLORIDE (PVC) COMPOUND MARKET, BY FORM, 2020-2029 (KILO TONS)
TABLE 413 PHILIPPINES MEDICAL IN PLASTICISED POLYVINYL CHLORIDE (PVC) COMPOUND MARKET, BY FORM, 2020-2029 (USD MILLION)
TABLE 414 PHILIPPINES MEDICAL IN PLASTICISED POLYVINYL CHLORIDE (PVC) COMPOUND MARKET, BY FORM, 2020-2029 (KILO TONS)
TABLE 415 PHILIPPINES CONSUMER GOODS IN PLASTICISED POLYVINYL CHLORIDE (PVC) COMPOUND MARKET, BY FORM, 2020-2029 (USD MILLION)
TABLE 416 PHILIPPINES CONSUMER GOODS IN PLASTICISED POLYVINYL CHLORIDE (PVC) COMPOUND MARKET, BY FORM, 2020-2029 (KILO TONS)
TABLE 417 PHILIPPINES PACKAGING IN PLASTICISED POLYVINYL CHLORIDE (PVC) COMPOUND MARKET, BY FORM, 2020-2029 (USD MILLION)
TABLE 418 PHILIPPINES PACKAGING IN PLASTICISED POLYVINYL CHLORIDE (PVC) COMPOUND MARKET, BY FORM, 2020-2029 (KILO TONS)
TABLE 419 PHILIPPINES BUILDING AND CONSTRUCTION IN PLASTICISED POLYVINYL CHLORIDE (PVC) COMPOUND MARKET, BY FORM, 2020-2029 (USD MILLION)
TABLE 420 PHILIPPINES BUILDING AND CONSTRUCTION IN PLASTICISED POLYVINYL CHLORIDE (PVC) COMPOUND MARKET, BY FORM, 2020-2029 (KILO TONS)
TABLE 421 PHILIPPINES OTHERS IN PLASTICISED POLYVINYL CHLORIDE (PVC) COMPOUND MARKET, BY FORM, 2020-2029 (USD MILLION)
TABLE 422 PHILIPPINES OTHERS IN PLASTICISED POLYVINYL CHLORIDE (PVC) COMPOUND MARKET, BY FORM, 2020-2029 (KILO TONS)
TABLE 423 REST OF ASIA-PACIFIC PLASTICISED POLYVINYL CHLORIDE (PVC) COMPOUND MARKET, BY FORM, 2020-2029 (USD MILLION)
TABLE 424 REST OF ASIA-PACIFIC PLASTICISED POLYVINYL CHLORIDE (PVC) COMPOUND MARKET, BY FORM, 2020-2029 (KILO TONS)
List of Figure
FIGURE 1 ASIA PACIFIC PLASTICISED POLYVINYL CHLORIDE (PVC) COMPOUND MARKET: SEGMENTATION
FIGURE 2 ASIA PACIFIC PLASTICISED POLYVINYL CHLORIDE (PVC) COMPOUND MARKET: DATA TRIANGULATION
FIGURE 3 ASIA PACIFIC PLASTICISED POLYVINYL CHLORIDE (PVC) COMPOUND MARKET: DROC ANALYSIS
FIGURE 4 ASIA PACIFIC PLASTICISED POLYVINYL CHLORIDE (PVC) COMPOUND MARKET: ASIA PACIFIC VS REGIONAL MARKET ANALYSIS
FIGURE 5 ASIA PACIFIC PLASTICISED POLYVINYL CHLORIDE (PVC) COMPOUND MARKET: COMPANY RESEARCH ANALYSIS
FIGURE 6 ASIA PACIFIC PLASTICISED POLYVINYL CHLORIDE (PVC) COMPOUND MARKET: FORM LIFELINE CURVE
FIGURE 7 ASIA PACIFIC PLASTICISED POLYVINYL CHLORIDE (PVC) COMPOUND MARKET: MULTIVARIATE MODELLING
FIGURE 8 ASIA PACIFIC PLASTICISED POLYVINYL CHLORIDE (PVC) COMPOUND MARKET: INTERVIEW DEMOGRAPHICS
FIGURE 9 ASIA PACIFIC PLASTICISED POLYVINYL CHLORIDE (PVC) COMPOUND MARKET: DBMR MARKET POSITION GRID
FIGURE 10 ASIA PACIFIC PLASTICISED POLYVINYL CHLORIDE (PVC) COMPOUND MARKET: CONSUMER CATEGORY COVERAGE GRID
FIGURE 11 ASIA PACIFIC PLASTICISED POLYVINYL CHLORIDE (PVC) COMPOUND MARKET: CHALLENGE MATRIX
FIGURE 12 ASIA PACIFIC PLASTICISED POLYVINYL CHLORIDE (PVC) COMPOUND MARKET: VENDOR SHARE ANALYSIS
FIGURE 13 ASIA PACIFIC PLASTICISED POLYVINYL CHLORIDE (PVC) COMPOUND MARKET: SEGMENTATION
FIGURE 14 ASIA-PACIFIC IS EXPECTED TO DOMINATE THE ASIA PACIFIC PLASTICISED POLYVINYL CHLORIDE (PVC) COMPOUND MARKET AND NORTH AMERICA IS EXPECTED TO GROW WITH THE HIGHEST CAGR IN THE FORECAST PERIOD OF 2022 TO 2029
FIGURE 15 INCREASING DEMAND FOR TUBES AND PROFILES IS EXPECTED TO DRIVE THE ASIA PACIFIC PLASTICISED POLYVINYL CHLORIDE (PVC) COMPOUND MARKET IN THE FORECAST PERIOD OF 2022 TO 2029
FIGURE 16 DRY SEGMENT IS EXPECTED TO ACCOUNT FOR THE LARGEST SHARE OF THE ASIA PACIFIC PLASTICISED POLYVINYL CHLORIDE (PVC) COMPOUND MARKET IN 2022 & 2029
FIGURE 17 ASIA PACIFIC PLASTCISED PVC COMPOND MARKET - SUPPLY CHAIN ANALYSIS
FIGURE 18 IMPORT EXPORT SCENARIO (USD THOUSAND)
FIGURE 19 DRIVERS, RESTRAINTS, OPPORTUNITY AND CHALLENGES OF ASIA PACIFIC PLASTICISED POLYVINYL CHLORIDE (PVC) COMPOUND MARKET
FIGURE 20 ASIA PACIFIC PLASTICISED POLYVINYL CHLORIDE (PVC) COMPOUND MARKET, BY FORM, 2021
FIGURE 21 ASIA PACIFIC PLASTICISED POLYVINYL CHLORIDE (PVC) COMPOUND MARKET, BY MANUFACTURING PROCESS, 2021
FIGURE 22 ASIA PACIFIC PLASTICISED POLYVINYL CHLORIDE (PVC) COMPOUND MARKET, BY APPLICATION, 2021
FIGURE 23 ASIA PACIFIC PLASTICISED POLYVINYL CHLORIDE (PVC) COMPOUND MARKET, BY END USE, 2021
FIGURE 24 ASIA-PACIFIC PLASTICISED POLYVINYL CHLORIDE (PVC) COMPOUND MARKET: SNAPSHOT (2021)
FIGURE 25 ASIA-PACIFIC PLASTICISED POLYVINYL CHLORIDE (PVC) COMPOUND MARKET: BY COUNTRY (2021)
FIGURE 26 ASIA-PACIFIC PLASTICISED POLYVINYL CHLORIDE (PVC) COMPOUND MARKET: BY COUNTRY (2022 & 2029)
FIGURE 27 ASIA-PACIFIC PLASTICISED POLYVINYL CHLORIDE (PVC) COMPOUND MARKET: BY COUNTRY (2021 & 2029)
FIGURE 28 ASIA-PACIFIC PLASTICISED POLYVINYL CHLORIDE (PVC) COMPOUND MARKET: BY FORM (2022 & 2029)
FIGURE 29 ASIA PACIFIC PLASTICISED POLYVINYL CHLORIDE (PVC) COMPOUND MARKET: COMPANY SHARE 2021 (%)
Asia Pacific Plasticized Polyvinyl Chloride Pvc Compound Market, Supply Chain Analysis and Ecosystem Framework
To support market growth and help clients navigate the impact of geopolitical shifts, DBMR has integrated in-depth supply chain analysis into its Asia Pacific Plasticized Polyvinyl Chloride Pvc Compound Market research reports. This addition empowers clients to respond effectively to global changes affecting their industries. The supply chain analysis section includes detailed insights such as Asia Pacific Plasticized Polyvinyl Chloride Pvc Compound Market consumption and production by country, price trend analysis, the impact of tariffs and geopolitical developments, and import and export trends by country and HSN code. It also highlights major suppliers with data on production capacity and company profiles, as well as key importers and exporters. In addition to research, DBMR offers specialized supply chain consulting services backed by over a decade of experience, providing solutions like supplier discovery, supplier risk assessment, price trend analysis, impact evaluation of inflation and trade route changes, and comprehensive market trend analysis.
Data collection and base year analysis are done using data collection modules with large sample sizes. The stage includes obtaining market information or related data through various sources and strategies. It includes examining and planning all the data acquired from the past in advance. It likewise envelops the examination of information inconsistencies seen across different information sources. The market data is analysed and estimated using market statistical and coherent models. Also, market share analysis and key trend analysis are the major success factors in the market report. To know more, please request an analyst call or drop down your inquiry.
The key research methodology used by DBMR research team is data triangulation which involves data mining, analysis of the impact of data variables on the market and primary (industry expert) validation. Data models include Vendor Positioning Grid, Market Time Line Analysis, Market Overview and Guide, Company Positioning Grid, Patent Analysis, Pricing Analysis, Company Market Share Analysis, Standards of Measurement, Global versus Regional and Vendor Share Analysis. To know more about the research methodology, drop in an inquiry to speak to our industry experts.
Data Bridge Market Research is a leader in advanced formative research. We take pride in servicing our existing and new customers with data and analysis that match and suits their goal. The report can be customized to include price trend analysis of target brands understanding the market for additional countries (ask for the list of countries), clinical trial results data, literature review, refurbished market and product base analysis. Market analysis of target competitors can be analyzed from technology-based analysis to market portfolio strategies. We can add as many competitors that you require data about in the format and data style you are looking for. Our team of analysts can also provide you data in crude raw excel files pivot tables (Fact book) or can assist you in creating presentations from the data sets available in the report.


