
Asia Pacific Power Tools Market
Market Size in USD Billion
 USD
10.81 Billion
USD
17.22 Billion
2025
2033
USD
10.81 Billion
USD
17.22 Billion
2025
2033
| 2026 - 2033 | |
| USD 10.81 Billion | |
| USD 17.22 Billion | |
| % | |
|
Asia-Pacific Power Tools Market Overview
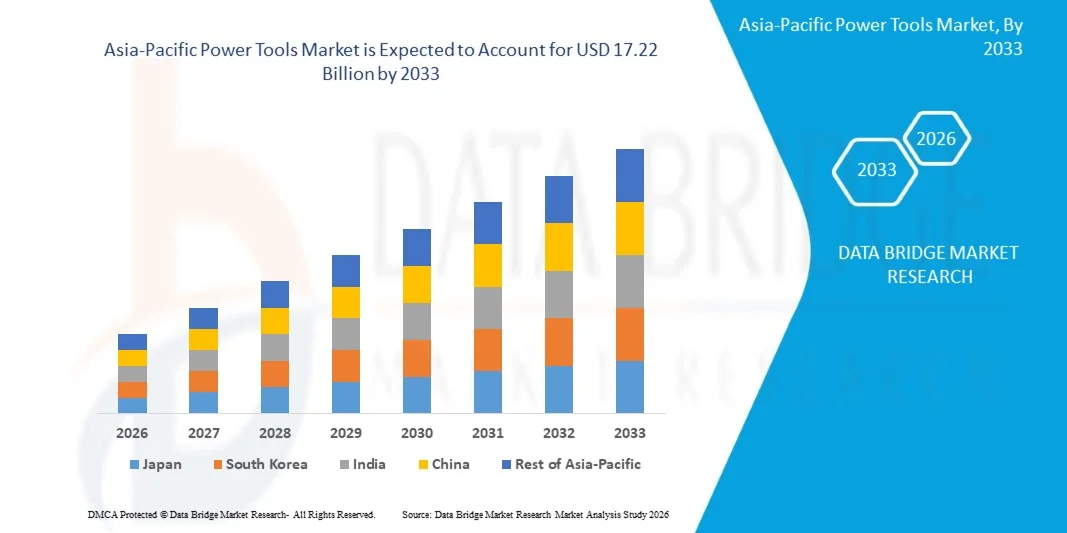
As per Data Bridge Market Research analysis, the Asia-Pacific power tools market was valued at USD 10.81 billion in 2025 and is projected to reach USD 17.22 billion by 2033, growing at a CAGR of 6.00% from 2026 to 2033. The market is experiencing consistent growth driven by rising adoption of power tools across manufacturing, automotive, and construction sectors, increasing infrastructure development activities, and technological advancements such as smart power monitoring, improved tool ergonomics, and app-based live tracking solutions.
The growing demand for cordless power tools, supported by enhanced battery capabilities and increasing adoption of Internet of Things (IoT)-enabled smart tool monitoring systems, is accelerating market expansion across the region. Furthermore, rapid industrialization in South Asia, foreign direct investments, and increasing DIY activities are encouraging the adoption of efficient, portable, and cost-effective power tools. The expanding use of pneumatic and hydraulic tools in heavy-duty applications is also supporting operational efficiency by reducing workload and labor costs across industrial sectors.
Market Size & Forecast
- Global Market Value (2025): USD 10.81 Billion
- Expected Market Value (2033): USD 17.22 Billion
- Forecast CAGR (2026–2033): 6.00%
- Leading Country in 2025: China
- Fastest Growing Country: India
Key Market Trends & Insights
- China dominated the Asia-Pacific power tools market with the largest revenue share of 40.5% in 2025, supported by rapid industrialization, strong manufacturing capabilities, expanding construction activities, and increasing adoption of power tools across automotive, infrastructure, and industrial applications
- The drilling and fastening tools segment led the market with a 35.7% share in 2025, driven by its extensive utilization across construction, automotive, manufacturing, and woodworking applications
- India is expected to be the fastest-growing market during the forecast period, registering a CAGR of 5.6%, fueled by rapid urbanization, government infrastructure development initiatives, expanding construction activities, and increasing adoption of power tools across residential and industrial sectors
- Material removal tools are the fastest-growing type, projected to register a CAGR of 8.5%, reflecting the surge in adoption in automotive, aerospace, metalworking, and manufacturing industries
- The electric power tools segment dominated the mode of operation category with a 60.5% revenue share in 2025, led by increasing adoption across construction, manufacturing, automotive, and residential applications
- Concrete and construction accounted for 40.6% of the market, preferred by increasing infrastructure development, urbanization, and residential and commercial construction activities
- The glass segment is the fastest-growing material category, with a CAGR of 6.8%, driven by increasing construction activities and rising demand for architectural glass applications
Report Scope and Asia-Pacific Power Tools Market Segmentation
|
Attributes |
Asia-Pacific Power Tools Key Market Insights |
|
Segments Covered |
|
|
Countries Covered |
Asia-Pacific
|
|
Key Market Players |
|
|
Market Opportunities |
|
|
Value Added Data Infosets |
In addition to the insights on market scenarios such as market value, growth rate, segmentation, geographical coverage, and major players, the market reports curated by the Data Bridge Market Research also include in-depth expert analysis, geographically represented company-wise production and capacity, network layouts of distributors and partners, detailed and updated price trend analysis and deficit analysis of supply chain and demand. |
Asia-Pacific Power Tools Market Trends
Trend: Rising Adoption of Cordless and Smart Power Tools
The power tools market is witnessing increasing adoption of cordless power tools due to advancements in battery technology, improved portability, and enhanced operational flexibility across construction, manufacturing, and DIY applications. Smart power tools integrated with IoT-based monitoring, app-enabled tracking, and intelligent power management features are gaining traction as industries seek higher productivity, improved safety, and efficient tool management. Professional users and industrial sectors are increasingly shifting toward connected and battery-operated solutions that reduce downtime and improve operational performance. For instance, in July 2024, Makita Corporation introduced new 40V MAX XGT cordless tool kits, expanding its battery-powered tool ecosystem with solutions for drilling, driving, fastening, and cutting applications. This development highlights the continued industry shift toward cordless technology, improved portability, and enhanced productivity in professional power tool applications.
The growing preference for cordless solutions and smart-enabled technologies is expected to accelerate power tool adoption across Asia-Pacific by improving portability, efficiency, and productivity in professional and industrial applications.
Asia-Pacific Power Tools Market Dynamics
Key Market Driver: Expansion of Construction and Industrial Infrastructure Activities
The e rapid growth of construction, manufacturing, automotive, and infrastructure sectors across Asia-Pacific is driving the adoption of power tools for drilling, fastening, cutting, and material handling applications. Increasing urbanization, government infrastructure investments, and industrial expansion are encouraging contractors, manufacturers, and professional users to adopt efficient power tools that improve productivity and reduce manual workload. The rising development of residential, commercial, and industrial projects in emerging economies is further supporting demand for advanced electric and cordless power tools across the region. For instance, in January 2022, Bosch introduced the AdvancedTrimRouter 18V-8 cordless router, expanding its 18V Power for All System with a compact battery-powered tool designed for woodworking applications. The product features an 18V lithium-ion battery system, brushless motor technology, and compatibility with multiple Bosch cordless devices, highlighting the growing demand for cordless power tools with improved portability, flexibility, and battery efficiency. This development supports the market shift toward battery-powered solutions across professional and DIY applications.
Expanding infrastructure development and industrialization across Asia-Pacific will remain key growth factors, increasing the requirement for efficient power tools across construction, manufacturing, and automotive sectors.
Key Restraint/Challenge: High Cost of Advanced Cordless and Smart Power Tools
A significant challenge in the power tools market is the high initial investment associated with advanced cordless, automated, and smart-enabled tools. Modern power tools require advanced battery systems, intelligent control technologies, and durable components, increasing procurement costs for small contractors, individual users, and cost-sensitive markets. In addition, maintenance requirements, battery replacement costs, and technology upgrades can limit adoption among small-scale businesses and emerging economies where affordability remains a key purchasing factor. For instance, in June 2024, Milwaukee Tool introduced its M18 REDLITHIUM FORGE battery platform with advanced battery cell technology, improved construction, and high-performance electronics to deliver longer life and faster charging. However, the advanced battery systems carry a higher cost, with professional-grade M18 REDLITHIUM battery packs priced at more than USD 200 for high-capacity variants, increasing the overall investment required for cordless power tool adoption among cost-sensitive users and small contractors.
The increasing cost of advanced lithium-ion battery platforms and high-performance cordless systems remains a key challenge for wider adoption, particularly among small-scale users seeking affordable power tool solutions
Key Market Opportunity: Integration of IoT and Connected Power Tool Technologies
The integration of IoT-enabled monitoring systems, smart power management, and digital tracking solutions presents a significant growth opportunity for the Asia-Pacific power tools market. Connected power tools enable real-time performance monitoring, improved operational control, predictive maintenance, and enhanced workplace safety across industrial and construction applications. The increasing focus on productivity improvement and digital transformation among manufacturers and professional users is creating opportunities for companies to develop intelligent and connected tool ecosystems. For instance, in June 2025, Bosch Professional promoted its PRO360 digital platform as a connected solution for professional users, enabling Bluetooth-enabled tool settings customization, tool registration, asset management, and inventory tracking. This development highlights the growing opportunity for smart technologies to transform power tool usage through digital connectivity, improved workflow management, and enhanced productivity across professional applications.
The integration of connected technologies is expected to create new growth opportunities by enabling smarter tool management, improving operational efficiency, and supporting the digital transformation of construction and industrial workflows.
Asia-Pacific Power Tools Market Scope
The Asia-Pacific power tools market is segmented on the basis of type, mode of operation, application, material, end user, and sales channel.
- By Type
On the basis of type, the Asia-Pacific power tools market is segmented into sawing and cutting tools, drilling and fastening tools, demolition tools, routing tools, portable nibblers, air-powered tools, material removal tools, electric cords and plugs, accessories, and others. The drilling and fastening tools segment dominated the market with 35.7% share in 2025, owing to its extensive utilization across construction, automotive, manufacturing, and woodworking applications. These tools are widely preferred due to their versatility, ease of operation, and ability to perform essential fastening and installation activities across multiple industries. Increasing infrastructure development projects in China, India, and Southeast Asian countries are creating strong demand for drilling equipment. The adoption of cordless drills and impact drivers with advanced lithium-ion batteries is improving portability and operational efficiency. The broad application range of drilling and fastening tools continues to make this the leading product category in the Asia-Pacific power tools market.
The material removal tools segment is projected to witness the fastest growth at 8.5% CAGR during forecast period, driven by increasing adoption in automotive, aerospace, metalworking, and manufacturing industries. These tools are gaining importance due to rising demand for precision finishing, surface treatment, and efficient material processing operations. Growing industrial automation and manufacturing modernization are increasing the requirement for advanced grinding, polishing, and finishing tools. The expansion of automotive production facilities across Asia-Pacific is further supporting demand for high-performance material removal equipment. The growing need for precision manufacturing is expected to accelerate the adoption of material removal tools during the forecast period.
- By Mode of Operation
On the basis of mode of operation, the Asia-Pacific power tools market is segmented into electric, liquid fuel tools, hydraulic, pneumatic, and powder-actuated tools. The electric power tools segment dominated the market with 60.5% share in 2025, supported by increasing adoption across construction, manufacturing, automotive, and residential applications. Electric tools are preferred due to their operational efficiency, lower maintenance requirements, ease of availability, and suitability for a wide range of applications. The increasing popularity of cordless electric tools equipped with lithium-ion batteries is further improving user convenience and mobility. Advancements in brushless motors, battery technology, and smart power management systems are enhancing product performance. The widespread availability of electric power tools through retail and online channels continues to support segment dominance.
The pneumatic power tools segment is expected to register significant growth at 7.8% CAGR during forecast period, driven by increasing demand from industrial manufacturing, automotive assembly, and heavy-duty applications. Pneumatic tools are widely used due to their high durability, reliability, and ability to deliver consistent performance in demanding environments. Growing adoption in production facilities and automated manufacturing systems is supporting segment expansion. These tools provide advantages such as lower heat generation and suitability for continuous industrial operations. Rising manufacturing investments across China, India, Japan, and Southeast Asia are increasing demand for pneumatic solutions. The need for efficient industrial equipment is expected to support continued growth of pneumatic power tools.
- By Application
On the basis of application, the Asia-Pacific power tools market is segmented into concrete and construction, woodworking, metalworking, welding, and others. The concrete and construction segment dominated the market with 40.6% share in 2025, driven by increasing infrastructure development, urbanization, and residential and commercial construction activities across Asia-Pacific. Power tools are extensively used in drilling, cutting, demolition, and fastening operations required in construction projects. Government investments in transportation infrastructure, smart cities, and housing projects are increasing demand for construction-related tools. The rapid expansion of construction activities in China and India is creating significant opportunities for power tool manufacturers. Contractors are adopting advanced tools to improve productivity, reduce project completion time, and minimize manual labor. The continuous growth of infrastructure projects is expected to maintain the dominance of this segment.
The residential/DIY application segment is expected to grow at 9.2% CAGR during forecast period, supported by increasing home improvement activities, rising disposable income, and growing consumer interest in DIY projects. The availability of compact and lightweight cordless tools is encouraging residential users to adopt power tools for repair, renovation, and maintenance activities. Expansion of online retail platforms is improving consumer access to branded power tools. Manufacturers are increasingly introducing user-friendly products designed for non-professional users. Urbanization and changing lifestyles are supporting increased adoption of home improvement tools. Growing awareness regarding DIY activities is expected to accelerate residential demand across Asia-Pacific.
- By Material
On the basis of material, the Asia-Pacific power tools market is segmented into concrete, wood/metal, brick/block, glass, and others. The wood/metal segment dominated the market with 35.0% share in 2025, supported by extensive usage across woodworking, automotive repair, metal fabrication, and manufacturing applications. Power tools used for wood and metal processing are essential for drilling, cutting, grinding, and fastening operations. Increasing furniture production, industrial manufacturing, and automotive component production are supporting demand for these tools. Professional users require durable and precise equipment to improve productivity and reduce processing time. The adoption of advanced cordless solutions is further improving flexibility in wood and metal applications. The broad industrial application base continues to support the leading position of this segment.
The glass segment is expected to witness steady growth at 6.8% CAGR during forecast period, driven by increasing construction activities and rising demand for architectural glass applications. Modern commercial buildings and infrastructure projects are increasingly incorporating glass materials, creating demand for specialized cutting and finishing tools. Advanced glass processing requires precision equipment to improve accuracy and reduce material damage. Growing investments in commercial construction and interior design projects are supporting adoption. Technological improvements in glass cutting tools are enhancing operational efficiency. Increasing use of glass in modern infrastructure is expected to create additional growth opportunities for specialized power tools.
- By End User
On the basis of end user, the Asia-Pacific power tools market is segmented into industrial/professional and residential. The industrial/professional segment dominated the market 70.5% share in 2025, supported by extensive usage across construction, automotive, manufacturing, aerospace, and energy sectors. Professional users require high-performance tools capable of handling heavy-duty operations and improving workplace productivity. Increasing industrialization and manufacturing expansion across Asia-Pacific are strengthening demand from professional applications. Companies are adopting advanced electric and cordless tools to improve efficiency and reduce operational downtime. Infrastructure development projects are further increasing demand among contractors and industrial operators. The requirement for durable and reliable equipment continues to make industrial users the largest consumer group.
The residential segment is expected to register faster growth at 9% CAGR during forecast period, driven by increasing DIY activities, home renovation projects, and rising availability of affordable cordless tools. Consumers are increasingly adopting compact power tools for household maintenance and repair activities. Growth of e-commerce platforms is improving accessibility to residential power tool products. Manufacturers are introducing lightweight and easy-to-use solutions targeting household users. Increasing urbanization and improving living standards are supporting home improvement activities. The growing DIY culture across Asia-Pacific is expected to further accelerate residential adoption.
- By Sales Channel
On the basis of sales channel, the Asia-Pacific power tools market is segmented into indirect sales and direct sales. The indirect sales segment dominated the market with 65.0% share in 2025, owing to the strong presence of distributors, dealers, retailers, and online marketplaces across the region. Professional and residential customers often prefer indirect channels due to product availability, technical assistance, and after-sales support. Major power tool manufacturers rely on extensive dealer networks to reach diverse customer groups. The growth of e-commerce platforms is further strengthening indirect distribution channels. Easy availability of branded products through multiple retail channels is improving market penetration. The convenience and accessibility offered by indirect sales continue to support segment dominance.
The direct sales segment is expected to grow at a7.9% CAGR during forecast period, supported by increasing demand from large industrial customers requiring customized solutions and technical support. Manufacturers are increasingly building direct relationships with construction companies, automotive manufacturers, and industrial clients. Direct sales enable companies to provide specialized products, maintenance services, and customer-specific solutions. Digital transformation is allowing manufacturers to improve direct customer engagement. Increasing demand for advanced industrial power tools is supporting direct procurement models. The expansion of large-scale industrial projects across Asia-Pacific is expected to create further opportunities for direct sales growth.
Asia-Pacific Power Tools Market Regional Analysis
China dominated the Asia-Pacific power tools market with the largest revenue share of 40.5% in 2025, supported by rapid industrialization, strong manufacturing capabilities, expanding construction activities, and increasing adoption of power tools across automotive, infrastructure, and industrial applications. The country benefits from a well-established manufacturing ecosystem, rising adoption of electric and cordless power tools, and continuous advancements in smart tool technologies such as power monitoring and tool tracking systems. Growing investments in infrastructure projects, automotive production, and industrial automation are accelerating market development. Increasing focus on improving productivity, reducing manual labor requirements, and enhancing operational efficiency continues to strengthen China’s leading position in the Asia-Pacific power tools market.
India Power Tools Market Insight
The India power tools market is experiencing rapid growth, supported by increasing infrastructure development, expanding manufacturing activities, and rising demand for efficient tools across construction, automotive, and industrial applications. The country’s growing urbanization, government-led infrastructure initiatives, and increasing adoption of cordless power tools are strengthening market expansion. Furthermore, rising investments in residential and commercial construction projects and the growth of small and medium enterprises are creating significant demand for portable and cost-effective power tool solutions. In April 2025, NITI Aayog released the report “Unlocking USD 25+ Billion Export Potential – India’s Hand & Power Tools Sector,” highlighting that India’s power tools industry is supported by growing demand from key sectors such as construction, automotive, electronics, and infrastructure. The report identifies India’s expanding manufacturing base and infrastructure development as major factors creating growth opportunities for hand and power tool adoption
Japan Power Tools Market Insight
The Japan power tools market is expanding steadily due to the country’s advanced manufacturing sector, strong automotive industry, and increasing adoption of technologically advanced power tools. Manufacturers and professional users are increasingly utilizing cordless tools, precision equipment, and smart power solutions to improve productivity and operational efficiency. The country’s focus on automation, robotics, and high-quality manufacturing processes continues to support demand across industrial applications. Makita Corporation, a leading Japanese power tool manufacturer, continues to expand its 40V MAX XGT cordless tool ecosystem, including high-performance battery-powered tools designed for professional construction and industrial applications.
South Korea Power Tools Market Insight
The South Korea power tools market is growing due to increasing demand from automotive manufacturing, electronics production, construction, and industrial sectors. The country’s advanced manufacturing infrastructure and focus on automation are supporting the adoption of efficient and technologically advanced power tools. Rising investments in smart factories and industrial modernization are encouraging the use of connected and high-performance tools. Hyundai Motor Group expanded its smart manufacturing capabilities through the adoption of advanced automation and digital technologies across its production facilities in South Korea. The growth of automotive manufacturing and industrial automation is increasing demand for precision equipment and professional power tools used in assembly, maintenance, and production operations. This development highlights the role of South Korea’s advanced manufacturing ecosystem in supporting power tool adoption across industrial applications.
Vietnam Power Tools Market Insight
The Vietnam power tools market is witnessing rapid growth due to increasing manufacturing investments, expanding construction activities, and rising demand from industrial and professional users. The country’s growing role as a manufacturing hub, supported by foreign direct investment and industrial expansion, is driving demand for drilling, cutting, fastening, and material processing tools across factories and construction sites. In addition, increasing infrastructure development, urbanization, and adoption of cordless and advanced power tools are accelerating market expansion among contractors and industrial users. Vietnam’s Ministry of Planning and Investment reported that the processing and manufacturing sector attracted USD 25.58 billion in foreign direct investment (FDI) in 2024, accounting for 66.9% of total registered FDI. The strong inflow into manufacturing activities, including electronics, machinery, and industrial production, is supporting factory expansion and increasing demand for industrial power tools used in installation, maintenance, assembly, and production operations.
Asia-Pacific Power Tools Market Share
The Asia-Pacific Power Tools industry is primarily led by well-established companies, including:
- Makita Corporation (Japan)
- Koki Holdings Co., Ltd. (Japan)
- Techtronic Industries Co. Ltd. (Hong Kong)
- Robert Bosch GmbH (Germany)
- Stanley Black & Decker, Inc. (U.S.)
- Hilti Aktiengesellschaft (Liechtenstein)
- Snap-on Incorporated (U.S.)
- Ingersoll Rand (U.S.)
- Atlas Copco Group (Sweden)
- Husqvarna Group. (Sweden)
- Festool GmbH (Germany)
- Panasonic Holdings Corporation (Japan)
- Emerson Electric Co. (U.S.)
- Fortive (U.S.)
- Alfred Kärcher SE & Co. KG (Germany)
- Jiangsu Dongcheng Power Tools Co., Ltd. (China)
- Positec Tool Corporation (China)
- CHERVON (China) Trading Co., Ltd (China)
- YAMABIKO Corporation (Japan)
Latest Developments in Asia-Pacific Power Tools Market
- In October 2025, Bosch Power Tools expanded its 18V cordless and corded lineup with new products including a 23-gauge brushless pin nailer, compact reciprocating saw, and high-torque right-angle drill. The product expansion focused on improving precision, reducing user fatigue, and increasing productivity for demanding professional applications, demonstrating the continued development of advanced power tool solutions
- In June 2025, Bosch Power Tools announced new additions to its 18V cordless and accessory portfolio, including brushless staplers, hammer drills, and X-LOCK grinding and cutting accessories. These products were developed to improve power, versatility, and efficiency across jobsite applications, reflecting the continued shift toward advanced cordless systems in professional construction and industrial markets
- In May 2025, Makita Corporation announced the launch of its 40V max XGT 16-5/16" Circular Saw (GSH06), the world’s largest cordless circular saw, designed to provide larger cutting capacity and faster cutting speeds for professional users. The new cordless saw is powered by Makita’s 40V max XGT battery platform, which is compatible with more than 170 XGT® products, highlighting the company’s continued focus on high-performance cordless solutions for construction and industrial applications
- In October 2024, Bosch Power Tools introduced more than 30 new tools, expanding its 18V cordless platform with products including cordless palm routers, angle grinders, leveling lasers, and press tool kits. The launch incorporated brushless motor technology, ergonomic designs, and jobsite-focused solutions, supporting the growing demand for efficient and versatile cordless power tools among professional users
- In April 2024, DEWALT, a Stanley Black & Decker brand, announced the expansion of its electrical trade product portfolio with new cordless and brushless power tools, including the 20V MAX XR Brushless Cordless Mid-Size Bandsaw and 20V MAX XR Brushless Cordless Dual-Trigger Bandsaw. The newly introduced tools were designed to improve productivity, safety, and workflow efficiency for professional tradespeople, reflecting the increasing demand for advanced cordless power solutions across construction and industrial applications
SKU-

- Interactive Data Analysis Dashboard
- Company Analysis Dashboard for high growth potential opportunities
- Research Analyst Access for customization & queries
- Competitor Analysis with Interactive dashboard
- Latest News, Updates & Trend analysis
- Harness the Power of Benchmark Analysis for Comprehensive Competitor Tracking
Asia Pacific Power Tools Market, Supply Chain Analysis and Ecosystem Framework
To support market growth and help clients navigate the impact of geopolitical shifts, DBMR has integrated in-depth supply chain analysis into its Asia Pacific Power Tools Market research reports. This addition empowers clients to respond effectively to global changes affecting their industries. The supply chain analysis section includes detailed insights such as Asia Pacific Power Tools Market consumption and production by country, price trend analysis, the impact of tariffs and geopolitical developments, and import and export trends by country and HSN code. It also highlights major suppliers with data on production capacity and company profiles, as well as key importers and exporters. In addition to research, DBMR offers specialized supply chain consulting services backed by over a decade of experience, providing solutions like supplier discovery, supplier risk assessment, price trend analysis, impact evaluation of inflation and trade route changes, and comprehensive market trend analysis.
Data collection and base year analysis are done using data collection modules with large sample sizes. The stage includes obtaining market information or related data through various sources and strategies. It includes examining and planning all the data acquired from the past in advance. It likewise envelops the examination of information inconsistencies seen across different information sources. The market data is analysed and estimated using market statistical and coherent models. Also, market share analysis and key trend analysis are the major success factors in the market report. To know more, please request an analyst call or drop down your inquiry.
The key research methodology used by DBMR research team is data triangulation which involves data mining, analysis of the impact of data variables on the market and primary (industry expert) validation. Data models include Vendor Positioning Grid, Market Time Line Analysis, Market Overview and Guide, Company Positioning Grid, Patent Analysis, Pricing Analysis, Company Market Share Analysis, Standards of Measurement, Global versus Regional and Vendor Share Analysis. To know more about the research methodology, drop in an inquiry to speak to our industry experts.
Data Bridge Market Research is a leader in advanced formative research. We take pride in servicing our existing and new customers with data and analysis that match and suits their goal. The report can be customized to include price trend analysis of target brands understanding the market for additional countries (ask for the list of countries), clinical trial results data, literature review, refurbished market and product base analysis. Market analysis of target competitors can be analyzed from technology-based analysis to market portfolio strategies. We can add as many competitors that you require data about in the format and data style you are looking for. Our team of analysts can also provide you data in crude raw excel files pivot tables (Fact book) or can assist you in creating presentations from the data sets available in the report.


