
Asia Pacific Proton Therapy Market
Market Size in USD Billion
 USD
555.41 Billion
USD
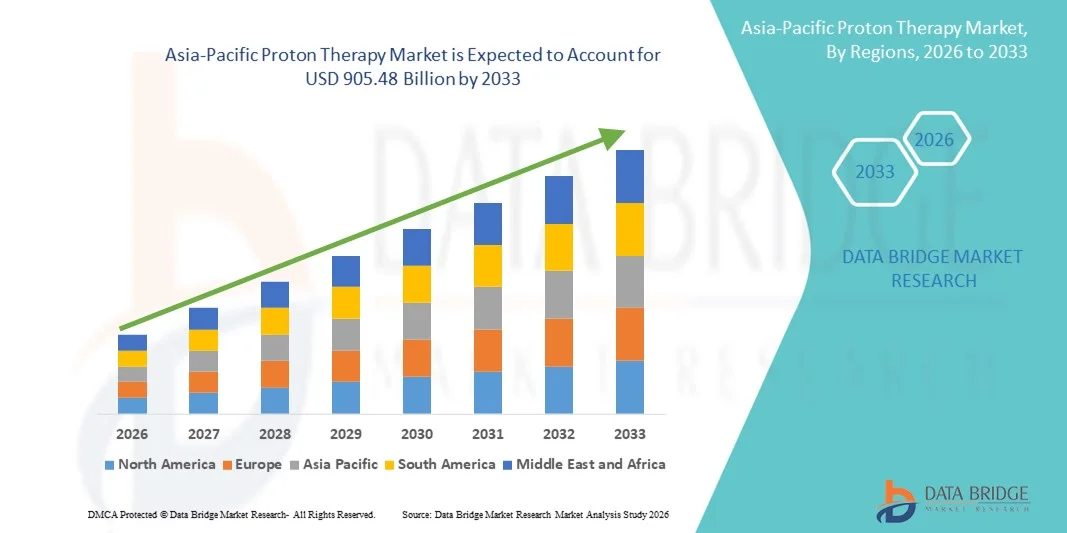
905.48 Billion
2025
2033
USD
555.41 Billion
USD
905.48 Billion
2025
2033
| 2026 - 2033 | |
| USD 555.41 Billion | |
| USD 905.48 Billion | |
| % | |
|
What is the Asia-Pacific Proton Therapy Market Size and Growth Rate?
- As per Data Bridge Market Research Analysis the Asia-Pacific proton therapy market size was valued at USD 555.41 billion in 2025 and is expected to reach USD 905.48 billion by 2033, at a CAGR of 6.30% during the forecast period
- The market growth is largely fueled by the rising prevalence of cancer worldwide, coupled with increasing awareness of the clinical benefits of proton therapy, such as high precision tumor targeting and reduced radiation exposure to surrounding healthy tissues. Continuous technological advancements in proton beam delivery systems and treatment planning software are further supporting the adoption of proton therapy across advanced oncology centers
- Furthermore, growing demand for advanced, patient-centric cancer treatment options, along with increasing investments by hospitals, research institutes, and governments in state-of-the-art radiation oncology infrastructure, is positioning proton therapy as a preferred solution for complex and pediatric cancer cases. These converging factors are accelerating the uptake of proton therapy solutions, thereby significantly boosting the market’s overall growth
Market Size & Forecast
- Global Market Value (2025): USD 555.41 billion
- Expected Market Value (2033):USD 905.48 billion
- Forecast CAGR (2026–2033): 6.30%
Asia-Pacific Proton Therapy Market Analysis
- Proton therapy, an advanced form of radiation therapy that uses proton beams to precisely target cancerous tumors, is increasingly becoming a vital component of modern oncology treatment due to its ability to minimize damage to surrounding healthy tissues, making it especially suitable for pediatric and complex cancer cases
- The escalating demand for proton therapy is primarily fueled by the rising global cancer burden, growing preference for precision-based and patient-centric treatment approaches, and continuous technological advancements in proton beam delivery systems and treatment planning software
- China dominated the proton therapy market with the largest revenue share of 38.6% in 2025, supported by rapid expansion of advanced oncology infrastructure, strong government investment in high-end medical technologies, rising cancer prevalence, and increasing installation of proton therapy centers across major public and private hospitals
- India is expected to be the fastest-growing country in the proton therapy market during the forecast period, driven by increasing healthcare expenditure, growing awareness of advanced radiation therapies, expansion of tertiary care cancer hospitals, rising medical tourism, and government initiatives to improve access to advanced cancer treatment technologies
- The Treatment Applications segment accounted for the largest market revenue share of 82.3% in 2025, driven by rising cancer incidence across
Report Scope and Proton Therapy Market Segmentation
|
Attributes |
Proton Therapy Key Market Insights |
|
Segments Covered |
|
|
Countries Covered |
Asia-Pacific
|
|
Key Market Players |
• Ion Beam Applications (Belgium) |
|
Market Opportunities |
|
|
Value Added Data Infosets |
In addition to the insights on market scenarios such as market value, growth rate, segmentation, geographical coverage, and major players, the market reports curated by the Data Bridge Market Research also include in-depth expert analysis, patient epidemiology, pipeline analysis, pricing analysis, and regulatory framework. |
What is the Key Trend in the Asia-Pacific Proton Therapy Market?
Advancements in Precision Treatment and Technology Integration
- A significant and accelerating trend in the global proton therapy market is the continuous advancement in treatment precision through technological innovation and improved system integration. Modern proton therapy systems are increasingly incorporating advanced imaging, treatment planning software, and motion management technologies to enhance clinical accuracy and patient outcomes
- For instance, the integration of pencil beam scanning (PBS) and intensity-modulated proton therapy (IMPT) allows clinicians to deliver highly targeted radiation doses that conform closely to tumor shapes while minimizing exposure to surrounding healthy tissues. These advancements are particularly beneficial in treating pediatric cancers and tumors located near critical organs
- Ongoing improvements in imaging guidance, such as real-time imaging and adaptive therapy solutions, enable clinicians to adjust treatment delivery based on patient movement or anatomical changes during therapy sessions. This enhances treatment effectiveness and reduces the risk of complications
- Furthermore, system miniaturization and modular proton therapy solutions are gaining traction, enabling more healthcare facilities to adopt proton therapy without the need for large, costly infrastructure. Compact systems improve accessibility and broaden the potential patient base
- The integration of proton therapy systems with hospital information systems and oncology workflows supports streamlined treatment planning, data management, and interdisciplinary collaboration, contributing to operational efficiency
- This trend toward more precise, efficient, and technologically advanced proton therapy solutions is reshaping expectations in radiation oncology and reinforcing proton therapy’s role as a next-generation cancer treatment modality
- As a result, the demand for advanced proton therapy systems continues to grow across academic hospitals, cancer research centers, and specialized oncology clinics worldwide
Asia-Pacific Proton Therapy Market Dynamics
Driver
Rising Cancer Incidence and Growing Demand for Advanced Radiation Therapies
- The increasing global burden of cancer, coupled with the growing need for advanced and targeted radiation therapies, is a major driver of the Proton Therapy market. Rising incidence rates of complex cancers, including brain, spinal, and pediatric tumors, are fueling demand for treatment options that minimize long-term side effects
- For instance, in March 2025, several leading oncology centers across Asia-Pacific and Asia announced investments in new proton therapy facilities to expand their cancer treatment capabilities and meet rising patient demand. Such initiatives by healthcare providers are expected to drive market growth during the forecast period
- Proton therapy’s ability to deliver precise radiation doses while sparing surrounding healthy tissue makes it an attractive alternative to conventional photon-based radiotherapy, particularly for vulnerable patient populations
- In addition, increasing awareness among clinicians and patients regarding the clinical benefits of proton therapy is accelerating its adoption in both developed and emerging healthcare markets
- Government support, favorable reimbursement policies in select countries, and growing investments in oncology infrastructure are further supporting the expansion of proton therapy centers globally
Restraint/Challenge
High Capital Investment and Limited Accessibility
- The high capital and operational costs associated with proton therapy systems present a significant challenge to widespread market adoption. Establishing a proton therapy center requires substantial investment in equipment, facility construction, and specialized personnel, limiting accessibility primarily to large hospitals and advanced cancer centers
- For instance, the cost of building and maintaining a multi-room proton therapy facility can be significantly higher than conventional radiotherapy setups, which can deter smaller healthcare institutions from adopting the technology
- In addition, limited availability of trained professionals and the complexity of system operation can further constrain market growth, particularly in low- and middle-income regions
- While technological advancements are gradually reducing system size and cost, proton therapy remains a premium treatment option, restricting patient access in regions with limited healthcare funding
- Addressing these challenges through the development of cost-effective compact systems, expanded training programs, and supportive reimbursement frameworks will be critical for improving accessibility and sustaining long-term growth in the proton therapy market
Asia-Pacific Proton Therapy Market Scope
The market is segmented on the basis of product type, component, type, set-up systems, application type, and end user.
- By Product Type
On the basis of product type, the Asia-Pacific Proton Therapy market is segmented into Systems, Software, and Services. The Systems segment dominated the largest market revenue share of 62.8% in 2025, primarily due to the high cost and critical importance of proton therapy systems in clinical operations. These systems form the backbone of proton therapy centers and include integrated hardware for beam generation, delivery, and control. European countries are increasingly investing in advanced cancer treatment infrastructure, supporting system installations. Hospitals prefer complete system solutions to ensure high treatment precision and patient safety. The long lifespan of proton therapy systems further contributes to their revenue dominance. Growing cancer prevalence and favorable reimbursement frameworks in parts of Asia-Pacific also support system adoption. In addition, technological advancements aimed at compact and efficient systems are expanding their applicability. As a result, systems continue to generate the highest revenue within the product type segment.
The Services segment is expected to witness the fastest CAGR of 14.9% from 2026 to 2033, driven by the expanding installed base of proton therapy systems across Europe. Services include installation support, maintenance, upgrades, training, and technical consulting, which are essential for uninterrupted operations. As proton therapy centers mature, demand for long-term service contracts increases significantly. Regulatory compliance and system optimization further boost service requirements. Hospitals increasingly outsource technical services to reduce operational complexity. The need for continuous calibration and software updates also contributes to service growth. These factors collectively accelerate the rapid expansion of the services segment.
- By Component
On the basis of component, the Asia-Pacific Proton Therapy market is segmented into Proton Accelerator, Beam Transport System, Beam Delivery System, Nozzle, Image Viewers, and Patient Positioning System (PPS). The Proton Accelerator segment dominated the market with a revenue share of 38.4% in 2025, owing to its role as the most complex and expensive component in proton therapy systems. Accelerators are responsible for generating high-energy proton beams required for precise cancer treatment. Their advanced engineering and customization significantly increase system costs. Continuous innovation to improve energy efficiency and reduce size supports market dominance. Large-scale hospital installations further favor advanced accelerator systems. Government funding for high-end oncology equipment also strengthens this segment. High replacement and upgrade costs add to revenue share stability.
The Patient Positioning System (PPS) segment is projected to grow at the fastest CAGR of 16.1% from 2026 to 2033, driven by rising demand for treatment accuracy and patient safety. PPS plays a crucial role in ensuring precise tumor targeting and repeatable patient alignment. Advances in imaging integration and robotic positioning enhance clinical outcomes. Increasing focus on minimizing radiation exposure to healthy tissues boosts PPS adoption. Growing patient volumes require faster and more accurate positioning systems. Hospitals are increasingly investing in advanced PPS solutions to improve workflow efficiency. These factors collectively drive rapid growth in this segment.
- By Type
On the basis of type, the Asia-Pacific Proton Therapy market is segmented into Rotating Proton Therapy Systems and Non-Rotating Proton Therapy Systems. The Rotating Proton Therapy Systems segment held the largest market revenue share of 71.6% in 2025, due to its superior flexibility in beam delivery. These systems allow proton beams to be delivered from multiple angles, improving dose conformity and treatment precision. They are widely preferred in complex cancer cases such as brain and head-and-neck tumors. Large oncology centers favor rotating systems for their clinical versatility. Higher patient throughput further strengthens their dominance. Strong clinical evidence supporting better outcomes also drives adoption. Despite higher installation costs, demand remains strong across Europe.
The Non-Rotating Proton Therapy Systems segment is expected to register the fastest CAGR of 13.4% from 2026 to 2033, supported by cost efficiency and compact design. These systems are suitable for facilities with limited space and budgets. Technological improvements have enhanced their treatment accuracy and reliability. Mid-sized hospitals are increasingly adopting non-rotating systems. Shorter installation timelines and reduced infrastructure requirements further boost demand. Government initiatives supporting decentralized cancer care favor these systems. As accessibility improves, adoption is expected to accelerate rapidly.
- By Set-Up Systems
On the basis of set-up systems, the Asia-Pacific Proton Therapy market is segmented into Multi-Room Systems and Compact/Single-Room Systems. The Multi-Room Systems segment dominated the market with a revenue share of 58.9% in 2025, driven by their efficiency in high-volume cancer centers. These systems allow multiple treatment rooms to operate using a single accelerator, reducing per-patient treatment costs. Large hospitals benefit from higher patient throughput and optimized resource utilization. Multi-room systems are commonly adopted in national cancer institutes. Their ability to support multiple treatment modalities enhances clinical flexibility. Strong government and institutional funding further supports adoption. These factors maintain their dominant position.
The Compact/Single-Room Systems segment is anticipated to grow at the fastest CAGR of 17.2% from 2026 to 2033, fueled by increasing adoption among regional hospitals. Lower capital investment makes these systems more accessible. Compact designs reduce space requirements significantly. Faster installation timelines support quicker operational readiness. Growing demand for localized cancer treatment centers boosts adoption. Technological advances have improved performance comparable to multi-room systems. These benefits collectively drive strong growth.
- By Application Type
On the basis of application type, the Asia-Pacific Proton Therapy market is segmented into Treatment Applications and Research Applications. The Treatment Applications segment accounted for the largest market revenue share of 82.3% in 2025, driven by rising cancer incidence across Europe. Proton therapy is increasingly used for pediatric cancers due to reduced side effects. High demand for precise and targeted radiation therapy supports this segment. Hospitals prioritize treatment applications for revenue generation. Expanding clinical indications further strengthen dominance. Favorable reimbursement in selected countries accelerates adoption. Growing patient awareness also contributes to market leadership.
The Research Applications segment is expected to witness the fastest CAGR of 12.6% from 2026 to 2033, driven by increased clinical trials and innovation efforts. Research institutions focus on improving treatment protocols and expanding indications. Government and academic funding supports proton therapy research. Technological advancements require continuous validation through research. Collaboration between hospitals and research institutes boosts growth. Increasing focus on personalized cancer therapy also contributes. These factors accelerate expansion of research applications.
- By End User
On the basis of end user, the Asia-Pacific Proton Therapy market is segmented into Hospitals, Ambulatory Surgical Centers, and Cancer Research Institutes. The Hospitals segment dominated the market with a revenue share of 69.4% in 2025, due to strong infrastructure and financial capacity. Hospitals manage high patient volumes and offer comprehensive oncology services. Availability of skilled professionals supports system adoption. Hospitals also benefit from government funding and reimbursement frameworks. Integrated cancer care models favor hospital-based proton therapy. Long-term patient management further strengthens dominance. These factors ensure hospitals remain the primary end users.
The Cancer Research Institutes segment is projected to grow at the fastest CAGR of 15.3% from 2026 to 2033, driven by increased investment in advanced cancer research. These institutes play a critical role in clinical innovation. Collaborations with technology providers boost adoption. Growing focus on precision medicine supports demand. Expansion of academic research programs further accelerates growth. Rising government and private funding strengthens infrastructure. As research activity expands, this segment will witness rapid growth.
Asia-Pacific Proton Therapy Market Regional Analysis
- The Asia-Pacific Proton Therapy market is projected to expand at a robust CAGR throughout the forecast period, driven by the rising incidence of cancer, increasing demand for highly precise radiation therapies, and strong government initiatives supporting the development of advanced oncology infrastructure across the region
- Growing awareness of the clinical advantages of proton therapy—such as reduced radiation exposure to surrounding healthy tissues and improved treatment outcomes for pediatric and complex cancer cases—is accelerating adoption across Asia-Pacific
- In addition, increasing healthcare expenditure, favorable reimbursement scenarios in select countries, continuous technological advancements, and rising investments in specialized cancer treatment centers are further supporting market growth. The region is witnessing expanding utilization of proton therapy across major hospitals, academic research institutions, and dedicated oncology centers
China Proton Therapy Market Insight
The China proton therapy market dominated the Asia-Pacific region with the largest revenue share of 38.6% in 2025, supported by rapid expansion of advanced oncology infrastructure, strong government investments in high-end medical technologies, and rising cancer prevalence. The increasing installation of proton therapy centers across major public and private hospitals, along with China’s focus on strengthening domestic healthcare capabilities, is significantly driving market growth. Furthermore, national healthcare reforms and long-term cancer control strategies are accelerating the adoption of proton-based therapies, positioning China as the leading contributor to regional market revenue.
India Proton Therapy Market Insight
The India proton therapy market is expected to register the fastest growth during the forecast period, driven by rising healthcare expenditure, growing awareness of advanced radiation treatment options, and the rapid expansion of tertiary care cancer hospitals. Increasing medical tourism, coupled with government initiatives aimed at improving access to advanced cancer treatment technologies, is further fueling demand. Additionally, India’s large patient population, improving oncology infrastructure, and collaborations between hospitals and technology providers are expected to significantly accelerate proton therapy adoption across the country.
Asia-Pacific Proton Therapy Market Share
The Proton Therapy industry is primarily led by well-established companies, including:
• Ion Beam Applications (Belgium)
• Varian Medical Systems (U.S.)
• Hitachi, Ltd. (Japan)
• Mevion Medical Systems (U.S.)
• Sumitomo Heavy Industries, Ltd. (Japan)
• ProNova Solutions (U.S.)
• Advanced Oncotherapy plc (U.K.)
• Mitsubishi Electric Corporation (Japan)
• Canon Medical Systems Corporation (Japan)
• Optivus Proton Therapy, Inc. (U.S.)
• ProTom International (U.S.)
• RaySearch Laboratories AB (Sweden)
• Elekta AB (Sweden)
• Siemens Healthineers AG (Germany)
• Accuray Incorporated (U.S.)
Latest Developments in Asia-Pacific Proton Therapy Market
- In August 2023, the University of Florida Health Proton Therapy Institute completed a $44 million expansion, adding a fifth treatment room and enhancing pencil beam scanning capabilities to treat a broader range of cancers with pinpoint accuracy, increasing its treatment capacity by 25 %. This expansion reflects significant investment in proton therapy infrastructure and improved clinical capabilities
- In October 2024, Ion Beam Applications (IBA) announced the launch of a next-generation superconducting synchrocyclotron designed to enhance efficiency and reduce energy consumption by up to 20 %, featuring advanced imaging for real-time tumor tracking to boost adoption in mid-sized healthcare facilities globally. This innovation represents a key product development aimed at broader clinical deployment of proton systems
- In January 2024, IBA and Sumitomo Heavy Industries entered a strategic partnership to co-develop compact proton therapy systems, accelerating global deployment and advancing the technology’s integration at lower operational thresholds. This partnership is a strategic effort to expand the reach of proton therapy
- In January 2025, RaySearch Laboratories announced a collaboration with ProNova Solutions to deploy its RayStation treatment planning software across ProNova’s proton therapy installations, enhancing clinical workflow efficiency and planning precision for proton treatments. This collaboration focuses on improving software support for proton therapy globally
- In March 2025, Apollo Hospitals partnered with Ion Beam Applications (IBA) to launch the Proteus One Proton Beam Therapy system in India, equipped with DynamicARC technology to deliver precise, personalized cancer treatments and expand access to advanced proton therapy in the Indian oncology market. This development signals growth in emerging markets
- In September 2025, Leo Cancer Care entered a strategic collaboration with Sumitomo Heavy Industries to launch an upright proton therapy configuration, integrating advanced patient positioning with compact cyclotron technology to enhance accessibility and precision. This collaboration demonstrates ongoing innovation in proton system design
- In September 2025, Hitachi High-Tech Corporation and partners announced that a renewed proton therapy system at the University of Tsukuba Hospital in Japan began treatment, featuring spot scanning irradiation and two rotating gantry treatment rooms, marking an important operational milestone for proton therapy facilities. This facility renewal project underscores upgrades in clinical infrastructure
- In February 2025, IBA signed a contract with AIG Hospitals in Hyderabad, India, for the supply of a Proteus ONE compact proton therapy system, including a Quality Assurance package, to expand advanced cancer treatment offerings at the new AIG Oncology Centre. This contract highlights market expansion into South Asia
SKU-

- Interactive Data Analysis Dashboard
- Company Analysis Dashboard for high growth potential opportunities
- Research Analyst Access for customization & queries
- Competitor Analysis with Interactive dashboard
- Latest News, Updates & Trend analysis
- Harness the Power of Benchmark Analysis for Comprehensive Competitor Tracking
Data collection and base year analysis are done using data collection modules with large sample sizes. The stage includes obtaining market information or related data through various sources and strategies. It includes examining and planning all the data acquired from the past in advance. It likewise envelops the examination of information inconsistencies seen across different information sources. The market data is analysed and estimated using market statistical and coherent models. Also, market share analysis and key trend analysis are the major success factors in the market report. To know more, please request an analyst call or drop down your inquiry.
The key research methodology used by DBMR research team is data triangulation which involves data mining, analysis of the impact of data variables on the market and primary (industry expert) validation. Data models include Vendor Positioning Grid, Market Time Line Analysis, Market Overview and Guide, Company Positioning Grid, Patent Analysis, Pricing Analysis, Company Market Share Analysis, Standards of Measurement, Global versus Regional and Vendor Share Analysis. To know more about the research methodology, drop in an inquiry to speak to our industry experts.
Data Bridge Market Research is a leader in advanced formative research. We take pride in servicing our existing and new customers with data and analysis that match and suits their goal. The report can be customized to include price trend analysis of target brands understanding the market for additional countries (ask for the list of countries), clinical trial results data, literature review, refurbished market and product base analysis. Market analysis of target competitors can be analyzed from technology-based analysis to market portfolio strategies. We can add as many competitors that you require data about in the format and data style you are looking for. Our team of analysts can also provide you data in crude raw excel files pivot tables (Fact book) or can assist you in creating presentations from the data sets available in the report.


