
Asia Pacific Q Pcr Reagents Market
Market Size in USD Million
 USD
269.82 Million
USD
481.21 Million
2025
2033
USD
269.82 Million
USD
481.21 Million
2025
2033
| 2026 - 2033 | |
| USD 269.82 Million | |
| USD 481.21 Million | |
| % | |
|
Asia-Pacific q-PCR Reagents Market Overview
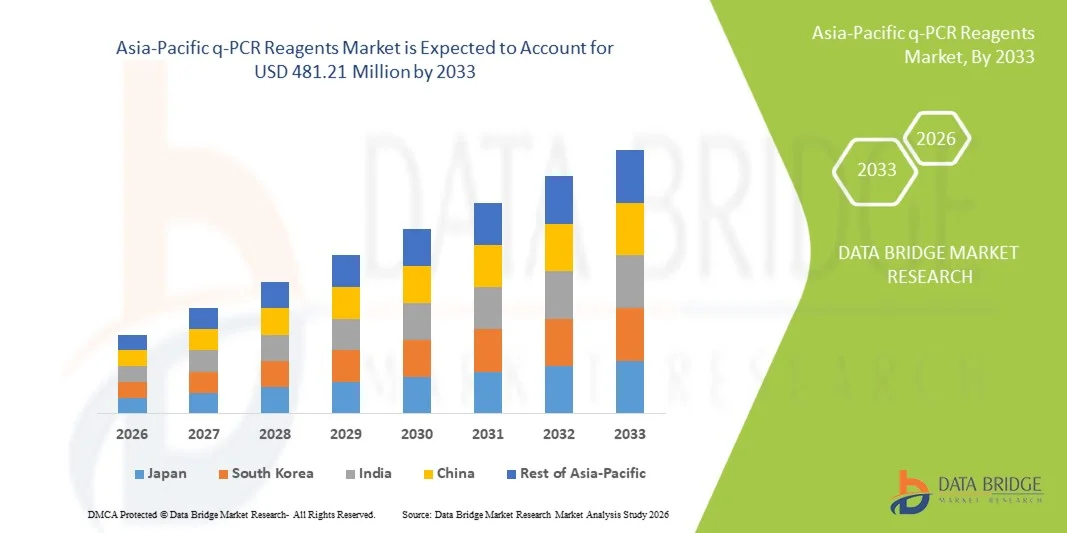
The Asia-Pacific q-PCR reagents market was valued at USD 269.82 million in 2025 and is projected to reach USD 481.21 million by 2033, growing at a CAGR of 7.5% from 2026 to 2033. The market is witnessing steady expansion driven by increasing adoption of molecular diagnostics, rising prevalence of infectious and genetic diseases, and growing investments in life sciences research and clinical laboratory infrastructure across emerging economies in the region.
The expansion of real-time quantitative PCR applications in disease detection, oncology research, and personalized medicine is significantly boosting demand for high-quality reagents such as enzymes, primers, probes, and master mixes. Additionally, government-led healthcare modernization programs, rising awareness of early disease diagnosis, and the growing presence of biotechnology and pharmaceutical companies in countries such as China, India, Japan, and South Korea are further accelerating market growth, while continuous improvements in reagent sensitivity, accuracy, and multiplexing capabilities are enhancing overall diagnostic efficiency.
Key Market Trends & Insights
- China dominated the Asia-Pacific q-PCR reagents market with the largest revenue share of 36.28% in 2025, supported by strong genomics research funding, large-scale infectious disease testing programs, and rapid expansion of molecular diagnostic laboratories.
- The Probe-Based Reagents segment led the market with a 54.63% share in 2025, driven by their high specificity, superior sensitivity, and strong ability to reduce non-specific amplification in complex diagnostic and research applications.
- India is expected to be the fastest-growing country, registering a CAGR of 8.3% from 2026 to 2033, fueled by expanding diagnostic infrastructure, increasing adoption of molecular testing, and growing government healthcare initiatives.
- Dye-Based Reagents are the fastest-growing detection type, projected to register a CAGR of 7.4%, reflecting the surge in demand for lower cost, simplicity of use, and broad applicability in basic research and routine gene expression studies
- The q-PCR Singleplex Test/Assay segment dominated the assay type category with a 57.18% revenue share in 2025, led by high accuracy, simplified workflow, and strong utilization in routine diagnostic testing.
- Low Plexity Systems accounted for 52.41% of the market, preferred by widespread use in routine diagnostics, single-gene analysis, and basic infectious disease detection.
- The Kits segment is the fastest-growing packaging type category, with a CAGR of 7.8%, driven by demand for application-specific and customizable reagent solutions.
Market Size & Forecast
- Global Market Value (2025): USD 269.82 Million
- Expected Market Value (2033): USD 481.21 Million
- Forecast CAGR (2026–2033): 7.5%
- Leading Country in 2025: China
- Fastest Growing Country: India
Report Scope and Asia-Pacific q-PCR Reagents Market Segmentation
|
Attributes |
Asia-Pacific q-PCR Reagents Key Market Insights |
|
Segments Covered |
|
|
Countries Covered |
Asia-Pacific · China · Japan · India · South Korea · Singapore · Malaysia · Australia · Thailand · Indonesia · Philippines · Rest of Asia-Pacific |
|
Key Market Players |
· Thermo Fisher Scientific Inc. (U.S.) · Bio-Rad Laboratories, Inc. (U.S.) · QIAGEN (Netherlands) · Takara Bio Inc. (Japan) · Agilent Technologies, Inc. (U.S.) · F. Hoffmann-La Roche Ltd (Switzerland) · Merck KGaA (Germany) · Promega Corporation (U.S.) · Abbott (U.S.) · BD (U.S.) · Seegene Inc. (South Korea) · Bioneer Corporation (South Korea) · MiRXES Pte Ltd (Singapore) · BioMérieux (France) · New England Biolabs, Inc. (U.S.) · Enzo Biochem, Inc. (U.S.) · Sino Biological Inc. (China) · GeneDireX, Inc. (Taiwan) · Norgen Biotek Corp (Canada) · Takara Holdings Inc. (Japan) |
|
Market Opportunities |
· Expansion of precision oncology programs · Growing adoption of decentralized and point-of-care molecular testing · Increasing investment in veterinary and zoonotic disease surveillance |
|
Value Added Data Infosets |
In addition to the insights on market scenarios such as market value, growth rate, segmentation, geographical coverage, and major players, the market reports curated by the Data Bridge Market Research also include in-depth expert analysis, patient epidemiology, pipeline analysis, pricing analysis, and regulatory framework. |
Asia-Pacific q-PCR Reagents Market Trends
Trend: Expansion of High-Throughput Molecular Diagnostics & Multiplex Testing
Clinical and research laboratories across Asia-Pacific are increasingly adopting high-throughput q-PCR workflows and multiplex assay formats to enable simultaneous detection of multiple pathogens and genetic targets with higher efficiency and accuracy. The integration of automated extraction systems and advanced thermal cyclers is improving turnaround time and reproducibility, while digital PCR compatibility and AI-assisted assay design are enhancing sensitivity and data interpretation across infectious disease, oncology, and genetic screening applications. For instance, hospitals in China and Japan are deploying automated q-PCR platforms for respiratory pathogen panels and cancer mutation profiling to support large-scale diagnostic testing.
Asia-Pacific q-PCR Reagents Market Dynamics
Key Market Driver: Rising Burden of Infectious Diseases and Expansion of Molecular Diagnostics Infrastructure
The increasing prevalence of infectious diseases, coupled with rising demand for early and accurate disease detection, is significantly driving the adoption of q-PCR reagents across hospitals, diagnostic laboratories, and research institutes in Asia-Pacific. Government-led healthcare investments, expansion of genomic surveillance programs, and growing penetration of molecular diagnostic technologies are further strengthening market growth, while pharmaceutical and biotechnology companies are increasingly integrating q-PCR-based assays into clinical research and drug development pipelines. For instance, India and South Korea are expanding national infectious disease monitoring programs using q-PCR-based testing for influenza, tuberculosis, and emerging viral outbreaks.
Key Restraint/Challenge: High Cost of Advanced q-PCR Systems and Reagent Standardization Issues
A major challenge in the Asia-Pacific q-PCR reagents market is the high cost associated with advanced q-PCR instruments, proprietary reagent kits, and continuous consumable requirements, which limits adoption in small and mid-sized laboratories and developing healthcare facilities. Additionally, variability in reagent quality, supply chain dependency on global manufacturers, and lack of standardized protocols across laboratories create inconsistencies in test results and workflow efficiency, further restraining market scalability in cost-sensitive regions. For instance, laboratories in Southeast Asia and rural India often face procurement constraints for high-quality multiplex q-PCR reagent kits due to budget limitations and import dependency.
Key Market Opportunity: Expansion of Personalized Medicine and Point-of-Care Molecular Testing
The growing shift toward personalized medicine and decentralized molecular diagnostics presents a significant opportunity for q-PCR reagent manufacturers in Asia-Pacific, driven by increasing demand for rapid, accurate, and portable diagnostic solutions. Advances in miniaturized q-PCR platforms, cartridge-based testing systems, and cloud-connected diagnostic workflows are enabling wider adoption beyond centralized laboratories, while integration with precision oncology and companion diagnostics is expanding clinical applications. For instance, Australia and Japan are increasingly adopting point-of-care q-PCR systems for rapid cancer biomarker detection and infectious disease screening in outpatient and emergency care settings.
Asia-Pacific q-PCR Reagents Market Scope
The Asia-Pacific q-PCR reagents market is segmented on the basis of detection type, assay type, plexity, packaging type, technology, application, end user, and distribution channel.
- By Detection Type
On the basis of detection type, the Asia-Pacific q-PCR reagents market is segmented into dye-based reagents and probe-based reagents. The Probe-Based Reagents segment dominated the market with a 54.63% share in 2025, owing to their high specificity, superior sensitivity, and strong ability to reduce non-specific amplification in complex diagnostic and research applications. These reagents are widely used in infectious disease diagnostics, oncology testing, and genetic mutation analysis across advanced laboratories. Increasing adoption of multiplex assays and real-time pathogen detection is further strengthening demand for probe-based systems. Their compatibility with automated q-PCR platforms enhances workflow efficiency and reproducibility. Strong regulatory acceptance in clinical diagnostics is also supporting widespread utilization. Continuous improvements in fluorescent probe chemistry are further reinforcing their dominance in high-accuracy testing environments.
The Dye-Based Reagents segment is expected to witness the fastest growth at a CAGR of 7.4% from 2026 to 2033, driven by their lower cost, simplicity of use, and broad applicability in basic research and routine gene expression studies. These reagents are increasingly preferred in academic and mid-sized laboratories due to affordability and minimal assay design complexity. Growing adoption in emerging economies such as India and Southeast Asia is further supporting demand expansion. Technological advancements in dye stability and signal intensity are improving performance reliability. Expanding use in educational institutions and early-stage research is strengthening adoption. Increasing availability through commercial reagent kits is also enhancing market penetration.
- By Assay Type
On the basis of assay type, the market is segmented into q-PCR singleplex test/assay and q-PCR multiplex test/assay. The q-PCR Singleplex Test/Assay segment dominated the market with a 57.18% share in 2025, supported by its high accuracy, simplified workflow, and strong utilization in routine diagnostic testing. These assays are widely used in clinical laboratories for single-target pathogen detection and gene expression analysis. Their standardized protocols reduce variability and improve result reliability. High adoption in hospital-based diagnostics and regulatory-approved testing further supports dominance. Cost-effectiveness and ease of interpretation make them suitable for high-volume testing environments. Continuous demand in infectious disease screening continues to reinforce market leadership.
The q-PCR Multiplex Test/Assay segment is expected to witness the fastest growth at a CAGR of 8.0% from 2026 to 2033, driven by increasing demand for simultaneous detection of multiple pathogens and genetic markers in a single reaction. This capability significantly reduces turnaround time and reagent consumption. Rising outbreaks of complex infectious diseases requiring panel-based diagnostics are boosting adoption. Advancements in probe chemistry and instrument sensitivity are improving multiplex efficiency. Expanding use in oncology and respiratory disease testing is further supporting growth. Increasing adoption in large diagnostic laboratories and genomic research centers is accelerating demand.
- By Plexity
On the basis of plexity, the market is segmented into Singleplex and Multiplex Assays. The Singleplex segment dominated the market with a 52.41% share in 2025, driven by widespread use in routine diagnostics, single-gene analysis, and basic infectious disease detection. These systems are preferred due to simpler workflow design and lower risk of assay interference. They are extensively used in hospital laboratories with standardized testing requirements. Lower cost per test further enhances adoption in cost-sensitive healthcare settings. High reproducibility and ease of validation make them suitable for regulatory-approved diagnostics. Strong demand from emerging economies continues to reinforce segment leadership.
The Multiplex Assays segment is expected to witness the fastest growth at a CAGR of 8.2% from 2026 to 2033, driven by increasing demand for multi-target disease profiling and advanced genomic research. These systems enable simultaneous detection of multiple biomarkers, improving diagnostic efficiency and depth of analysis. Expanding applications in oncology, pharmacogenomics, and infectious disease panels are accelerating adoption. Advancements in reagent chemistry and instrumentation are enhancing signal clarity and accuracy. Growing integration with AI-driven data interpretation tools is further supporting uptake. Increasing use in precision medicine and large-scale clinical studies is driving rapid expansion.
- By Packaging Type
On the basis of packaging type, the market is segmented into kits and master mixes. The Master Mixes segment dominated the market with a 55.69% share in 2025, driven by their convenience, reduced preparation time, and high consistency in reaction performance. These ready-to-use formulations minimize pipetting errors and improve workflow efficiency in clinical and research laboratories. They are widely used in high-throughput diagnostic settings due to their reliability and scalability. Increasing automation in q-PCR workflows is further strengthening adoption. Compatibility with multiple assay types enhances their versatility. Continuous demand for standardized testing protocols is reinforcing segment dominance.
The Kits segment is expected to witness the fastest growth at a CAGR of 7.8% from 2026 to 2033, driven by increasing demand for application-specific and customizable reagent solutions. Kits are widely used in research applications requiring flexibility in assay design. Growing adoption in academic and translational research institutions is supporting expansion. Increasing focus on personalized medicine is boosting demand for specialized kits. Technological advancements enabling better stability and longer shelf life are improving usability. Expanding distribution in emerging markets is further accelerating growth.
- By Technology
On the basis of technology, the market is segmented into gene expression, gene typing, miRNA analysis, pre-amplification, and virus detection. The Virus Detection segment dominated the market with a 43.76% share in 2025, driven by high global demand for infectious disease testing and outbreak surveillance programs. q-PCR remains the gold standard for viral detection due to its high sensitivity and rapid turnaround time. Large-scale testing initiatives across hospitals and public health laboratories strongly support this segment. Continuous monitoring of respiratory viruses and emerging pathogens is sustaining demand. Strong government investment in disease surveillance infrastructure further reinforces dominance. Widespread clinical validation ensures high adoption across healthcare systems.
The miRNA Analysis segment is expected to witness the fastest growth at a CAGR of 8.4% from 2026 to 2033, driven by increasing research in cancer biomarkers and gene regulation studies. miRNA-based diagnostics are gaining importance in early disease detection and precision medicine. Expanding applications in oncology and neurological disorders are accelerating adoption. Advances in assay sensitivity are enabling improved detection of low-abundance targets. Growing pharmaceutical interest in biomarker-driven drug development is supporting expansion. Increasing academic research funding is further driving segment growth.
- By Application
On the basis of application, the market is segmented into diagnostics, research, and forensic. The Diagnostics segment dominated the market with a 60.12% share in 2025, driven by extensive use of q-PCR in infectious disease detection, oncology screening, and genetic disorder testing. Hospitals and diagnostic laboratories rely heavily on q-PCR due to its high accuracy and speed. Rising patient testing volumes across Asia-Pacific are strengthening demand. Government healthcare programs supporting early disease detection are further boosting adoption. Continuous expansion of molecular diagnostic infrastructure supports dominance. High clinical reliability ensures sustained utilization in routine diagnostics.
The Research segment is expected to witness the fastest growth at a CAGR of 7.9% from 2026 to 2033, driven by expanding genomics, transcriptomics, and drug discovery studies. Increasing investment in biotechnology and academic research is accelerating demand. q-PCR is widely used for gene expression profiling and validation studies. Rising pharmaceutical R&D activity is further supporting adoption. Growing focus on personalized medicine is expanding research applications. Availability of advanced reagent kits is improving experimental efficiency.
- By End User
On the basis of end user, the market is segmented into hospital & diagnostic centers, forensic laboratories, research & academic institutes, clinical research organizations, and others. The Hospital & Diagnostic Centers segment dominated the market with a 58.47% share in 2025, driven by high patient testing volumes and widespread adoption of molecular diagnostics in clinical workflows. These facilities extensively use q-PCR for infectious disease testing and oncology screening. Increasing healthcare infrastructure development across Asia-Pacific is supporting growth. Strong reimbursement frameworks in developed countries are enhancing adoption. Continuous demand for rapid and accurate diagnostics reinforces dominance. Integration of automated q-PCR systems is improving efficiency in hospital laboratories.
The Clinical Research Organizations (CROs) segment is expected to witness the fastest growth at a CAGR of 8.1% from 2026 to 2033, driven by increasing outsourcing of clinical trials and biomarker validation studies. CROs are increasingly adopting q-PCR for drug development and clinical validation workflows. Rising pharmaceutical R&D outsourcing in India, China, and South Korea is supporting expansion. Demand for high-quality molecular testing in clinical trials is increasing. Technological advancements in assay automation are improving efficiency. Growing global clinical research collaboration is further accelerating adoption.
- By Distribution Channel
On the basis of distribution channel, the market is segmented into direct tender, third-party distributors, and others. The Direct Tender segment dominated the market with a 61.23% share in 2025, driven by large-scale procurement by hospitals, government health programs, and research institutions. Bulk purchasing agreements ensure cost efficiency and supply reliability. Strong presence of public healthcare procurement systems across Asia-Pacific supports dominance. Long-term supplier contracts enhance stability in reagent supply. High-volume diagnostic testing further strengthens direct procurement preference. Increasing government-funded molecular testing programs reinforce segment leadership.
The Third-Party Distributors segment is expected to witness the fastest growth at a CAGR of 7.6% from 2026 to 2033, driven by expanding reach in emerging and underserved markets. Distributors play a key role in supplying reagents to small laboratories and private diagnostic centers. Growing demand for localized supply chains is supporting expansion. Increasing penetration of international reagent manufacturers through regional partners is boosting availability. Improved logistics and cold-chain infrastructure are enhancing distribution efficiency. Rising diagnostic adoption in tier-2 and tier-3 cities is further accelerating growth.
Asia-Pacific q-PCR Reagents Market Regional Analysis
China dominated the Asia-Pacific q-PCR reagents market with the largest revenue share of 36.28% in 2025, supported by strong genomics research funding, large-scale infectious disease testing programs, and rapid expansion of molecular diagnostic laboratories. The country also benefits from large-scale hospital testing infrastructure, increasing investment by domestic biotechnology companies, and growing integration of real-time PCR in oncology, pathogen detection, and precision medicine applications. Rising demand for high-throughput diagnostic solutions and continuous development of life sciences research capabilities continue to strengthen China’s leadership position in the Asia-Pacific market.
The Japan q-PCR Reagents Market Insight
The Japan q-PCR reagents market is witnessing consistent growth due to strong adoption of advanced molecular diagnostic technologies, high healthcare standards, and increasing focus on precision medicine and oncology research. Hospitals, diagnostic laboratories, and research institutes are widely using q-PCR for infectious disease detection, genetic analysis, and biomarker studies. Moreover, continuous technological advancements and integration of automated PCR systems are improving testing efficiency and supporting market expansion in Japan.
China q-PCR Reagents Market Insight
The China q-PCR reagents market is growing rapidly, driven by large-scale expansion of molecular diagnostic infrastructure, strong government support for genomics and infectious disease surveillance programs, and increasing investment in biotechnology and pharmaceutical research. Rising demand for high-throughput testing, widespread adoption of real-time PCR in clinical diagnostics, and strong presence of domestic reagent manufacturers are significantly boosting market growth. In addition, continuous advancements in precision medicine and large patient population base are positioning China as the dominant market in the Asia-Pacific region.
India q-PCR Reagents Market Insight
The India q-PCR reagents market is expanding steadily due to rising prevalence of infectious diseases, increasing adoption of molecular diagnostics in hospitals and diagnostic laboratories, and growing government initiatives to strengthen healthcare infrastructure. Expanding awareness of early disease detection and increasing investments in biotechnology and life sciences research are further supporting market growth. Additionally, the growing presence of private diagnostic chains and rising demand for affordable and accurate testing solutions are accelerating adoption across the country.
South Korea q-PCR Reagents Market Insight
The South Korea q-PCR reagents market is witnessing strong growth driven by advanced healthcare infrastructure, high adoption of precision diagnostics, and increasing investments in biotechnology and genomic research. The country’s strong focus on infectious disease surveillance, cancer diagnostics, and personalized medicine is boosting demand for high-performance q-PCR reagents. Moreover, integration of automated laboratory systems and government support for biomedical innovation are further enhancing market expansion.
Asia-Pacific q-PCR Reagents Market Share
The Asia-Pacific q-PCR reagents industry is primarily led by well-established companies, including:
- Thermo Fisher Scientific Inc. (U.S.)
- Bio-Rad Laboratories, Inc. (U.S.)
- QIAGEN (Netherlands)
- Takara Bio Inc. (Japan)
- Agilent Technologies, Inc. (U.S.)
- Hoffmann-La Roche Ltd (Switzerland)
- Merck KGaA (Germany)
- Promega Corporation (U.S.)
- Abbott (U.S.)
- BD (U.S.)
- Seegene Inc. (South Korea)
- Bioneer Corporation (South Korea)
- MiRXES Pte Ltd (Singapore)
- BioMérieux (France)
- New England Biolabs, Inc. (U.S.)
- Enzo Biochem, Inc. (U.S.)
- Sino Biological Inc. (China)
- GeneDireX, Inc. (Taiwan)
- Norgen Biotek Corp (Canada)
- Takara Holdings Inc. (Japan)
Latest Developments in Asia-Pacific q-PCR Reagents Market
- In November 2025, Thermo Fisher Scientific, a leading molecular diagnostics company, introduced the SureTect Beverage Spoilage Multiplex qPCR Assay to enhance rapid contamination and spoilage organism detection in industrial and laboratory testing workflows. The assay strengthens high-throughput q-PCR applications in quality control and food safety testing, supporting improved accuracy and turnaround time in molecular diagnostics laboratories across Asia-Pacific regions engaged in applied bioscience and industrial testing applications
- In April 2025, QIAGEN, a global provider of molecular diagnostics and sample technologies, expanded its automated q-PCR ecosystem through continued integration of NeuMoDx platforms to strengthen sample-to-result workflows. This advancement enhances reagent utilization efficiency, improves diagnostic automation, and supports increased adoption of standardized q-PCR testing solutions in clinical laboratories and research institutes across Asia-Pacific healthcare and life sciences sectors
- In March 2024, Roche Diagnostics, a leading global healthcare diagnostics company, advanced its molecular testing collaboration initiatives focused on integrating q-PCR workflows with broader genomic and precision diagnostics platforms. This development supports improved clinical testing efficiency, enabling enhanced disease detection capabilities and strengthening demand for high-performance q-PCR reagents in Asia-Pacific diagnostic laboratories and hospital networks
- In January 2024, Thermo Fisher Scientific, a major provider of analytical and molecular biology solutions, expanded its digital PCR and q-PCR product ecosystem with upgraded QuantStudio platforms designed for higher sensitivity and multiplex detection. This launch enhances research and clinical laboratory capabilities for genetic analysis and infectious disease testing, driving greater adoption of advanced q-PCR reagent systems in Asia-Pacific biotechnology and diagnostic applications
- In June 2022, Takara Bio Inc., a biotechnology company specializing in molecular biology reagents, strengthened its q-PCR reagent portfolio through improvements in enzyme performance and master mix formulations for high-efficiency amplification. These enhancements support improved reliability and sensitivity in gene expression analysis, infectious disease detection, and research applications, reinforcing growing adoption of q-PCR reagents across academic and clinical research laboratories in Asia-Pacific
SKU-

- Interactive Data Analysis Dashboard
- Company Analysis Dashboard for high growth potential opportunities
- Research Analyst Access for customization & queries
- Competitor Analysis with Interactive dashboard
- Latest News, Updates & Trend analysis
- Harness the Power of Benchmark Analysis for Comprehensive Competitor Tracking
Data collection and base year analysis are done using data collection modules with large sample sizes. The stage includes obtaining market information or related data through various sources and strategies. It includes examining and planning all the data acquired from the past in advance. It likewise envelops the examination of information inconsistencies seen across different information sources. The market data is analysed and estimated using market statistical and coherent models. Also, market share analysis and key trend analysis are the major success factors in the market report. To know more, please request an analyst call or drop down your inquiry.
The key research methodology used by DBMR research team is data triangulation which involves data mining, analysis of the impact of data variables on the market and primary (industry expert) validation. Data models include Vendor Positioning Grid, Market Time Line Analysis, Market Overview and Guide, Company Positioning Grid, Patent Analysis, Pricing Analysis, Company Market Share Analysis, Standards of Measurement, Global versus Regional and Vendor Share Analysis. To know more about the research methodology, drop in an inquiry to speak to our industry experts.
Data Bridge Market Research is a leader in advanced formative research. We take pride in servicing our existing and new customers with data and analysis that match and suits their goal. The report can be customized to include price trend analysis of target brands understanding the market for additional countries (ask for the list of countries), clinical trial results data, literature review, refurbished market and product base analysis. Market analysis of target competitors can be analyzed from technology-based analysis to market portfolio strategies. We can add as many competitors that you require data about in the format and data style you are looking for. Our team of analysts can also provide you data in crude raw excel files pivot tables (Fact book) or can assist you in creating presentations from the data sets available in the report.


