
Asia Pacific Quinoa Market
Market Size in USD Million
 USD
234.16 Million
USD
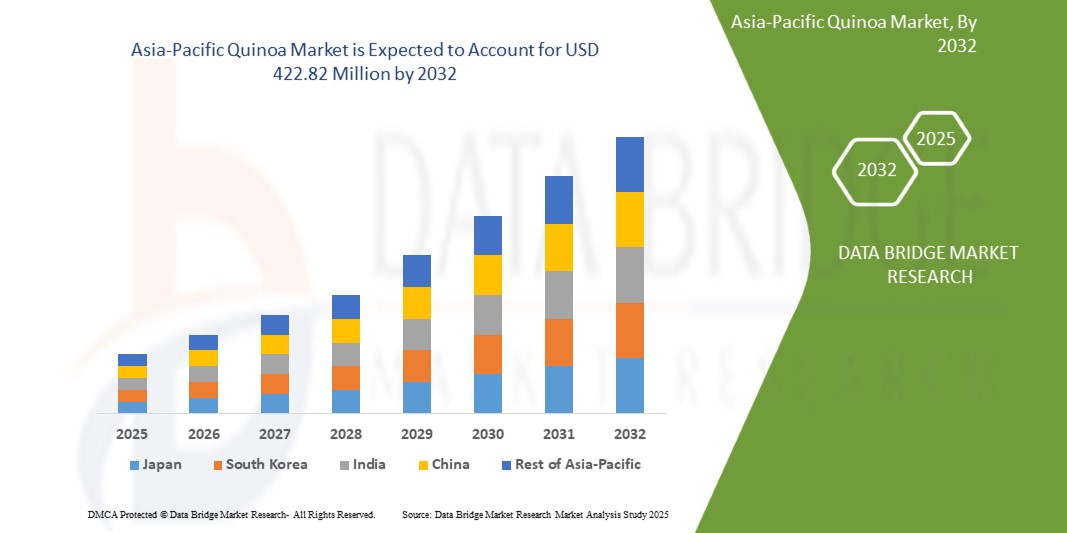
422.82 Million
2024
2032
USD
234.16 Million
USD
422.82 Million
2024
2032
| 2025 - 2032 | |
| USD 234.16 Million | |
| USD 422.82 Million | |
| % | |
|
Quinoa Market Size
- The Asia-Pacific Quinoa Market was valued at USD 234.16 Million in 2024 and is expected to reach USD 422.82 Million by 2032
- During the forecast period of 2025 to 2032 the market is likely to grow at a CAGR of 7.8%, primarily driven by the Rising demand for gluten-free and plant-based foods.
- This growth is driven by factors such as increasing health awareness among Asia-Pacific urban consumers and fast expanding vegan and vegetarian dietary lifestyle trends.
Quinoa Market Analysis
- Quinoa is a nutrient-dense, gluten-free pseudocereal derived from the seeds of the Chenopodium quinoa plant, native to the Andean region of South America. Although often used like a grain, it is technically a seed and is valued for its high protein content, containing all nine essential amino acids.
- Growing application of quinoa in functional and fortified food products are some of the driving factors expected to propel the market growth.
- In 2025, North America is expected to dominate with a market share of 35.24%. due to rising health awareness, gluten-free and plant‑based diets, increased domestic production, strong import growth, and innovative quinoa products driving mainstream consumer adoption.
- The single segment is expected to dominate the market with a market share of 63.08%. due to rising consumer demand for traceability, authenticity, and premium quality, often linked to ethical sourcing, sustainability, and regional nutritional distinctions.
Report Scope and Quinoa Market Segmentation
|
Attributes |
Quinoa Key Market Insights |
|
Segments Covered |
|
|
Countries Covered |
China, India, Japan, Australia, South Korea, Thailand, Malaysia, Indonesia, Philippines, Singapore, New Zealand, Rest of Asia-Pacific |
|
Key Market Players |
|
|
Market Opportunities |
|
|
Value Added Data Infosets |
In addition to the insights on market scenarios such as market value, growth rate, segmentation, geographical coverage, and major players, the market reports curated by the Data Bridge Market Research also include import export analysis, production capacity overview, production consumption analysis, price trend analysis, climate change scenario, supply chain analysis, value chain analysis, raw material/consumables overview, vendor selection criteria, PESTLE Analysis, Porter Analysis, and regulatory framework. |
Quinoa Market Trends
“Advancements in R&D Targeting Agronomic Efficiency, Nutritional Enhancement, and Processing Innovation”
- Research and Development (R&D) in quinoa cultivation and processing is addressing key challenges such as climate adaptability, yield variability, and post-harvest losses—unlocking new commercial potential in both emerging and mature markets.
- Innovations in breeding techniques are producing quinoa cultivars with improved drought tolerance, salinity resistance, and pest resilience—helping expand cultivation beyond traditional Andean regions to areas in Africa, Asia, and Europe.
- Agronomic R&D is also enhancing nutritional traits of quinoa, such as higher protein content, increased lysine levels, and lower saponin concentrations—making the crop more desirable for health-conscious consumers and specialized food applications like baby food, gluten-free baking, and sports nutrition.
- Post-harvest innovations, including automated sorting, low-temperature drying, and precision dehulling systems, are reducing processing costs and improving consistency in quality and shelf life.
- Additionally, integrated value chain development models—combining on-farm improvements with processing optimization—are being explored to increase farmer income and reduce waste. Public-private partnerships, such as those supported by agricultural universities and NGOs, are further accelerating R&D efforts in this space.
Quinoa Market Dynamics
Driver
“RISING DEMAND FOR GLUTEN-FREE AND PLANT-BASED FOODS”
- The market is significantly driven by the increasing consumer shift toward gluten-free and plant-based dietary patterns. Quinoa, being a naturally gluten-free pseudocereal, has emerged as a preferred alternative for individuals with celiac disease, gluten intolerance, or those adopting gluten-free diets as a lifestyle choice. Additionally, the grain’s high protein content, which includes all nine essential amino acids, positions it as a superior plant-based protein source, making it highly attractive to vegetarians, vegans, and flexitarians.
- As Asia-Pacific awareness surrounding health, wellness, and nutritional transparency continues to grow, quinoa’s rich profile of fiber, vitamins, minerals, and antioxidants aligns well with the evolving preferences of health-conscious consumers. The rise of plant-based food innovation in categories such as meat alternatives, dairy substitutes, and functional snacks has also integrated quinoa into mainstream applications, further enhancing its visibility and consumption.
For Instance,
- In September 2024, as per a news published by the American Heart Association, quinoa was recognized as a modern nutritional powerhouse, praised for its plant-based protein content and gluten-free properties, making it an ideal dietary choice for health-conscious consumers pursuing balanced, allergen-free, and sustainable eating habits
- In March 2024, as per an article published by Medical News Today, quinoa was highlighted as a nutrient-dense, gluten-free grain rich in plant-based protein and essential amino acids, reinforcing its value in vegetarian and vegan diets and supporting its rising popularity among health-conscious Asia-Pacific consumers seeking balanced nutrition
Opportunity
“EXPANDING QUINOA FARMING IN ASIA, AFRICA, NORTH AMERICA, AND EUROPE COUNTRIES”
The expansion of quinoa farming across non-traditional regions such as Asia, Africa, North America, and Europe presents a significant opportunity for the quinoa market. Traditionally cultivated in the Andean regions of South America, quinoa’s adaptability to diverse agro-ecological conditions has enabled its successful introduction in a range of geographies. Countries such as India, China, Kenya, Morocco, the United States, Canada, France, and Denmark have initiated quinoa trials or commercial cultivation to address rising local and Asia-Pacific demand.
This geographic diversification mitigates supply chain risks associated with overreliance on Andean production, including climate volatility and socio-economic disruptions. Moreover, it enhances regional food security by introducing a resilient, nutrient-dense crop capable of growing in semi-arid and saline-prone soils—conditions increasingly prevalent due to climate change.
For Instance,
- In August 2023, the Indian Council of Agricultural Research (ICAR) announced successful field trials of quinoa cultivation in multiple states including Rajasthan, Gujarat, and Madhya Pradesh, with plans to promote commercial farming due to rising domestic demand and favorable climatic responses.
- In October 2023, the Australian government, through its Department of Agriculture, Fisheries and Forestry, launched a pilot program to support quinoa production in semi-arid regions, aiming to diversify crop options for farmers amid climate change challenges.
Restraint/Challenge
“REGULATORY & TRADE UNCERTAINTIES”
- The quinoa market is notably constrained by evolving regulatory frameworks and trade uncertainties that impede smooth international commerce. Importing regions such as the European Union enforce stringent regulations covering pesticide residues, food safety, organic certification, labeling, and traceability for quinoa products. Achieving compliance with these laws requires significant investment in testing, documentation, and certification, disproportionately affecting small and mid-sized producers and exporters.
- Furthermore, international agreements such as the WTO’s Sanitary and Phytosanitary (SPS) and Technical Barriers to Trade (TBT) measures allow individual countries to introduce non-tariff trade barriers based on public health and safety, which can lead to inconsistent or protectionist implementation.
For Instance,
- In November 2023, the Philippines' Department of Agriculture included quinoa in its list of priority crops under the Climate-Resilient Agriculture Program, citing its nutritional value and suitability for local production in marginal soils.
- In January 2024, China’s Yunnan Agricultural University reported the successful development of two new quinoa varieties suited to high-altitude and low-rainfall areas, with plans to distribute seeds to farmers in collaboration with local cooperatives.
Quinoa Market Scope
The Asia-Pacific quinoa market is segmented into five notable segments based on type, nature, product, packaging type and distribution channel.
Type
On the basis of type, the market is segmented into single and tricolor. Single is further segmented by type into white, red, black, rainbow, orange, green, purple, pink and gray.
In 2025, single will dominate due to rising consumer demand for traceability, authenticity, and premium quality, often linked to ethical sourcing, sustainability, and regional nutritional distinctions.
Nature
On the basis of nature, the market is segmented into conventional quinoa and organic quinoa.
In 2025, the conventional segment will due to its lower production costs, wider availability, and suitability for mass consumption, meeting rising demand from mainstream food and retail sectors.
Product
On the basis of product, the market is segmented into seeds, flour, flakes and puffs.
In 2025, the seeds segment will dominate due to their versatility in cooking, long shelf life, and rising demand for nutrient-rich, plant-based superfoods in both retail and foodservice sectors
Packaging type
On the basis of packaging type, the market is segmented into bags, pouches, box, jar and others.
In 2025, the bags segment will dominate as they offer convenient, cost-effective, and eco-friendly packaging solutions, catering to bulk buyers, retailers, and environmentally conscious consumers seeking sustainable storage options.
Distribution channel
On the basis of distribution channel, the market is segmented into offline and online. Offline is further segmented by distribution channel into supermarkets and hypermarkets, grocery stores & local retailers, health food stores / organic stores, specialty stores and others. Online is further segmented by distribution channel into 3rd party website and company own website.
In 2025, the offline segment will dominate because consumers appreciate in-store inspection, personalized service, and immediate purchase. Supermarkets and health food stores also enhance trust and convenience, boosting offline quinoa demand.
Quinoa Market Regional Analysis
Asia-Pacific
Asia-Pacific hold 21.56% market share in 2024, driven by rising health awareness, growing middle-class income, and demand for functional superfoods. Countries like China, India, Japan, and Australia are witnessing increased quinoa imports, while local cultivation is emerging in niche health segments.
Japan Quinoa Market Insight
Japan’s quinoa market is expanding due to growing interest in low-carb, high-protein diets and functional foods. The aging population and rising demand for gluten-free, diabetic-friendly products are fueling quinoa use in cereals, beverages, and healthy ready-to-eat meal solutions.
China Quinoa Market Insight
China's quinoa market is rising steadily, supported by government-backed cultivation in regions like Qinghai and Gansu. Increasing consumer focus on nutrition, weight management, and Western health trends is boosting quinoa demand in snacks, health foods, and premium retail categories.
Quinoa Market Share
The market competitive landscape provides details by competitor. Details included are company overview, company financials, revenue generated, market potential, investment in research and development, new market initiatives, Asia-Pacific presence, production sites and facilities, production capacities, company strengths and weaknesses, product launch, product width and breadth, application dominance. The above data points provided are only related to the companies' focus related to market.
The Major Market Leaders Operating in the Market Are:
- QUINOA FOODS COMPANY SRL
- NORTHERN QUINOA PRODUCTION CORPORATION
- Quinoa Corporation
- The British Quinoa Company
- Nourish You
- Organic Tattva
- Adinath Agro Industries
- SARCHIO SPA
- AARY'S FOOD
- ARDENT MILLS
- Appkin Agro Private Limited
- Elworld Organic
- Apex International
- SHANTILAL AND SONS HUF
- Vedaliya Industries LLP.
- Shiloh Farms
- ROYAL NUT COMPANY
- MAATITATVA AGRO INDUSTRIES PRIVATE LIMITED
- Dev Agro Industries
- Pureproducts
- Alter Eco Foods
- Irupana
Latest Developments in Asia-Pacific Quinoa Market
- In February 2024, investment firm Trek One Capital completed its acquisition of Alter Eco Foods, the premium organic brand known for quinoa, granola, chocolate, and truffles. The deal aims to accelerate growth in their premium snack range and expand distribution channels.
- In May 2025, Mehrotra Consumer Products showcased its “Organic Quinoa” at the Saudi Food Show in Riyadh, highlighting its gluten-free, high-protein, antioxidant-rich superfood to international buyers.
SKU-

- Interactive Data Analysis Dashboard
- Company Analysis Dashboard for high growth potential opportunities
- Research Analyst Access for customization & queries
- Competitor Analysis with Interactive dashboard
- Latest News, Updates & Trend analysis
- Harness the Power of Benchmark Analysis for Comprehensive Competitor Tracking
Table of Content
1 INTRODUCTION
1.1 OBJECTIVES OF THE STUDY
1.2 MARKET DEFINITION
1.3 OVERVIEW
1.4 LIMITATIONS
1.5 MARKETS COVERED
2 MARKET SEGMENTATION
2.1 MARKETS COVERED
2.2 GEOGRAPHICAL SCOPE
2.3 YEARS CONSIDERED FOR THE STUDY
2.4 CURRENCY AND PRICING
2.5 DBMR TRIPOD DATA VALIDATION MODEL
2.6 MULTIVARIATE MODELING
2.7 PRIMARY INTERVIEWS WITH KEY OPINION LEADERS
2.8 DBMR MARKET POSITION GRID
2.9 VENDOR SHARE ANALYSIS
2.1 SECONDARY SOURCES
2.11 ASSUMPTIONS
3 EXECUTIVE SUMMARY
4 PREMIUM INSIGHTS
4.1 PRICING ANALYSIS
4.2 COST ANALYSIS BREAKDOWN OF THE ASIA-PACIFIC QUINOA MARKET
4.3 FACTORS AFFECTING BUYING DECISION
4.3.1 PRICE
4.3.2 PRODUCT QUALITY
4.3.3 BRAND REPUTATION
4.3.4 ADVERTISEMENT AND PROMOTIONS
4.3.5 PRODUCT AVAILABILITY
4.3.6 FINANCIAL ACCESSIBILITY
4.3.7 PEER AND EXPERT RECOMMENDATIONS
4.4 IMPACT OF ECONOMIC SLOWDOWN ON ASIA-PACIFIC QUINOA MARKET
4.4.1 IMPACT OF PRICE
4.4.2 IMPACT ON SUPPLY CHAIN
4.4.3 IMPACT ON SHIPMENT
4.4.4 IMPACT ON DEMAND
4.4.5 IMPACT ON STRATEGIC DECISIONS
4.5 INDUSTRY ECO-SYSTEM ANALYSIS
4.5.1 PROMINENT COMPANIES
4.5.2 SMALL & MEDIUM SIZE COMPANIES
4.5.3 END USERS
4.6 INNOVATION TRACKER AND STRATEGIC ANALYSIS
4.6.1 MAJOR DEALS AND STRATEGIC ALLIANCES ANALYSIS
4.6.1.1 JOINT VENTURES
4.6.1.2 MERGERS AND ACQUISITIONS
4.6.1.3 LICENSING AND PARTNERSHIP
4.6.1.4 TECHNOLOGY COLLABORATIONS
4.6.1.5 STRATEGIC DIVESTMENTS
4.6.2 NUMBER OF PRODUCTS IN DEVELOPMENT
4.6.3 STAGE OF DEVELOPMENT
4.6.4 TIMELINES AND MILESTONES
4.6.5 INNOVATION STRATEGIES AND METHODOLOGIES
4.6.6 RISK ASSESSMENT AND MITIGATION
4.6.7 FUTURE OUTLOOK
4.7 PATENT QUALITY AND STRENGTH
4.8 PATENT FAMILIES
4.8.1 LICENSING AND COLLABORATIONS
4.8.1.1 COMPANY PATENT LANDSCAPE
4.8.1.2 REGION PATENT LANDSCAPE
4.8.1.3 IP STRATEGY AND MANAGEMENT
4.8.2 PATENT ANALYSIS
4.8.3 CONSUMER BUYING BEHAVIOUR
4.9 PRODUCT ADOPTION SCENARIO
4.9.1 CONSUMER SEGMENT PENETRATION
4.9.2 INDUSTRIAL AND FOOD SERVICE ADOPTION
4.9.3 GEOGRAPHICAL EXPANSION
4.9.4 BARRIERS TO ADOPTION
4.1 RAW MATERIAL SOURCING ANALYSIS
4.10.1 KEY RAW MATERIAL: QUINOA SEEDS
4.10.2 MAJOR QUINOA-PRODUCING COUNTRIES
4.10.3 SOURCING CHANNELS
4.10.4 CERTIFICATIONS & QUALITY STANDARDS
4.10.5 CHALLENGES IN RAW MATERIAL SOURCING
4.10.6 TRENDS IN SOURCING STRATEGY
4.11 SUPPLY CHAIN ANALYSIS
4.11.1 OVERVIEW
4.11.2 LOGISTIC COST SCENARIO
4.11.3 IMPORTANCE OF LOGISTICS SERVICE PROVIDERS
5 TARIFFS AND THEIR IMPACT ON MARKET
5.1 CURRENT TARIFF RATES IN TOP-5 COUNTRY MARKETS
5.2 OUTLOOK: LOCAL PRODUCTION VS IMPORT RELIANCE
5.3 VENDOR SELECTION CRITERIA DYNAMICS
5.4 IMPACT ON SUPPLY CHAIN
5.4.1 RAW MATERIAL PROCUREMENT
5.4.2 MANUFACTURING AND PRODUCTION
5.4.3 LOGISTICS AND DISTRIBUTION
5.4.4 PRICE PITCHING AND POSITION OF MARKET
5.5 INDUSTRY PARTICIPANTS: PROACTIVE MOVES
5.5.1 SUPPLY CHAIN OPTIMIZATION
5.5.2 JOINT VENTURE ESTABLISHMENTS
5.6 IMPACT ON PRICES
5.7 REGULATORY INCLINATION
5.7.1 GEOPOLITICAL SITUATION
5.7.2 TRADE PARTNERSHIPS BETWEEN COUNTRIES
5.7.2.1 FREE TRADE AGREEMENTS
5.7.2.2 ALLIANCE ESTABLISHMENTS
5.7.3 STATUS ACCREDITATION (INCLUDING MFN)
5.7.4 DOMESTIC COURSE OF CORRECTION
5.7.4.1 INCENTIVE SCHEMES TO BOOST PRODUCTION OUTPUTS
5.7.4.2 ESTABLISHMENT OF SPECIAL ECONOMIC ZONES / INDUSTRIAL PARKS
6 REGULATION COVERAGE
7 MARKET OVERVIEW
7.1 DRIVER
7.1.1 RISING DEMAND FOR GLUTEN-FREE AND PLANT-BASED FOODS
7.1.2 INCREASING HEALTH AWARENESS AMONG ASIA-PACIFIC URBAN CONSUMERS
7.1.3 FAST EXPANDING VEGAN AND VEGETARIAN DIETARY LIFESTYLE TRENDS
7.1.4 GROWING APPLICATION OF QUINOA IN FUNCTIONAL AND FORTIFIED FOOD PRODUCTS
7.2 RESTRAINTS
7.2.1 HIGH PRODUCTION COSTS LIMIT LARGE-SCALE COMMERCIAL EXPANSION
7.2.2 EXPANSION OF SINGLE-CROP QUINOA LEADING TO SOIL DEGRADATION, BIODIVERSITY LOSS, AND SUSCEPTIBILITY TO CLIMATE STRESS
7.3 OPPORTUNITIES
7.3.1 EXPANDING QUINOA FARMING IN ASIA, AFRICA, NORTH AMERICA, AND EUROPE COUNTRIES
7.3.2 GOVERNMENT SUPPORT & POLICY INCENTIVES PROMOTING FARMERS TO ADOPT QUINOA AS A CLIMATE-RESILIENT CROP
7.3.3 RISING POPULARITY OF ORGANIC AND SUSTAINABLE AGRICULTURE PRACTICES
7.4 CHALLENGES
7.4.1 REGULATORY & TRADE UNCERTAINTIES
7.4.2 QUALITY INCONSISTENCIES ACROSS INTERNATIONAL QUINOA SUPPLY CHAINS
8 ASIA-PACIFIC QUINOA MARKET, BY TYPE
8.1 OVERVIEW
8.2 SINGLE
8.3 TRICOLOR
9 ASIA-PACIFIC QUINOA MARKET, BY PRODUCT
9.1 OVERVIEW
9.2 SEEDS
9.3 FLOUR
9.4 FLAKES
9.5 PUFFS
10 ASIA-PACIFIC QUINOA MARKET, BY PACKAGING TYPE
10.1 OVERVIEW
10.2 BAGS
10.3 POUCHES
10.4 BOX
10.5 JAR
10.6 OTHERS
11 ASIA-PACIFIC QUINOA MARKET, BY NATURE
11.1 OVERVIEW
11.2 CONVENTIONAL QUINOA
11.3 ORGANIC QUINOA
12 ASIA-PACIFIC QUINOA MARKET, BY DISTRIBUTION CHANNEL
12.1 OVERVIEW
12.2 OFFLINE
12.3 ONLINE
13 ASIA-PACIFIC QUINOA MARKET, BY REGION
13.1 ASIA-PACIFIC
13.1.1 CHINA
13.1.2 INDIA
13.1.3 JAPAN
13.1.4 AUSTRALIA
13.1.5 SOUTH KOREA
13.1.6 THAILAND
13.1.7 MALAYSIA
13.1.8 INDONESIA
13.1.9 PHILIPPINES
13.1.10 SINGAPORE
13.1.11 NEW ZEALAND
13.1.12 REST OF ASIA-PACIFIC
14 ASIA-PACIFIC QUINOA MARKET COMPANY LANDSCAPE
14.1 COMPANY SHARE ANALYSIS: GLOBAL
15 SWOT ANALYSIS
16 COMPANY PROFILE
16.1 ARDENT MILLS
16.1.1 COMPANY SNAPSHOT
16.1.2 COMPANY SHARE ANALYSIS
16.1.3 PRODUCT PORTFOLIO
16.1.4 RECENT DEVELOPMENT
16.2 ADINATH AGRO INDUSTRIES
16.2.1 COMPANY SNAPSHOT
16.2.2 COMPANY SHARE ANALYSIS
16.2.3 PRODUCT PORTFOLIO
16.2.4 RECENT DEVELOPMENT
16.3 NOURISH YOU
16.3.1 COMPANY SNAPSHOT
16.3.2 COMPANY SHARE ANALYSIS
16.3.3 PRODUCT PORTFOLIO
16.3.4 RECENT DEVELOPMENTS
16.4 APEX INTERNATIONAL
16.4.1 COMPANY SNAPSHOT
16.4.2 COMPANY SHARE ANALYSIS
16.4.3 PRODUCT PORTFOLIO
16.4.4 RECENT DEVELOPMENT
16.5 AARY'S FOOD
16.5.1 COMPANY SNAPSHOT
16.5.2 COMPANY SHARE ANALYSIS
16.5.3 PRODUCT PORTFOLIO
16.5.4 RECENT DEVELOPMENT
16.6 ALTER ECO FOODS
16.6.1 COMPANY SNAPSHOT
16.6.2 PRODUCT PORTFOLIO
16.6.3 RECENT DEVELOPMENT
16.7 APPKIN AGRO PRIVATE LIMITED
16.7.1 COMPANY SNAPSHOT
16.7.2 PRODUCT PORTFOLIO
16.7.3 RECENT DEVELOPMENT
16.8 DEV AGRO INDUSTRIES
16.8.1 COMPANY SNAPSHOT
16.8.2 PRODUCT PORTFOLIO
16.8.3 RECENT DEVELOPMENT
16.9 ELWORLD ORGANIC
16.9.1 COMPANY SNAPSHOT
16.9.2 PRODUCT PORTFOLIO
16.9.3 RECENT DEVELOPMENT
16.1 IRUPANA ANDEN ORGANIC FOOD S.A.
16.10.1 COMPANY SNAPSHOT
16.10.2 PRODUCT PORTFOLIO
16.10.3 RECENT DEVELOPMENT
16.11 MAATITATVA AGRO INDUSTRIES PRIVATE LIMITED
16.11.1 COMPANY SNAPSHOT
16.11.2 PRODUCT PORTFOLIO
16.11.3 RECENT DEVELOPMENT
16.12 NORTHERN QUINOA PRODUCTION CORPORATION
16.12.1 COMPANY SNAPSHOT
16.12.2 PRODUCT PORTFOLIO
16.12.3 RECENT DEVELOPMENTS
16.13 ORGANIC TATTVA
16.13.1 COMPANY SNAPSHOT
16.13.2 PRODUCT PORTFOLIO
16.13.3 RECENT DEVELOPMENT/NEWS
16.14 PURE PRODUCTS
16.14.1 COMPANY SNAPSHOT
16.14.2 PRODUCT PORTFOLIO
16.14.3 RECENT DEVELOPMENT
16.15 QUINOA CORPORATION
16.15.1 COMPANY SNAPSHOT
16.15.2 PRODUCT PORTFOLIO
16.15.3 RECENT DEVELOPMENTS
16.16 QUINOA FOODS COMPANY SRL
16.16.1 COMPANY SNAPSHOT
16.16.2 PRODUCT PORTFOLIO
16.16.3 RECENT DEVELOPMENTS
16.17 ROYAL NUT COMPANY.
16.17.1 COMPANY SNAPSHOT
16.17.2 PRODUCT PORTFOLIO
16.17.3 RECENT DEVELOPMENT
16.18 SARCHIO SPA
16.18.1 COMPANY SNAPSHOT
16.18.2 PRODUCT PORTFOLIO
16.18.3 RECENT DEVELOPMENT
16.19 SHANTILAL & SONS HUF
16.19.1 COMPANY SNAPSHOT
16.19.2 PRODUCT PORTFOLIO
16.19.3 RECENT DEVELOPMENT
16.2 SHILOH FARMS
16.20.1 COMPANY SNAPSHOT
16.20.2 PRODUCT PORTFOLIO
16.20.3 RECENT DEVELOPMENTS
16.21 THE BRITISH QUINOA COMPANY
16.21.1 COMPANY SNAPSHOT
16.21.2 PRODUCT PORTFOLIO
16.21.3 RECENT DEVELOPMENTS
16.22 VEDALIYA INDUSTRIES LLP.
16.22.1 COMPANY SNAPSHOT
16.22.2 PRODUCT PORTFOLIO
16.22.3 RECENT DEVELOPMENT
17 QUESTIONNAIRE
18 RELATED REPORTS
List of Table
TABLE 1 REGULATORY COVERAGE
TABLE 2 ASIA-PACIFIC QUINOA MARKET, BY TYPE, 2018-2032 (USD THOUSAND)
TABLE 3 ASIA-PACIFIC QUINOA MARKET, BY TYPE, 2018-2032 (KILO TONS)
TABLE 4 ASIA-PACIFIC SINGLE IN QUINOA MARKET, BY TYPE, 2018-2032 (USD THOUSAND)
TABLE 5 ASIA-PACIFIC SINGLE IN QUINOA MARKET, BY REGION, 2018-2032 (USD THOUSAND)
TABLE 6 ASIA-PACIFIC TRICOLOR IN QUINOA MARKET, BY REGION, 2018-2032 (USD THOUSAND)
TABLE 7 ASIA-PACIFIC QUINOA MARKET, BY PRODUCT, 2018-2032 (USD THOUSAND)
TABLE 8 ASIA-PACIFIC SEEDS IN QUINOA MARKET, BY REGION, 2018-2032 (USD THOUSAND)
TABLE 9 ASIA-PACIFIC FLOUR IN QUINOA MARKET, BY REGION, 2018-2032 (USD THOUSAND)
TABLE 10 ASIA-PACIFIC FLAKES IN QUINOA MARKET, BY REGION, 2018-2032 (USD THOUSAND)
TABLE 11 ASIA-PACIFIC PUFFS IN QUINOA MARKET, BY REGION, 2018-2032 (USD THOUSAND)
TABLE 12 ASIA-PACIFIC QUINOA MARKET, BY PACKAGING TYPE, 2018-2032 (USD THOUSAND)
TABLE 13 ASIA-PACIFIC BAGS IN QUINOA MARKET, BY REGION, 2018-2032 (USD THOUSAND)
TABLE 14 ASIA-PACIFIC POUCHES IN QUINOA MARKET, BY REGION, 2018-2032 (USD THOUSAND)
TABLE 15 ASIA-PACIFIC BOX IN QUINOA MARKET, BY REGION, 2018-2032 (USD THOUSAND)
TABLE 16 ASIA-PACIFIC JAR IN QUINOA MARKET, BY REGION, 2018-2032 (USD THOUSAND)
TABLE 17 ASIA-PACIFIC OTHERS IN QUINOA MARKET, BY REGION, 2018-2032 (USD THOUSAND)
TABLE 18 ASIA-PACIFIC QUINOA MARKET, BY NATURE, 2018-2032 (USD THOUSAND)
TABLE 19 ASIA-PACIFIC CONVENTIONAL QUINOA IN QUINOA MARKET, BY REGION, 2018-2032 (USD THOUSAND)
TABLE 20 ASIA-PACIFIC ORGANIC QUINOA IN QUINOA MARKET, BY REGION, 2018-2032 (USD THOUSAND)
TABLE 21 ASIA-PACIFIC QUINOA MARKET, BY DISTRIBUTION CHANNEL, 2018-2032 (USD THOUSAND)
TABLE 22 ASIA-PACIFIC OFFLINE IN QUINOA MARKET, BY DISTRIBUTION CHANNEL, 2018-2032 (USD THOUSAND)
TABLE 23 ASIA-PACIFIC OFFLINE IN QUINOA MARKET, BY REGION, 2018-2032 (USD THOUSAND)
TABLE 24 ASIA-PACIFIC ONLINE IN QUINOA MARKET, BY DISTRIBUTION CHANNEL, 2018-2032 (USD THOUSAND)
TABLE 25 ASIA-PACIFIC ONLINE IN QUINOA MARKET, BY REGION, 2018-2032 (USD THOUSAND)
TABLE 26 ASIA-PACIFIC QUINOA MARKET, BY COUNTRY, 2018-2032 (USD THOUSAND)
TABLE 27 ASIA-PACIFIC QUINOA MARKET, BY TYPE, 2018-2032 (USD THOUSAND)
TABLE 28 ASIA-PACIFIC QUINOA MARKET, BY TYPE, 2018-2032 (USD THOUSAND) (KILO TONS)
TABLE 29 ASIA-PACIFIC SINGLE IN QUINOA MARKET, BY TYPE, 2018-2032 (USD THOUSAND)
TABLE 30 ASIA-PACIFIC QUINOA MARKET, BY NATURE, 2018-2032 (USD THOUSAND)
TABLE 31 ASIA-PACIFIC QUINOA MARKET, BY PRODUCT, 2018-2032 (USD THOUSAND)
TABLE 32 ASIA-PACIFIC QUINOA MARKET, BY PACKAGING TYPE, 2018-2032 (USD THOUSAND)
TABLE 33 ASIA-PACIFIC QUINOA MARKET, BY DISTRIBUTION CHANNEL, 2018-2032 (USD THOUSAND)
TABLE 34 ASIA-PACIFIC OFFLINE IN QUINOA MARKET, BY DISTRIBUTION CHANNEL, 2018-2032 (USD THOUSAND)
TABLE 35 ASIA-PACIFIC ONLINE IN QUINOA MARKET, BY DISTRIBUTION CHANNEL, 2018-2032 (USD THOUSAND)
TABLE 36 CHINA QUINOA MARKET, BY TYPE, 2018-2032 (USD THOUSAND)
TABLE 37 CHINA QUINOA MARKET, BY TYPE, 2018-2032 (USD THOUSAND) (KILO TONS)
TABLE 38 CHINA SINGLE IN QUINOA MARKET, BY TYPE, 2018-2032 (USD THOUSAND)
TABLE 39 CHINA QUINOA MARKET, BY NATURE, 2018-2032 (USD THOUSAND)
TABLE 40 CHINA QUINOA MARKET, BY PRODUCT, 2018-2032 (USD THOUSAND)
TABLE 41 CHINA QUINOA MARKET, BY PACKAGING TYPE, 2018-2032 (USD THOUSAND)
TABLE 42 CHINA QUINOA MARKET, BY DISTRIBUTION CHANNEL, 2018-2032 (USD THOUSAND)
TABLE 43 CHINA OFFLINE IN QUINOA MARKET, BY DISTRIBUTION CHANNEL, 2018-2032 (USD THOUSAND)
TABLE 44 CHINA ONLINE IN QUINOA MARKET, BY DISTRIBUTION CHANNEL, 2018-2032 (USD THOUSAND)
TABLE 45 INDIA QUINOA MARKET, BY TYPE, 2018-2032 (USD THOUSAND)
TABLE 46 INDIA QUINOA MARKET, BY TYPE, 2018-2032 (USD THOUSAND) (KILO TONS)
TABLE 47 INDIA SINGLE IN QUINOA MARKET, BY TYPE, 2018-2032 (USD THOUSAND)
TABLE 48 INDIA QUINOA MARKET, BY NATURE, 2018-2032 (USD THOUSAND)
TABLE 49 INDIA QUINOA MARKET, BY PRODUCT, 2018-2032 (USD THOUSAND)
TABLE 50 INDIA QUINOA MARKET, BY PACKAGING TYPE, 2018-2032 (USD THOUSAND)
TABLE 51 INDIA QUINOA MARKET, BY DISTRIBUTION CHANNEL, 2018-2032 (USD THOUSAND)
TABLE 52 INDIA OFFLINE IN QUINOA MARKET, BY DISTRIBUTION CHANNEL, 2018-2032 (USD THOUSAND)
TABLE 53 INDIA ONLINE IN QUINOA MARKET, BY DISTRIBUTION CHANNEL, 2018-2032 (USD THOUSAND)
TABLE 54 JAPAN QUINOA MARKET, BY TYPE, 2018-2032 (USD THOUSAND)
TABLE 55 JAPAN QUINOA MARKET, BY TYPE, 2018-2032 (USD THOUSAND) (KILO TONS)
TABLE 56 JAPAN SINGLE IN QUINOA MARKET, BY TYPE, 2018-2032 (USD THOUSAND)
TABLE 57 JAPAN QUINOA MARKET, BY NATURE, 2018-2032 (USD THOUSAND)
TABLE 58 JAPAN QUINOA MARKET, BY PRODUCT, 2018-2032 (USD THOUSAND)
TABLE 59 JAPAN QUINOA MARKET, BY PACKAGING TYPE, 2018-2032 (USD THOUSAND)
TABLE 60 JAPAN QUINOA MARKET, BY DISTRIBUTION CHANNEL, 2018-2032 (USD THOUSAND)
TABLE 61 JAPAN OFFLINE IN QUINOA MARKET, BY DISTRIBUTION CHANNEL, 2018-2032 (USD THOUSAND)
TABLE 62 JAPAN ONLINE IN QUINOA MARKET, BY DISTRIBUTION CHANNEL, 2018-2032 (USD THOUSAND)
TABLE 63 AUSTRALIA QUINOA MARKET, BY TYPE, 2018-2032 (USD THOUSAND)
TABLE 64 AUSTRALIA QUINOA MARKET, BY TYPE, 2018-2032 (USD THOUSAND) (KILO TONS)
TABLE 65 AUSTRALIA SINGLE IN QUINOA MARKET, BY TYPE, 2018-2032 (USD THOUSAND)
TABLE 66 AUSTRALIA QUINOA MARKET, BY NATURE, 2018-2032 (USD THOUSAND)
TABLE 67 AUSTRALIA QUINOA MARKET, BY PRODUCT, 2018-2032 (USD THOUSAND)
TABLE 68 AUSTRALIA QUINOA MARKET, BY PACKAGING TYPE, 2018-2032 (USD THOUSAND)
TABLE 69 AUSTRALIA QUINOA MARKET, BY DISTRIBUTION CHANNEL, 2018-2032 (USD THOUSAND)
TABLE 70 AUSTRALIA OFFLINE IN QUINOA MARKET, BY DISTRIBUTION CHANNEL, 2018-2032 (USD THOUSAND)
TABLE 71 AUSTRALIA ONLINE IN QUINOA MARKET, BY DISTRIBUTION CHANNEL, 2018-2032 (USD THOUSAND)
TABLE 72 SOUTH KOREA QUINOA MARKET, BY TYPE, 2018-2032 (USD THOUSAND)
TABLE 73 SOUTH KOREA QUINOA MARKET, BY TYPE, 2018-2032 (USD THOUSAND) (KILO TONS)
TABLE 74 SOUTH KOREA SINGLE IN QUINOA MARKET, BY TYPE, 2018-2032 (USD THOUSAND)
TABLE 75 SOUTH KOREA QUINOA MARKET, BY NATURE, 2018-2032 (USD THOUSAND)
TABLE 76 SOUTH KOREA QUINOA MARKET, BY PRODUCT, 2018-2032 (USD THOUSAND)
TABLE 77 SOUTH KOREA QUINOA MARKET, BY PACKAGING TYPE, 2018-2032 (USD THOUSAND)
TABLE 78 SOUTH KOREA QUINOA MARKET, BY DISTRIBUTION CHANNEL, 2018-2032 (USD THOUSAND)
TABLE 79 SOUTH KOREA OFFLINE IN QUINOA MARKET, BY DISTRIBUTION CHANNEL, 2018-2032 (USD THOUSAND)
TABLE 80 SOUTH KOREA ONLINE IN QUINOA MARKET, BY DISTRIBUTION CHANNEL, 2018-2032 (USD THOUSAND)
TABLE 81 THAILAND QUINOA MARKET, BY TYPE, 2018-2032 (USD THOUSAND)
TABLE 82 THAILAND QUINOA MARKET, BY TYPE, 2018-2032 (USD THOUSAND) (KILO TONS)
TABLE 83 THAILAND SINGLE IN QUINOA MARKET, BY TYPE, 2018-2032 (USD THOUSAND)
TABLE 84 THAILAND QUINOA MARKET, BY NATURE, 2018-2032 (USD THOUSAND)
TABLE 85 THAILAND QUINOA MARKET, BY PRODUCT, 2018-2032 (USD THOUSAND)
TABLE 86 THAILAND QUINOA MARKET, BY PACKAGING TYPE, 2018-2032 (USD THOUSAND)
TABLE 87 THAILAND QUINOA MARKET, BY DISTRIBUTION CHANNEL, 2018-2032 (USD THOUSAND)
TABLE 88 THAILAND OFFLINE IN QUINOA MARKET, BY DISTRIBUTION CHANNEL, 2018-2032 (USD THOUSAND)
TABLE 89 THAILAND ONLINE IN QUINOA MARKET, BY DISTRIBUTION CHANNEL, 2018-2032 (USD THOUSAND)
TABLE 90 MALAYSIA QUINOA MARKET, BY TYPE, 2018-2032 (USD THOUSAND)
TABLE 91 MALAYSIA QUINOA MARKET, BY TYPE, 2018-2032 (USD THOUSAND) (KILO TONS)
TABLE 92 MALAYSIA SINGLE IN QUINOA MARKET, BY TYPE, 2018-2032 (USD THOUSAND)
TABLE 93 MALAYSIA QUINOA MARKET, BY NATURE, 2018-2032 (USD THOUSAND)
TABLE 94 MALAYSIA QUINOA MARKET, BY PRODUCT, 2018-2032 (USD THOUSAND)
TABLE 95 MALAYSIA QUINOA MARKET, BY PACKAGING TYPE, 2018-2032 (USD THOUSAND)
TABLE 96 MALAYSIA QUINOA MARKET, BY DISTRIBUTION CHANNEL, 2018-2032 (USD THOUSAND)
TABLE 97 MALAYSIA OFFLINE IN QUINOA MARKET, BY DISTRIBUTION CHANNEL, 2018-2032 (USD THOUSAND)
TABLE 98 MALAYSIA ONLINE IN QUINOA MARKET, BY DISTRIBUTION CHANNEL, 2018-2032 (USD THOUSAND)
TABLE 99 INDONESIA QUINOA MARKET, BY TYPE, 2018-2032 (USD THOUSAND)
TABLE 100 INDONESIA QUINOA MARKET, BY TYPE, 2018-2032 (USD THOUSAND) (KILO TONS)
TABLE 101 INDONESIA SINGLE IN QUINOA MARKET, BY TYPE, 2018-2032 (USD THOUSAND)
TABLE 102 INDONESIA QUINOA MARKET, BY NATURE, 2018-2032 (USD THOUSAND)
TABLE 103 INDONESIA QUINOA MARKET, BY PRODUCT, 2018-2032 (USD THOUSAND)
TABLE 104 INDONESIA QUINOA MARKET, BY PACKAGING TYPE, 2018-2032 (USD THOUSAND)
TABLE 105 INDONESIA QUINOA MARKET, BY DISTRIBUTION CHANNEL, 2018-2032 (USD THOUSAND)
TABLE 106 INDONESIA OFFLINE IN QUINOA MARKET, BY DISTRIBUTION CHANNEL, 2018-2032 (USD THOUSAND)
TABLE 107 INDONESIA ONLINE IN QUINOA MARKET, BY DISTRIBUTION CHANNEL, 2018-2032 (USD THOUSAND)
TABLE 108 PHILIPPINES QUINOA MARKET, BY TYPE, 2018-2032 (USD THOUSAND)
TABLE 109 PHILIPPINES QUINOA MARKET, BY TYPE, 2018-2032 (USD THOUSAND) (KILO TONS)
TABLE 110 PHILIPPINES SINGLE IN QUINOA MARKET, BY TYPE, 2018-2032 (USD THOUSAND)
TABLE 111 PHILIPPINES QUINOA MARKET, BY NATURE, 2018-2032 (USD THOUSAND)
TABLE 112 PHILIPPINES QUINOA MARKET, BY PRODUCT, 2018-2032 (USD THOUSAND)
TABLE 113 PHILIPPINES QUINOA MARKET, BY PACKAGING TYPE, 2018-2032 (USD THOUSAND)
TABLE 114 PHILIPPINES QUINOA MARKET, BY DISTRIBUTION CHANNEL, 2018-2032 (USD THOUSAND)
TABLE 115 PHILIPPINES OFFLINE IN QUINOA MARKET, BY DISTRIBUTION CHANNEL, 2018-2032 (USD THOUSAND)
TABLE 116 PHILIPPINES ONLINE IN QUINOA MARKET, BY DISTRIBUTION CHANNEL, 2018-2032 (USD THOUSAND)
TABLE 117 SINGAPORE QUINOA MARKET, BY TYPE, 2018-2032 (USD THOUSAND)
TABLE 118 SINGAPORE QUINOA MARKET, BY TYPE, 2018-2032 (USD THOUSAND) (KILO TONS)
TABLE 119 SINGAPORE SINGLE IN QUINOA MARKET, BY TYPE, 2018-2032 (USD THOUSAND)
TABLE 120 SINGAPORE QUINOA MARKET, BY NATURE, 2018-2032 (USD THOUSAND)
TABLE 121 SINGAPORE QUINOA MARKET, BY PRODUCT, 2018-2032 (USD THOUSAND)
TABLE 122 SINGAPORE QUINOA MARKET, BY PACKAGING TYPE, 2018-2032 (USD THOUSAND)
TABLE 123 SINGAPORE QUINOA MARKET, BY DISTRIBUTION CHANNEL, 2018-2032 (USD THOUSAND)
TABLE 124 SINGAPORE OFFLINE IN QUINOA MARKET, BY DISTRIBUTION CHANNEL, 2018-2032 (USD THOUSAND)
TABLE 125 SINGAPORE ONLINE IN QUINOA MARKET, BY DISTRIBUTION CHANNEL, 2018-2032 (USD THOUSAND)
TABLE 126 NEW ZEALAND QUINOA MARKET, BY TYPE, 2018-2032 (USD THOUSAND)
TABLE 127 NEW ZEALAND QUINOA MARKET, BY TYPE, 2018-2032 (USD THOUSAND) (KILO TONS)
TABLE 128 NEW ZEALAND SINGLE IN QUINOA MARKET, BY TYPE, 2018-2032 (USD THOUSAND)
TABLE 129 NEW ZEALAND QUINOA MARKET, BY NATURE, 2018-2032 (USD THOUSAND)
TABLE 130 NEW ZEALAND QUINOA MARKET, BY PRODUCT, 2018-2032 (USD THOUSAND)
TABLE 131 NEW ZEALAND QUINOA MARKET, BY PACKAGING TYPE, 2018-2032 (USD THOUSAND)
TABLE 132 NEW ZEALAND QUINOA MARKET, BY DISTRIBUTION CHANNEL, 2018-2032 (USD THOUSAND)
TABLE 133 NEW ZEALAND OFFLINE IN QUINOA MARKET, BY DISTRIBUTION CHANNEL, 2018-2032 (USD THOUSAND)
TABLE 134 NEW ZEALAND ONLINE IN QUINOA MARKET, BY DISTRIBUTION CHANNEL, 2018-2032 (USD THOUSAND)
TABLE 135 REST OF ASIA-PACIFIC QUINOA MARKET, BY TYPE, 2018-2032 (USD THOUSAND)
TABLE 136 REST OF ASIA-PACIFIC QUINOA MARKET, BY TYPE, 2018-2032 (USD THOUSAND) (KILO TONS)
List of Figure
FIGURE 1 ASIA-PACIFIC QUINOA MARKET
FIGURE 2 ASIA-PACIFIC QUINOA MARKET: DATA TRIANGULATION
FIGURE 3 ASIA-PACIFIC QUINOA MARKET: DROC ANALYSIS
FIGURE 4 ASIA-PACIFIC QUINOA MARKET: ASIA-PACIFIC VS REGIONAL MARKET ANALYSIS
FIGURE 5 ASIA-PACIFIC QUINOA MARKET: COMPANY RESEARCH ANALYSIS
FIGURE 6 ASIA-PACIFIC QUINOA MARKET: MULTIVARIATE MODELLING
FIGURE 7 ASIA-PACIFIC QUINOA MARKET: INTERVIEW DEMOGRAPHICS
FIGURE 8 ASIA-PACIFIC QUINOA MARKET: DBMR MARKET POSITION GRID
FIGURE 9 VENDOR SHARE ANALYSIS
FIGURE 10 ASIA-PACIFIC QUINOA MARKET: EXECUTIVE SUMMARY
FIGURE 11 ASIA-PACIFIC QUINOA MARKET: SEGMENTATION
FIGURE 12 TWO SEGMENTS COMPRISE THE ASIA-PACIFIC QUINOA MARKET, BY TYPE
FIGURE 13 STRATEGIC DECISIONS
FIGURE 14 RISING DEMAND FOR GLUTEN-FREE AND PLANT-BASED FOODS IS EXPECTED TO DRIVE THE ASIA-PACIFIC QUINOA MARKET IN THE FORECAST PERIOD
FIGURE 15 THE SINGLE SEGMENT IS EXPECTED TO ACCOUNT FOR THE LARGEST SHARE OF THE ASIA-PACIFIC QUINOA MARKET IN 2025 AND 2032
FIGURE 16 ASIA-PACIFIC LONG CHAIN POLYAMIDE MARKET, 2024-2032, AVERAGE SELLING PRICE (USD/KG)
FIGURE 17 PATENT FAMILIES
FIGURE 18 NUMBER OF INTERNATIONAL PATENT FAMILIES BY PUBLICATION YEAR
FIGURE 19 DRIVERS, RESTRAINTS, OPPORTUNITIES AND CHALLENGES OF INDONESIA ZEOLITE MARKET
FIGURE 20 ASIA-PACIFIC QUINOA MARKET, BY TYPE, 2018-2032 (USD THOUSAND)
FIGURE 21 ASIA-PACIFIC QUINOA MARKET, BY PRODUCT, 2018-2032 (USD THOUSAND)
FIGURE 22 ASIA-PACIFIC QUINOA MARKET, BY PACKAGING TYPE, 2018-2032 (USD THOUSAND)
FIGURE 23 ASIA-PACIFIC QUINOA MARKET, BY NATURE, 2018-2032 (USD THOUSAND)
FIGURE 24 ASIA-PACIFIC QUINOA MARKET, BY DISTRIBUTION CHANNEL, 2018-2032 (USD THOUSAND)
FIGURE 25 ASIA-PACIFIC QUINOA MARKET: SNAPSHOT (2023)
FIGURE 26 ASIA-PACIFIC QUINOA MARKET: COMPANY SHARE 2024 (%)
Asia Pacific Quinoa Market, Supply Chain Analysis and Ecosystem Framework
To support market growth and help clients navigate the impact of geopolitical shifts, DBMR has integrated in-depth supply chain analysis into its Asia Pacific Quinoa Market research reports. This addition empowers clients to respond effectively to global changes affecting their industries. The supply chain analysis section includes detailed insights such as Asia Pacific Quinoa Market consumption and production by country, price trend analysis, the impact of tariffs and geopolitical developments, and import and export trends by country and HSN code. It also highlights major suppliers with data on production capacity and company profiles, as well as key importers and exporters. In addition to research, DBMR offers specialized supply chain consulting services backed by over a decade of experience, providing solutions like supplier discovery, supplier risk assessment, price trend analysis, impact evaluation of inflation and trade route changes, and comprehensive market trend analysis.
Data collection and base year analysis are done using data collection modules with large sample sizes. The stage includes obtaining market information or related data through various sources and strategies. It includes examining and planning all the data acquired from the past in advance. It likewise envelops the examination of information inconsistencies seen across different information sources. The market data is analysed and estimated using market statistical and coherent models. Also, market share analysis and key trend analysis are the major success factors in the market report. To know more, please request an analyst call or drop down your inquiry.
The key research methodology used by DBMR research team is data triangulation which involves data mining, analysis of the impact of data variables on the market and primary (industry expert) validation. Data models include Vendor Positioning Grid, Market Time Line Analysis, Market Overview and Guide, Company Positioning Grid, Patent Analysis, Pricing Analysis, Company Market Share Analysis, Standards of Measurement, Global versus Regional and Vendor Share Analysis. To know more about the research methodology, drop in an inquiry to speak to our industry experts.
Data Bridge Market Research is a leader in advanced formative research. We take pride in servicing our existing and new customers with data and analysis that match and suits their goal. The report can be customized to include price trend analysis of target brands understanding the market for additional countries (ask for the list of countries), clinical trial results data, literature review, refurbished market and product base analysis. Market analysis of target competitors can be analyzed from technology-based analysis to market portfolio strategies. We can add as many competitors that you require data about in the format and data style you are looking for. Our team of analysts can also provide you data in crude raw excel files pivot tables (Fact book) or can assist you in creating presentations from the data sets available in the report.


