
Asia Pacific Recovered Carbon Black Rcb Market
Market Size in USD Million
 USD
49.02 Million
USD
185.51 Million
2024
2032
USD
49.02 Million
USD
185.51 Million
2024
2032
| 2025 - 2032 | |
| USD 49.02 Million | |
| USD 185.51 Million | |
| % | |
|
Asia-Pacific Recovered Carbon Black (rCB) Market Size
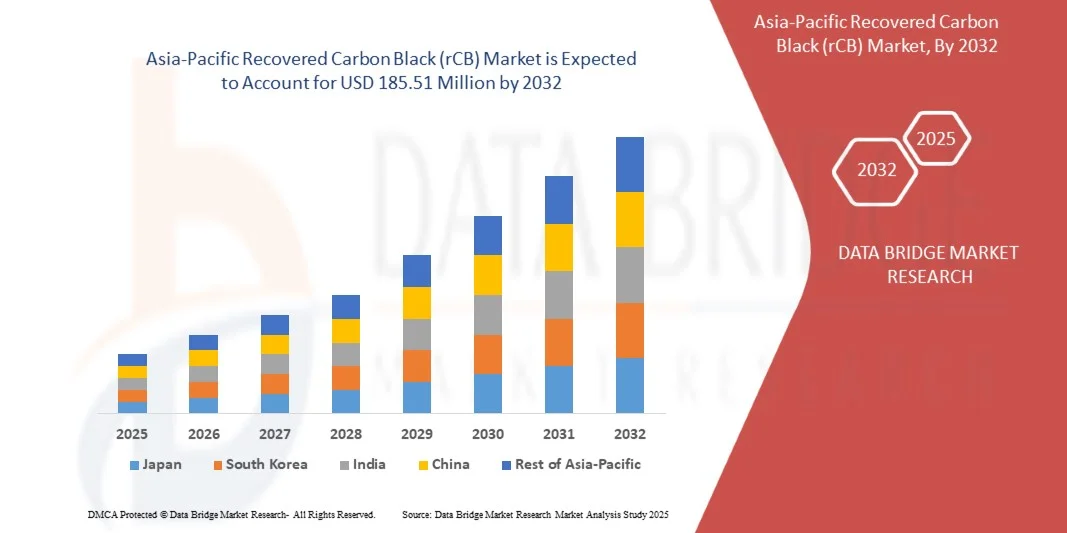
- The Asia-Pacific Recovered Carbon Black (rCB) Market size was valued at USD 49.02 million in 2024 and is expected to reach USD 185.51 million by 2032, at a CAGR of 18.1% during the forecast period
- The market growth is largely fueled by increasing environmental regulations and sustainability initiatives, which are encouraging manufacturers to adopt recycled materials such as recovered carbon black. Growing awareness of the environmental impact of virgin carbon black production is driving industries, particularly tires, plastics, and coatings, to integrate rCB into their production processes, thereby boosting market demand
- Furthermore, rising demand for high-performance and cost-effective alternatives to virgin carbon black is establishing rCB as a viable and sustainable option across multiple industrial applications. For instance, Continental AG’s collaboration with Pyrum Innovations AG to use rCB in tire manufacturing exemplifies how strategic partnerships and industrial adoption are accelerating market growth
Asia-Pacific Recovered Carbon Black (rCB) Market Analysis
- Recovered carbon black, produced through the pyrolysis of end-of-life tires and other rubber waste, is increasingly recognized as a critical raw material in circular economy initiatives. Its ability to provide comparable performance to virgin carbon black in reinforcing rubber, plastics, and coatings enhances its appeal among manufacturers seeking sustainable production solutions
- The escalating adoption of rCB is also supported by technological advancements in processing and pelletizing, which improve material consistency, handling, and transportation. Innovations such as Pyrum Innovations AG’s pelletizer operations in Germany enable more efficient integration of rCB into industrial supply chains, enhancing its market scalability
- China dominated the Asia-Pacific Recovered Carbon Black (rCB) Market in 2024, due to its expansive tire and automotive manufacturing base, growing industrial sector, and increasing emphasis on sustainable production practices
- India is expected to be the fastest growing country in the Asia-Pacific Recovered Carbon Black (rCB) Market during the forecast period due to rising automotive production, expanding tire and rubber industries, and growing adoption of recycled materials
- Primary carbon black segment dominated the market with a market share of 70.5% in 2024, due to its widespread use as a reinforcing filler in rubber products, particularly tires. Its consistent particle size, high purity, and performance in enhancing durability and wear resistance make it the preferred choice for many tire and rubber product manufacturers. The segment benefits from established supply chains and manufacturing processes, ensuring reliability for large-scale applications. Its versatility across both tire and non-tire rubber products strengthens its market dominance. In addition, ongoing research into optimized formulations further supports its widespread adoption. Manufacturers favor primary carbon black due to predictable performance and cost efficiency
Report Scope and Asia-Pacific Recovered Carbon Black (rCB) Market Segmentation
|
Attributes |
Recovered Carbon Black (rCB) Key Market Insights |
|
Segments Covered |
|
|
Countries Covered |
Asia-Pacific
|
|
Key Market Players |
|
|
Market Opportunities |
|
|
Value Added Data Infosets |
In addition to the insights on market scenarios such as market value, growth rate, segmentation, geographical coverage, and major players, the market reports curated by the Data Bridge Market Research also include import export analysis, production capacity overview, production consumption analysis, price trend analysis, climate change scenario, supply chain analysis, value chain analysis, raw material/consumables overview, vendor selection criteria, PESTLE Analysis, Porter Analysis, and regulatory framework. |
Asia-Pacific Recovered Carbon Black (rCB) Market Trends
“Rising Use of Recovered Carbon Black in Tires and Industrial Applications”
- The Asia-Pacific Recovered Carbon Black (rCB) Market is experiencing strong growth driven by increased adoption in tire manufacturing and various industrial applications. rCB, derived mainly from end-of-life tires through pyrolysis, provides a sustainable alternative to virgin carbon black, reducing environmental impact and aligning with circular economy principles
- For instance, leading tire manufacturers such as Michelin have committed to integrating up to 40% recycled materials, including rCB, in new tire production by 2030. This growing demand reflects the industry's push toward sustainability while maintaining product performance and cost efficiency
- Technological advancements in pyrolysis and recovery processes have improved rCB quality, expanding its application beyond tires into coatings, plastics, and inks. The material’s comparable durability and performance to virgin carbon black make it attractive for cost-sensitive and eco-conscious manufacturers
- In addition, government regulations mandating tire recycling and increasing environmental awareness among consumers are propelling rCB adoption worldwide. The push to reduce landfill waste and carbon emissions is fostering industry investment and collaboration in scaling rCB production capacity
- Rising industrialization in emerging economies coupled with stricter ESG mandates in developed regions increases demand for recycled raw materials such as rCB. These market dynamics are driving innovation, expanding rCB quality grades, and encouraging circular supply chain models
- The transition toward sustainable carbon black sourcing through recovered materials is expected to continue, reshaping the carbon black market landscape, offering economic benefits while contributing to waste reduction and emissions mitigation
Asia-Pacific Recovered Carbon Black (rCB) Market Dynamics
Driver
“Strong Push from Environmental Regulations and Sustainability Initiatives”
- Increasingly stringent environmental regulations and sustainability goals are primary drivers accelerating the recovered carbon black market. Policies aimed at reducing landfill waste, cutting carbon emissions, and promoting recycled materials compel tire, rubber, and plastic manufacturers to incorporate rCB in their products
- For instance, the European Union’s Circular Economy Action Plan and similar frameworks in North America incentivize using rCB by imposing mandates on tire recycling and recycled content levels. These initiatives encourage manufacturers and suppliers such as Klean Carbon, Bolder Industries, and Scandinavian Enviro Systems to develop advanced, high-quality rCB products
- Sustainability initiatives by OEMs such as Michelin and Bridgestone are pushing the automotive and tire sectors to meet ambitious targets for recycled material integration, further boosting rCB adoption. This shift supports corporate environmental responsibility while offering a cost-saving alternative to dependency on fossil-based virgin carbon black
- In addition, growing investor focus on ESG performance and tightening carbon pricing schemes motivate increased capital flow toward modular rCB pyrolysis plants and circular supply chain solutions. These drivers ensure long-term growth prospects despite market fluctuations
- Continued regulatory and market momentum toward low-carbon and circular manufacturing ecosystems positions rCB as a critical material for sustainable industrial development across multiple sectors
Restraint/Challenge
“Inconsistent Quality Compared to Virgin Carbon Black”
- One of the key challenges in the recovered carbon black market is the inconsistency in quality compared to virgin carbon black. Variability in feedstock composition, recovery process conditions, and contamination levels can affect particle size distribution, purity, and overall material performance
- For instance, manufacturers face difficulties in maintaining uniformity due to differences in tire scrap input and incomplete separation of additives or metals during pyrolysis. This inconsistency can result in variations in mechanical strength and dispersion characteristics critical for tire and rubber applications
- In addition, achieving performance parity with virgin carbon black in high-value specialty uses requires advanced processing and refining capabilities, elevating production costs. Producers must invest continually in quality control systems and process optimization to meet stringent OEM specifications
- Supply chain integration challenges, including feedstock availability, logistics, and output standardization, further complicate consistent rCB quality assurance. These barriers can limit adoption rates and restrict rCB use in premium or sensitive applications
- Ongoing R&D efforts focus on improving pyrolysis technologies, refining post-treatment processes, and developing robust quality assessment protocols. Addressing quality inconsistency will be crucial for scaling recovered carbon black into wider markets and ensuring long-term competitive viability
Asia-Pacific Recovered Carbon Black (rCB) Market Scope
The market is segmented on the basis of type, grade, application, and end-user.
- By Type
On the basis of type, the recovered carbon black market is segmented into primary carbon black and inorganic ash. The primary carbon black segment holds the largest market revenue share of 70.5% in 2024, driven by its widespread use as a reinforcing filler in rubber products, particularly tires. Its consistent particle size, high purity, and performance in enhancing durability and wear resistance make it the preferred choice for many tire and rubber product manufacturers. The segment benefits from established supply chains and manufacturing processes, ensuring reliability for large-scale applications. Its versatility across both tire and non-tire rubber products strengthens its market dominance. In addition, ongoing research into optimized formulations further supports its widespread adoption. Manufacturers favor primary carbon black due to predictable performance and cost efficiency.
The inorganic ash segment is expected to witness the fastest growth from 2025 to 2032, due to its applications in specialty industries requiring filler materials with specific chemical properties. Industries such as specialty chemicals, electronics, and high-performance plastics demand carbon black with controlled composition and ash content. Its growth is also fueled by increased interest in sustainable and recycled materials that meet stringent environmental regulations. Inorganic ash provides unique thermal and electrical properties, making it suitable for advanced industrial applications. Rising adoption in niche sectors requiring high-performance fillers contributes to the accelerating market share. Manufacturers are increasingly exploring inorganic ash for custom formulations, which supports its projected expansion.
- By Grade
On the basis of grade, the recovered carbon black market is segmented into commodity and specialty. The commodity grade dominated the market in 2024 owing to its broad applicability in the tire and non-tire rubber industries, where large volumes are required at competitive prices. Its standardized properties, cost-effectiveness, and easy availability make it the preferred choice for high-volume production processes. Commodity grade carbon black supports a wide range of rubber applications, including industrial belts, hoses, and molded products. The segment benefits from economies of scale and established manufacturing infrastructure. Consistent quality and reliable supply chains help maintain its leading revenue share. In addition, its performance in general-purpose applications ensures ongoing demand across multiple end-use industries.
The specialty grade is expected to witness the fastest growth from 2025 to 2032, driven by demand from high-performance applications such as inks, coatings, and plastics, where enhanced properties such as improved dispersion and specific particle size are critical. Specialty grades are engineered to meet strict quality and performance requirements, often customized for precise industrial needs. The growing demand for sustainable and high-efficiency materials in advanced applications accelerates its adoption. Industries such as automotive coatings, electronics, and specialty plastics rely on these grades for improved functionality. Research into innovative processing methods further supports specialty carbon black growth. In addition, increasing awareness about eco-friendly and recycled materials fuels interest in high-performance grades. Specialty carbon black ensures superior end-product quality, which drives its market expansion.
- By Application
On the basis of application, the recovered carbon black market is segmented into tire, non-tire rubber, plastics, inks, coatings, and others. The tire segment accounted for the largest market revenue share in 2024, fueled by the rising demand for automotive vehicles and the corresponding need for durable, high-performance tires. Tires require carbon black for reinforcement, wear resistance, and longevity, making it a critical raw material. The segment benefits from continuous automotive production and replacement cycles worldwide. High durability and performance standards in tires further strengthen carbon black demand. In addition, increasing vehicle sales in emerging economies contribute to the segment’s revenue share. Manufacturers focus on optimized formulations to meet performance, cost, and sustainability requirements, supporting segment dominance.
The inks and coatings segment is expected to witness the fastest growth from 2025 to 2032, supported by increasing use in printing and packaging industries seeking sustainable and cost-effective alternatives to virgin carbon black. Recovered carbon black provides suitable color strength, opacity, and consistency for various inks and coatings. The shift towards eco-friendly printing solutions and sustainable packaging drives adoption. Growth in e-commerce and packaging demand further fuels the requirement for high-quality pigments. Industries are exploring recycled carbon black for reducing carbon footprint while maintaining product performance. Technological advancements in dispersion and formulation improve compatibility with different substrates, accelerating market growth. Increasing regulatory focus on sustainability reinforces the adoption of recovered carbon black in these applications.
- By End-User
On the basis of end-user, the recovered carbon black market is segmented into transportation, industrial, printing and packaging, building and construction, and others. The transportation segment holds the largest revenue share in 2024, driven by the automotive industry’s heavy reliance on carbon black for tire manufacturing and other rubber components. Automotive applications require high durability, wear resistance, and consistency, which recovered carbon black provides efficiently. The segment also benefits from growing vehicle production and replacement demand. Tires, belts, hoses, and molded rubber components extensively use carbon black to enhance performance. In addition, cost-efficiency and environmental considerations strengthen its adoption in transportation applications. Ongoing innovations in automotive materials support the segment’s leading position.
The printing and packaging segment is expected to witness the fastest growth from 2025 to 2032, due to the rising demand for eco-friendly printing inks and sustainable packaging solutions. Recovered carbon black offers superior pigment properties while enabling circular economy practices. Growth in packaging for e-commerce, food, and consumer goods fuels demand. Manufacturers are increasingly integrating recycled carbon black to comply with environmental regulations and reduce carbon footprints. The industrial segment also benefits from recovered carbon black in applications such as molded rubber products, coatings, and specialty plastics. Rising awareness about sustainability and cost savings accelerates adoption in both printing and packaging industries. Expanding end-user industries are expected to continue driving market growth.
Asia-Pacific Recovered Carbon Black (rCB) Market Regional Analysis
- China dominated the Asia-Pacific Recovered Carbon Black (rCB) Market with the largest revenue share in 2024, driven by its expansive tire and automotive manufacturing base, growing industrial sector, and increasing emphasis on sustainable production practices
- Robust government regulations promoting recycling and circular economy initiatives, combined with rising demand for eco-friendly and high-performance materials, reinforce China’s leadership in the regional market
- The presence of leading domestic rCB producers, collaborations with global tire and rubber manufacturers, and the adoption of advanced pyrolysis and pelletizing technologies continue to consolidate China’s dominant position during the forecast period. Expanding industrial applications in plastics, coatings, and printing further strengthen market penetration across urban and industrial hubs
Japan Recovered Carbon Black Market Insight
The Japan market is anticipated to grow steadily from 2025 to 2032, supported by its advanced automotive and industrial sectors and strong emphasis on sustainability and environmental compliance. Japanese manufacturers are increasingly adopting high-quality rCB in tires, plastics, and specialty applications to reduce carbon footprints and improve product performance. Continuous R&D investments, technological advancements in pyrolysis, and collaborations between domestic and global rCB producers reinforce the market’s steady growth outlook. The demand for precision-engineered and high-consistency rCB grades is rising due to stringent quality standards and innovation-driven production processes. Japan’s focus on sustainable manufacturing and high-performance materials underpins its strong regional positioning.
India Recovered Carbon Black Market Insight
India is projected to register the fastest CAGR in the Asia-Pacific recovered carbon black market during 2025–2032, fueled by rising automotive production, expanding tire and rubber industries, and growing adoption of recycled materials. Government initiatives promoting circular economy practices, environmental sustainability, and end-of-life tire recycling are accelerating market growth. The demand for cost-effective, high-performance rCB in tires, industrial rubber, and plastics is particularly strong among emerging manufacturers. Expanding pyrolysis and recycling infrastructure, coupled with partnerships with global rCB technology providers, is enhancing supply and accessibility. Rising awareness of sustainability, urbanization, and industrial growth ensure India’s emergence as the fastest-growing market in the region.
Asia-Pacific Recovered Carbon Black (rCB) Market Share
The Recovered Carbon Black (rCB) industry is primarily led by well-established companies, including:
- Tyrepress (U.K.)
- Black Bear Carbon B.V. (Netherlands)
- Klean Industries (Canada)
- Radhe Group of Energy (India)
- Scandinavian Enviro Systems AB (Sweden)
- DVA Renewable Energy JSC. (Vietnam)
- Bolder Industries Corporate (U.S.)
- Wild Bear Carbon B.V. (Netherlands)
- Greetings Green Carbon (India)
- Pyrolyx AG (Germany)
- Enrestec Inc. (Taiwan)
- Coordinated Resource Recovery, Inc. (U.S.)
- Delta-Energy, LLC (U.S.)
- Alpha Carbone (France)
- SR2O Holdings, LLC (U.S.)
Latest Developments in Asia-Pacific Recovered Carbon Black (rCB) Market
- In August 2025, ASTM International proposed a new standard (WK91069) specifically for recovered carbon black, designed to reduce testing time and improve quality assurance capabilities. The introduction of a dedicated standard enhances confidence among manufacturers and recyclers by ensuring consistent quality and performance of rCB products. This development also mitigates one of the key barriers limiting the adoption of recovered carbon black in high-performance applications such as tires, coatings, and specialty plastics. In addition, the standard is expected to facilitate regulatory approvals and encourage broader acceptance across global markets, thereby driving market growth
- In June 2025, Nexen Tire announced a long‑term supply agreement with LD Carbon Co., Ltd. for recovered carbon black, enabling the adoption of rCB across its global tire manufacturing plants. This agreement strengthens the demand side of the market by providing a reliable offtake partner, which encourages rCB producers to scale up operations. It also supports the integration of sustainable materials into mainstream tire production, enhancing the commercial viability of recycled carbon black. Furthermore, the deal demonstrates growing industry confidence in rCB as a high-performance and cost-effective alternative to virgin carbon black, likely accelerating adoption across other major tire manufacturers
- In June 2024, Klean Industries announced plans to expand rCB processing capacity in India and Malaysia by establishing four new plants designed to convert end-of-life tire char into high-value recovered carbon black. This expansion directly addresses supply-side constraints in key regions, ensuring a more reliable and scalable production of rCB. Increased processing capacity also allows manufacturers in Asia-Pacific to access high-quality recycled materials, accelerating the use of rCB in tires, plastics, and rubber products. The move underscores the strategic importance of regional production hubs in supporting global market growth while promoting sustainable recycling practices
- In May 2022, Pyrum Innovations AG began test operations of a new pelletizer at its facility in Germany, enabling the conversion of recovered carbon black into pellet form. This advancement improves transport efficiency, reduces handling complexity, and simplifies storage logistics, which collectively enhance market scalability. By offering a more convenient form factor for industrial use, the pelletized rCB increases adoption potential across various applications, including tires, plastics, and coatings. The innovation also demonstrates the ongoing technological improvements aimed at optimizing rCB usability and reducing operational costs
- In March 2022, Continental AG expanded its partnership with Pyrum Innovations AG to advance the recycling of end-of-life tires using pyrolysis technology. This collaboration focuses on producing high-quality recovered carbon black for use in Continental’s tire manufacturing operations. The initiative supports the company’s sustainability objectives and highlights the growing industry trend of integrating recycled materials into production lines. By leveraging rCB in tire manufacturing, Continental reduces environmental impact and also sets an instance for increased adoption across the automotive and rubber industries, fostering overall market growth
SKU-

- Interactive Data Analysis Dashboard
- Company Analysis Dashboard for high growth potential opportunities
- Research Analyst Access for customization & queries
- Competitor Analysis with Interactive dashboard
- Latest News, Updates & Trend analysis
- Harness the Power of Benchmark Analysis for Comprehensive Competitor Tracking
Asia Pacific Recovered Carbon Black Rcb Market, Supply Chain Analysis and Ecosystem Framework
To support market growth and help clients navigate the impact of geopolitical shifts, DBMR has integrated in-depth supply chain analysis into its Asia Pacific Recovered Carbon Black Rcb Market research reports. This addition empowers clients to respond effectively to global changes affecting their industries. The supply chain analysis section includes detailed insights such as Asia Pacific Recovered Carbon Black Rcb Market consumption and production by country, price trend analysis, the impact of tariffs and geopolitical developments, and import and export trends by country and HSN code. It also highlights major suppliers with data on production capacity and company profiles, as well as key importers and exporters. In addition to research, DBMR offers specialized supply chain consulting services backed by over a decade of experience, providing solutions like supplier discovery, supplier risk assessment, price trend analysis, impact evaluation of inflation and trade route changes, and comprehensive market trend analysis.
Data collection and base year analysis are done using data collection modules with large sample sizes. The stage includes obtaining market information or related data through various sources and strategies. It includes examining and planning all the data acquired from the past in advance. It likewise envelops the examination of information inconsistencies seen across different information sources. The market data is analysed and estimated using market statistical and coherent models. Also, market share analysis and key trend analysis are the major success factors in the market report. To know more, please request an analyst call or drop down your inquiry.
The key research methodology used by DBMR research team is data triangulation which involves data mining, analysis of the impact of data variables on the market and primary (industry expert) validation. Data models include Vendor Positioning Grid, Market Time Line Analysis, Market Overview and Guide, Company Positioning Grid, Patent Analysis, Pricing Analysis, Company Market Share Analysis, Standards of Measurement, Global versus Regional and Vendor Share Analysis. To know more about the research methodology, drop in an inquiry to speak to our industry experts.
Data Bridge Market Research is a leader in advanced formative research. We take pride in servicing our existing and new customers with data and analysis that match and suits their goal. The report can be customized to include price trend analysis of target brands understanding the market for additional countries (ask for the list of countries), clinical trial results data, literature review, refurbished market and product base analysis. Market analysis of target competitors can be analyzed from technology-based analysis to market portfolio strategies. We can add as many competitors that you require data about in the format and data style you are looking for. Our team of analysts can also provide you data in crude raw excel files pivot tables (Fact book) or can assist you in creating presentations from the data sets available in the report.


