
Asia Pacific Semiconductor Ip Market
Market Size in USD Billion
 USD
2.41 Billion
USD
4.07 Billion
2025
2033
USD
2.41 Billion
USD
4.07 Billion
2025
2033
| 2026 - 2033 | |
| USD 2.41 Billion | |
| USD 4.07 Billion | |
| % | |
|
Asia-Pacific Semiconductor IP Market Overview
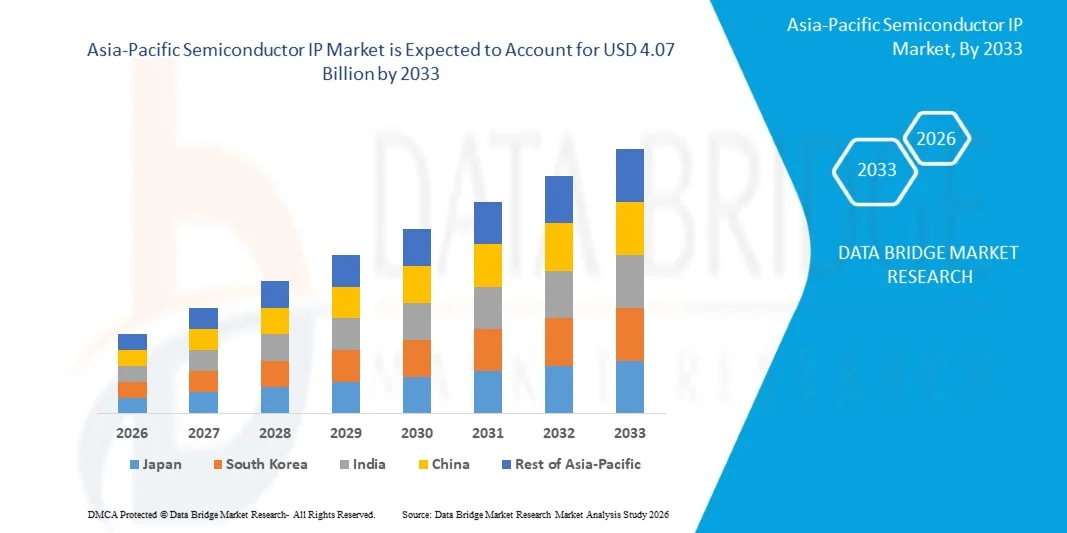
The Asia-Pacific Semiconductor IP market was valued at USD 2.41 Billion in 2025 and is projected to reach USD 4.07 Billion by 2033, growing at a CAGR of 6.8% from 2026 to 2033. The market is experiencing consistent growth driven by increasing demand for advanced system-on-chip (SoC) designs, rapid expansion of AI and high-performance computing technologies, and rising adoption of semiconductor solutions across automotive, consumer electronics, and telecommunications industries. Growing complexity in chip architectures and increasing preference for reusable and cost-efficient IP cores are further supporting market expansion across global semiconductor ecosystems.
The increasing global demand for connected devices, electric vehicles, data centers, and next-generation communication technologies is compelling semiconductor manufacturers to adopt advanced IP solutions for faster chip development and improved performance efficiency. Semiconductor IP providers are increasingly focusing on processor, memory, wireless, and interface IP solutions to support emerging applications in AI computing, IoT infrastructure, and autonomous mobility systems. Rising investments in semiconductor fabrication, advanced process nodes, and custom chip development are further accelerating adoption of semiconductor intellectual property solutions across markets
Key Market Trends & Insights
- China dominated the Asia-Pacific Semiconductor IP market with the largest revenue share of 35.5% in 2025, supported by its strong semiconductor manufacturing ecosystem, large-scale electronics production base, and increasing investments in domestic chip design capabilities
- The soft form segment led the market with a 63.4% share in 2025, driven by its flexibility, scalability, and ease of integration into multiple semiconductor designs
- India is expected to be the fastest-growing country at a CAGR of 20.5% from 2026 to 2033, fueled by rising government support for domestic semiconductor manufacturing and increasing investments in chip design and electronics production capabilities
- Wireless SIP is the fastest-growing type, projected to register a CAGR of 14.2% from 2026 to 2033, supported by rapid expansion of 5G infrastructure, IoT connectivity, and next-generation wireless communication technologies
- The direct sources segment dominated the channel category with a 67.2% revenue share in 2025, led by strong preference among semiconductor companies for direct collaboration with IP vendors to ensure technical customization and long-term support services
- Licensing accounted for 58.1% of the market in 2025, preferred by rising demand for third-party semiconductor design solutions that reduce in-house development costs and accelerate product commercialization
- The royalty segment is the fastest-growing IP source category, with a CAGR of 13.1% from 2026 to 2033, driven by the increasing commercialization of high-volume semiconductor products utilizing licensed intellectual property
Market Size & Forecast
- Market Value (2025): USD 2.41 Billion
- Expected Market Value (2033): USD 4.07 Billion
- Forecast CAGR (2026–2033): 6.8%
- Leading Country in 2025: China
- Fastest Growing Country: India
Report Scope and Asia-Pacific Semiconductor IP Market Segmentation
|
Attributes |
Semiconductor IP Key Market Insights |
|
Segments Covered |
|
|
Countries Covered |
Asia-Pacific · China · Japan · India · South Korea · Singapore · Malaysia · Australia · Thailand · Indonesia · Philippines · Rest of Asia-Pacific |
|
Key Market Players |
· Arm Holdings (U.K.) · Synopsys, Inc. (U.S.) · Cadence Design Systems, Inc. (U.S.) · Imagination Technologies (U.K.) · Rambus Inc. (U.S.) · CEVA, Inc. (U.S.) · VeriSilicon Holdings Co., Ltd. (China) · Faraday Technology Corporation (Taiwan) · Achronix Semiconductor Corporation (U.S.) · Silvaco Group, Inc. (U.S.) · eMemory Technology Inc. (Taiwan) · Sonics, Inc. (U.S.) · Lattice Semiconductor Corporation (U.S.) · Alphawave Semi (U.K.) · Arteris, Inc. (U.S.) · Mentor Graphics Corporation (U.S.) · Intel Corporation (U.S.) · NVIDIA Corporation (U.S.) · Advanced Micro Devices, Inc. (U.S.) · T2M-IP (India) |
|
Market Opportunities |
· Rising Demand for Semiconductor IP in Autonomous Vehicles · Growing Adoption of RISC-V Architectures · Expansion of 5G and Edge Computing Infrastructure |
|
Value Added Data Infosets |
In addition to the insights on market scenarios such as market value, growth rate, segmentation, geographical coverage, and major players, the market reports curated by the Data Bridge Market Research also include in-depth expert analysis, geographically represented company-wise production and capacity, network layouts of distributors and partners, detailed and updated price trend analysis and deficit analysis of supply chain and demand. |
Asia-Pacific Semiconductor IP Market Trends
Trend: Rising Adoption of AI-Based Semiconductor IP
Semiconductor companies across Asia-Pacific are increasingly integrating AI-based semiconductor IP solutions to support growing demand for high-performance computing, edge AI, autonomous systems, and intelligent consumer electronics. AI accelerators, neural processing units, and advanced processor IP cores are witnessing strong adoption across smartphones, automotive electronics, industrial automation, and data center applications. The region is also experiencing rising investments in AI chip development and advanced semiconductor manufacturing capabilities, particularly in China, Taiwan, South Korea, and India. Increasing deployment of AI-enabled IoT devices and generative AI infrastructure is further accelerating demand for customizable semiconductor IP architectures.
Companies such as Samsung Electronics and MediaTek are actively expanding AI semiconductor capabilities through advanced processor and connectivity IP integration for smartphones, edge computing, and automotive applications across Asia-Pacific markets.
Asia-Pacific Semiconductor IP Market Dynamics
Key Market Driver: Growing Demand for Advanced SoC Designs
The growing complexity of modern electronic devices is significantly increasing demand for advanced system-on-chip designs across consumer electronics, automotive, telecommunications, and AI computing industries. Semiconductor manufacturers are increasingly utilizing licensed IP cores to accelerate chip development, improve scalability, and reduce overall design costs and time-to-market. Rising adoption of 5G smartphones, AI processors, autonomous vehicle systems, and high-performance computing infrastructure is further driving demand for configurable processor, memory, and interface IP solutions. Increasing investments in advanced semiconductor fabrication technologies across Asia-Pacific and North America are also strengthening market expansion.
Major companies such as Apple Inc., NVIDIA Corporation, and Qualcomm Incorporated are increasingly utilizing advanced semiconductor IP architectures to develop high-performance AI, graphics, and mobile processing chipsets for markets
Key Restraint/Challenge: Increasing Complexity in Chip Design and Verification
A major challenge in the Semiconductor IP market is the rising complexity associated with advanced chip design, verification, and integration processes across modern semiconductor architectures. Semiconductor companies are facing increasing difficulties in ensuring compatibility, security, and performance optimization while integrating multiple IP blocks within advanced SoC platforms. Transition toward smaller process nodes such as 5nm, 3nm, and upcoming 2nm technologies is significantly increasing design validation requirements, engineering costs, and development timelines. Growing cybersecurity concerns and increasing verification workloads for AI and automotive chips are further complicating semiconductor product development.
In 2025, Intel Corporation and TSMC continued expanding investments in advanced design verification and next-generation chip manufacturing technologies to address increasing semiconductor design complexity and improve development efficiency across high-performance computing applications.
Key Market Opportunity: Growing Adoption of RISC-V Architectures
The increasing adoption of RISC-V open-standard processor architectures is creating significant growth opportunities for the Semiconductor IP market globally. Semiconductor companies are increasingly utilizing RISC-V-based IP solutions to develop customizable, cost-efficient, and power-optimized processors for applications including AI computing, automotive electronics, industrial automation, and IoT devices. The open-source nature of RISC-V enables semiconductor developers to reduce licensing dependency while improving flexibility for application-specific chip development. Growing government support for domestic semiconductor innovation and processor independence is further accelerating adoption across Asia-Pacific and Europe.
Companies such as SiFive and Alibaba Group are actively investing in RISC-V processor development and ecosystem expansion, supporting next-generation semiconductor innovation across data centers, AI infrastructure, and connected device applications.
Asia-Pacific Semiconductor IP Market Scope
The Semiconductor IP market is segmented on the basis of type, form, IP Source, channel, and end-user.
- By Type
On the basis of type, the Semiconductor IP market is segmented into CPU SIP, Wired SIP, GPU SIP, Memory SIP, DSP SIP, Library SIP, Infrastructure SIP, Digital SIP, Analog SIP, Wireless SIP, and Others. The CPU SIP segment dominated the market with the largest share of 28.7% in 2025, driven by rising integration of advanced processors across consumer electronics, automotive systems, and AI-enabled computing platforms. Increasing demand for high-performance and energy-efficient chip architectures is encouraging semiconductor manufacturers to adopt licensed CPU intellectual property for faster product development cycles. The segment benefits from strong deployment in smartphones, data centers, and edge computing devices where scalable processing capabilities are essential. Continuous advancements in multicore processor technologies and growing investments in customized SoC development further strengthen segment dominance. Expanding adoption of AI accelerators and embedded computing solutions across industrial applications continues to reinforce long-term growth opportunities for CPU SIP providers.
The Wireless SIP segment is projected to register the fastest growth at a CAGR of 14.2% from 2026 to 2033, driven by rapid expansion of 5G infrastructure, IoT connectivity, and next-generation wireless communication technologies. Semiconductor manufacturers are increasingly integrating wireless IP solutions into connected devices to support faster data transmission and lower power consumption. Rising deployment of smart devices, autonomous vehicles, and industrial IoT systems is accelerating demand for advanced wireless semiconductor architectures. Advancements in Wi-Fi 7, Bluetooth Low Energy, and satellite communication technologies are further supporting innovation within the segment. Increasing investments in connected healthcare devices and smart consumer electronics are expected to significantly boost adoption across global markets.
- By Form
On the basis of form, the Semiconductor IP market is segmented into Soft Form and Hard Form. The Soft Form segment dominated the market with the largest share of 63.4% in 2025, supported by its flexibility, scalability, and ease of integration into multiple semiconductor designs. Soft IP cores are widely preferred by chip manufacturers due to their ability to be synthesized and customized according to application-specific requirements. Increasing demand for cost-efficient semiconductor development and shorter time-to-market strategies is accelerating adoption across consumer electronics and telecommunications industries. The segment also benefits from growing use in AI processors, automotive chips, and embedded systems requiring adaptable architectures. Rising demand for reusable and configurable semiconductor solutions continues to strengthen the long-term dominance of the Soft Form segment.
The Hard Form segment is projected to register the fastest growth at a CAGR of 12.5% from 2026 to 2033, driven by increasing demand for optimized performance, lower power consumption, and enhanced reliability in advanced chip manufacturing. Hard IP solutions provide pre-validated physical layouts that improve design accuracy and manufacturing efficiency for semiconductor companies. Growing adoption of advanced nodes such as 5nm and 3nm technologies is accelerating the need for high-performance hard IP blocks in data centers and AI computing applications. Expansion of automotive semiconductor production and high-speed networking infrastructure is further supporting segment growth. Increasing focus on reducing chip design complexity and ensuring predictable silicon performance is expected to accelerate adoption globally.
- By IP Source
On the basis of IP source, the Semiconductor IP market is segmented into Licensing and Royalty. The Licensing segment dominated the market with the largest share of 58.1% in 2025, driven by rising demand for third-party semiconductor design solutions that reduce in-house development costs and accelerate product commercialization. Semiconductor manufacturers increasingly prefer licensing agreements to access advanced processor, connectivity, and memory architectures without extensive research investments. The segment benefits from the growing complexity of semiconductor designs and increasing need for rapid innovation across AI, automotive, and consumer electronics sectors. Licensing models also provide scalability and flexibility for fabless semiconductor companies developing customized chipsets. Continuous expansion of strategic partnerships between IP vendors and chip manufacturers further strengthens market dominance.
The Royalty segment is projected to register the fastest growth at a CAGR of 13.1% from 2026 to 2033, driven by the increasing commercialization of high-volume semiconductor products utilizing licensed intellectual property. Growing adoption of connected devices, AI-enabled processors, and automotive electronics is generating higher royalty-based revenue streams for IP providers. Semiconductor companies are increasingly entering long-term royalty agreements to support continuous technology upgrades and product scalability. Expansion of advanced semiconductor manufacturing in Asia-Pacific and North America is further supporting segment growth. Rising deployment of proprietary chip architectures across data centers and next-generation communication systems is expected to accelerate royalty-based business models globally.
- By Channel
On the basis of channel, the Semiconductor IP market is segmented into Direct Sources and Internet Catalogue. The Direct Sources segment dominated the market with the largest share of 67.2% in 2025, supported by strong preference among semiconductor companies for direct collaboration with IP vendors to ensure technical customization and long-term support services. Direct sourcing enables chip manufacturers to access highly specialized semiconductor architectures tailored to application-specific requirements. Increasing complexity in advanced semiconductor designs is encouraging enterprises to engage directly with IP developers for integration efficiency and performance optimization. The segment also benefits from strategic licensing agreements and joint development partnerships between major semiconductor firms. Rising investments in AI, automotive electronics, and high-performance computing solutions continue to strengthen the dominance of direct distribution channels.
The Internet Catalogue segment is projected to register the fastest growth at a CAGR of 11.8% from 2026 to 2033, driven by increasing digitization of semiconductor procurement and growing accessibility of online IP marketplaces. Internet catalogues provide semiconductor developers with faster evaluation, comparison, and acquisition of standardized IP blocks for rapid prototyping and development. Rising adoption of cloud-based semiconductor design platforms and automated EDA tools is accelerating the use of online sourcing channels. Small and medium-sized fabless companies are increasingly utilizing digital catalogues to reduce procurement costs and improve design efficiency. Expansion of global semiconductor ecosystems and growing preference for streamlined digital licensing models are expected to support strong future growth.
- By End User
On the basis of end user, the Semiconductor IP market is segmented into Automotive, Telecom, Consumer Electronics, Industrial, Defense, Commercial, Medical, and Others. The Consumer Electronics segment dominated the market with the largest share of 34.6% in 2025, driven by strong demand for smartphones, laptops, wearable devices, gaming systems, and smart home technologies. Semiconductor IP solutions are increasingly utilized in consumer devices to support advanced processing, connectivity, graphics performance, and energy efficiency requirements. Rapid innovation cycles within the electronics industry are encouraging manufacturers to adopt reusable semiconductor IP blocks for faster chip development. The segment benefits from growing integration of AI, augmented reality, and IoT functionalities in next-generation devices. Continuous expansion of global consumer electronics production and rising demand for high-performance semiconductor solutions further reinforce segment dominance.
The Automotive segment is projected to register the fastest growth at a CAGR of 15.4% from 2026 to 2033, driven by increasing adoption of electric vehicles, autonomous driving technologies, and advanced driver assistance systems. Automotive manufacturers are integrating advanced semiconductor IP solutions to support vehicle connectivity, battery management, infotainment systems, and real-time processing capabilities. Rising demand for safety-critical semiconductor architectures and high-performance computing platforms is accelerating semiconductor IP deployment across modern vehicles. Expansion of connected mobility infrastructure and vehicle electrification initiatives is further supporting segment growth. Increasing investments in autonomous mobility platforms and software-defined vehicle technologies are expected to significantly accelerate semiconductor IP adoption across the automotive industry.
Asia-Pacific Semiconductor IP Market Regional Analysis
China dominated the Semiconductor IP market and accounted for the largest revenue share of 35.5% in 2025, driven by its strong semiconductor manufacturing ecosystem, large-scale electronics production base, and increasing investments in domestic chip design capabilities. Rising demand for AI processors, consumer electronics, automotive semiconductors, and 5G infrastructure is accelerating adoption of advanced semiconductor IP solutions across the country. Strong government support through semiconductor self-sufficiency initiatives and growing investments in local fabless semiconductor companies further reinforce China’s leadership in the regional market. The presence of major semiconductor manufacturers, increasing RISC-V adoption, and expansion of advanced foundry infrastructure continue to strengthen market competitiveness. Rapid growth of cloud computing, data centers, and intelligent device manufacturing further supports long-term market expansion across China.
Japan Semiconductor IP Market Insight
The Japan market is anticipated to grow steadily from 2026 to 2033, supported by its advanced semiconductor research capabilities, strong automotive electronics industry, and increasing demand for high-performance chip technologies. Japanese semiconductor companies are increasingly adopting advanced processor, memory, and connectivity IP solutions to support automotive automation, robotics, industrial IoT, and AI-enabled applications. Growing focus on energy-efficient semiconductor architectures and next-generation chip design innovation is further supporting market growth. Continuous investments in semiconductor R&D and collaborations between Japanese firms and global semiconductor IP providers are strengthening technology development across the country. Japan’s leadership in automotive semiconductors, precision electronics, and industrial automation continues to reinforce its stable regional market position.
India Semiconductor IP Market Insight
India is projected to register the fastest CAGR of 20.5% in the Asia-Pacific Semiconductor IP market during 2026–2033, fueled by rising government support for domestic semiconductor manufacturing and increasing investments in chip design and electronics production capabilities. Rapid expansion of consumer electronics, automotive electronics, telecommunications infrastructure, and AI-based technologies is accelerating demand for semiconductor IP solutions across the country. The growth of fabless semiconductor startups and increasing adoption of RISC-V processor architectures are further strengthening India’s semiconductor innovation ecosystem. Expanding semiconductor design centers, rising engineering talent availability, and increasing foreign direct investments are improving the country’s competitiveness within the global semiconductor industry. Government initiatives such as Semicon India and growing collaborations with global semiconductor companies continue to support India’s emergence as the fastest-growing semiconductor IP market in the region.
Asia-Pacific Semiconductor IP Market Share
The Semiconductor IP industry is primarily led by well-established companies, including:
- Arm Holdings (U.K.)
- Synopsys, Inc. (U.S.)
- Cadence Design Systems, Inc. (U.S.)
- Imagination Technologies (U.K.)
- Rambus Inc. (U.S.)
- CEVA, Inc. (U.S.)
- VeriSilicon Holdings Co., Ltd. (China)
- Faraday Technology Corporation (Taiwan)
- Achronix Semiconductor Corporation (U.S.)
- Silvaco Group, Inc. (U.S.)
- eMemory Technology Inc. (Taiwan)
- Sonics, Inc. (U.S.)
- Lattice Semiconductor Corporation (U.S.)
- Alphawave Semi (U.K.)
- Arteris, Inc. (U.S.)
- Mentor Graphics Corporation (U.S.)
- Intel Corporation (U.S.)
- NVIDIA Corporation (U.S.)
- Advanced Micro Devices, Inc. (U.S.)
- T2M-IP (India)
Latest Developments in Asia-Pacific Semiconductor IP Market
- In July 2025, the Indian government approved its sixth semiconductor manufacturing facility through a strategic joint venture between HCL Technologies and Foxconn under the India Semiconductor Mission, significantly strengthening the country’s domestic semiconductor manufacturing ecosystem. The development is expected to accelerate India’s transition toward self-reliant chip production by expanding local fabrication capacity and reducing dependence on imported semiconductors. With five additional fabs already under construction, the initiative is creating strong opportunities for upstream and downstream industries including ATMP services, raw material suppliers, equipment vendors, and semiconductor design firms. The government’s continued push for foreign direct investment and advanced semiconductor infrastructure is expected to position India as a major global semiconductor manufacturing destination over the coming years
- In March 2025, Tata Electronics signed a memorandum of understanding with Powerchip Semiconductor Manufacturing Corporation and Himax Technologies to deliver integrated display semiconductor solutions, positively impacting the semiconductor IP and display IC markets. The collaboration strengthens end-to-end semiconductor capabilities across chip design, foundry operations, packaging, and electronics manufacturing services for both domestic and international customers. By combining Tata’s manufacturing infrastructure with PSMC’s fabrication expertise and Himax’s display semiconductor technologies, the partnership is expected to improve supply chain resilience and accelerate development of advanced display IC solutions. The initiative also supports India’s growing focus on expanding high-value semiconductor design and manufacturing capabilities within the global electronics ecosystem
- In February 2025, Siemens Digital Industries Software entered into an exclusive OEM agreement with Alphawave Semi to commercialize advanced high-speed interconnect IP solutions through Siemens’ EDA sales network, supporting growth within the semiconductor IP market. The agreement enables broader industry access to critical technologies including Ethernet, PCIe, CXL, HBM, and UCIe protocols required for advanced SoC development. The partnership enhances the availability of integrated Spec-to-Silicon design solutions, helping semiconductor companies reduce development complexity and improve time-to-market for next-generation chips. The collaboration is also expected to strengthen innovation in AI computing, data centers, networking infrastructure, and high-performance semiconductor applications globally
- In January 2025, the Indian government strengthened its semiconductor self-reliance strategy by targeting the launch of the country’s first domestically manufactured semiconductor chips under the Semicon India initiative, creating significant momentum across the semiconductor manufacturing and IP ecosystem. Backed by an investment commitment of INR76,000 crore and sanctioned projects worth INR1.5 lakh crore, the initiative is accelerating establishment of fabrication plants, semiconductor packaging facilities, and supporting supply chain infrastructure. The proposed Semicon 2.0 policy is expected to attract global equipment manufacturers, material suppliers, and semiconductor design companies to expand local production capabilities. This large-scale ecosystem development is likely to enhance India’s competitiveness within the global semiconductor value chain and encourage long-term technology investments
- In April 2024, Guerrilla RF, Inc. completed the acquisition of Gallium Semiconductor’s portfolio of GaN power amplifiers and front-end modules, strengthening its position within the high-performance semiconductor and RF device market. The acquisition included the transfer of intellectual property assets that enhance Guerrilla RF’s ability to develop advanced gallium nitride technologies for wireless infrastructure, defense systems, and satellite communication applications. The integration of these assets is expected to accelerate commercialization of next-generation RF semiconductor solutions with improved power efficiency and performance capabilities. Growing demand for advanced communication infrastructure and defense electronics is further expected to expand the market impact of this acquisition across global semiconductor industries
SKU-

- Interactive Data Analysis Dashboard
- Company Analysis Dashboard for high growth potential opportunities
- Research Analyst Access for customization & queries
- Competitor Analysis with Interactive dashboard
- Latest News, Updates & Trend analysis
- Harness the Power of Benchmark Analysis for Comprehensive Competitor Tracking
Asia Pacific Semiconductor Ip Market, Supply Chain Analysis and Ecosystem Framework
To support market growth and help clients navigate the impact of geopolitical shifts, DBMR has integrated in-depth supply chain analysis into its Asia Pacific Semiconductor Ip Market research reports. This addition empowers clients to respond effectively to global changes affecting their industries. The supply chain analysis section includes detailed insights such as Asia Pacific Semiconductor Ip Market consumption and production by country, price trend analysis, the impact of tariffs and geopolitical developments, and import and export trends by country and HSN code. It also highlights major suppliers with data on production capacity and company profiles, as well as key importers and exporters. In addition to research, DBMR offers specialized supply chain consulting services backed by over a decade of experience, providing solutions like supplier discovery, supplier risk assessment, price trend analysis, impact evaluation of inflation and trade route changes, and comprehensive market trend analysis.
Data collection and base year analysis are done using data collection modules with large sample sizes. The stage includes obtaining market information or related data through various sources and strategies. It includes examining and planning all the data acquired from the past in advance. It likewise envelops the examination of information inconsistencies seen across different information sources. The market data is analysed and estimated using market statistical and coherent models. Also, market share analysis and key trend analysis are the major success factors in the market report. To know more, please request an analyst call or drop down your inquiry.
The key research methodology used by DBMR research team is data triangulation which involves data mining, analysis of the impact of data variables on the market and primary (industry expert) validation. Data models include Vendor Positioning Grid, Market Time Line Analysis, Market Overview and Guide, Company Positioning Grid, Patent Analysis, Pricing Analysis, Company Market Share Analysis, Standards of Measurement, Global versus Regional and Vendor Share Analysis. To know more about the research methodology, drop in an inquiry to speak to our industry experts.
Data Bridge Market Research is a leader in advanced formative research. We take pride in servicing our existing and new customers with data and analysis that match and suits their goal. The report can be customized to include price trend analysis of target brands understanding the market for additional countries (ask for the list of countries), clinical trial results data, literature review, refurbished market and product base analysis. Market analysis of target competitors can be analyzed from technology-based analysis to market portfolio strategies. We can add as many competitors that you require data about in the format and data style you are looking for. Our team of analysts can also provide you data in crude raw excel files pivot tables (Fact book) or can assist you in creating presentations from the data sets available in the report.


